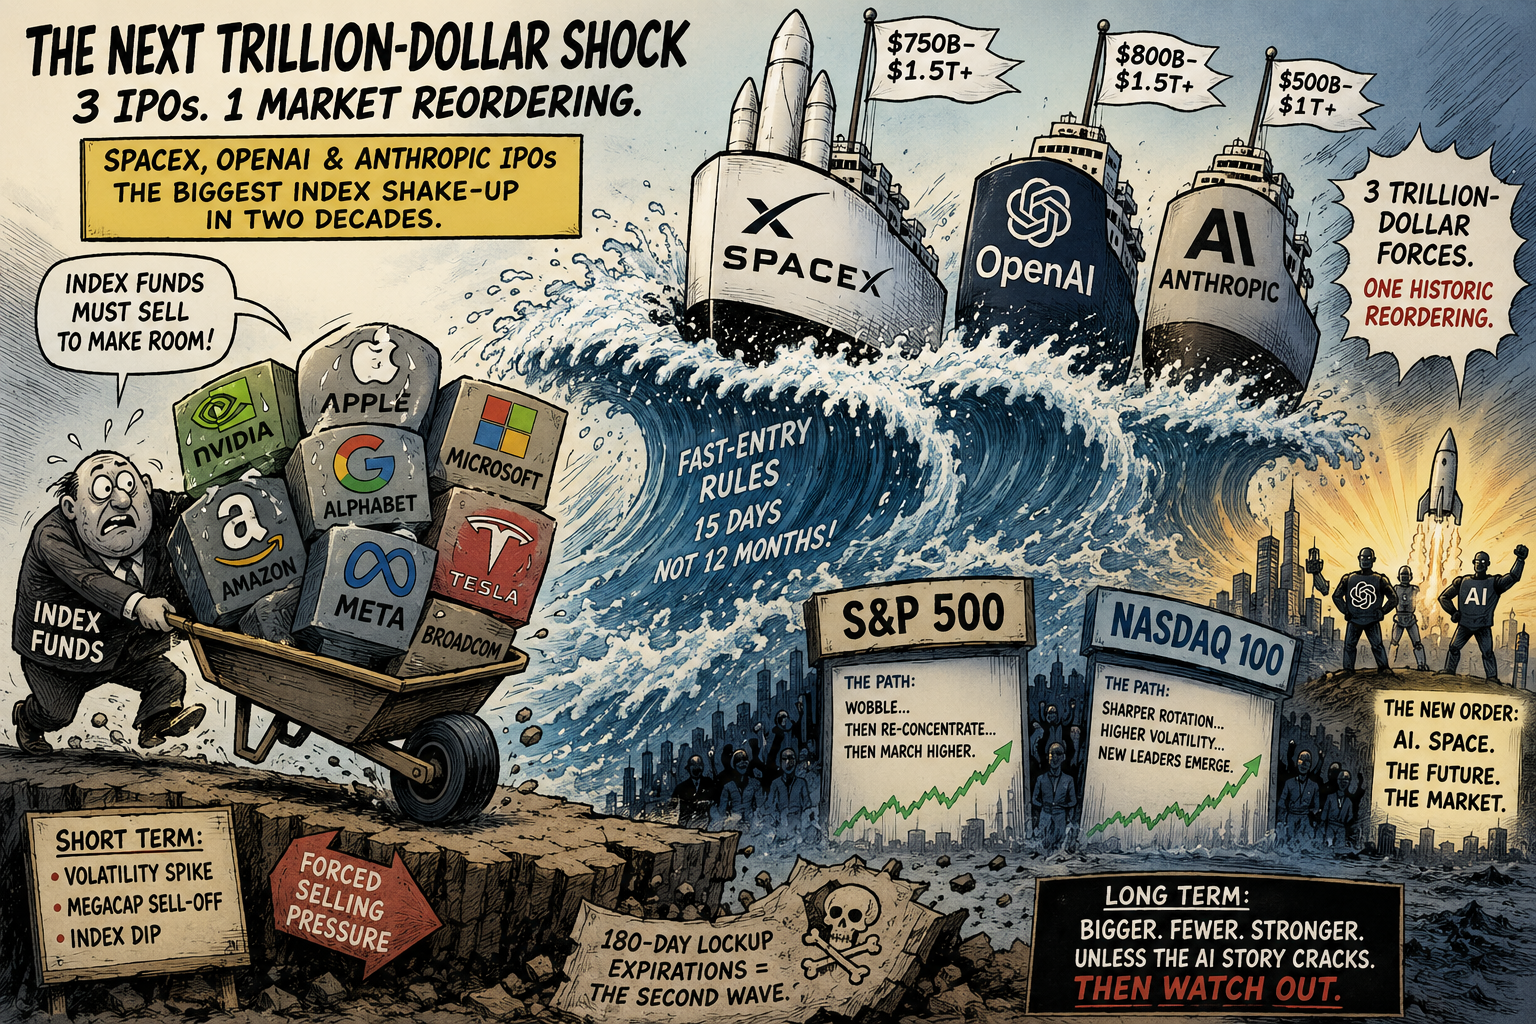
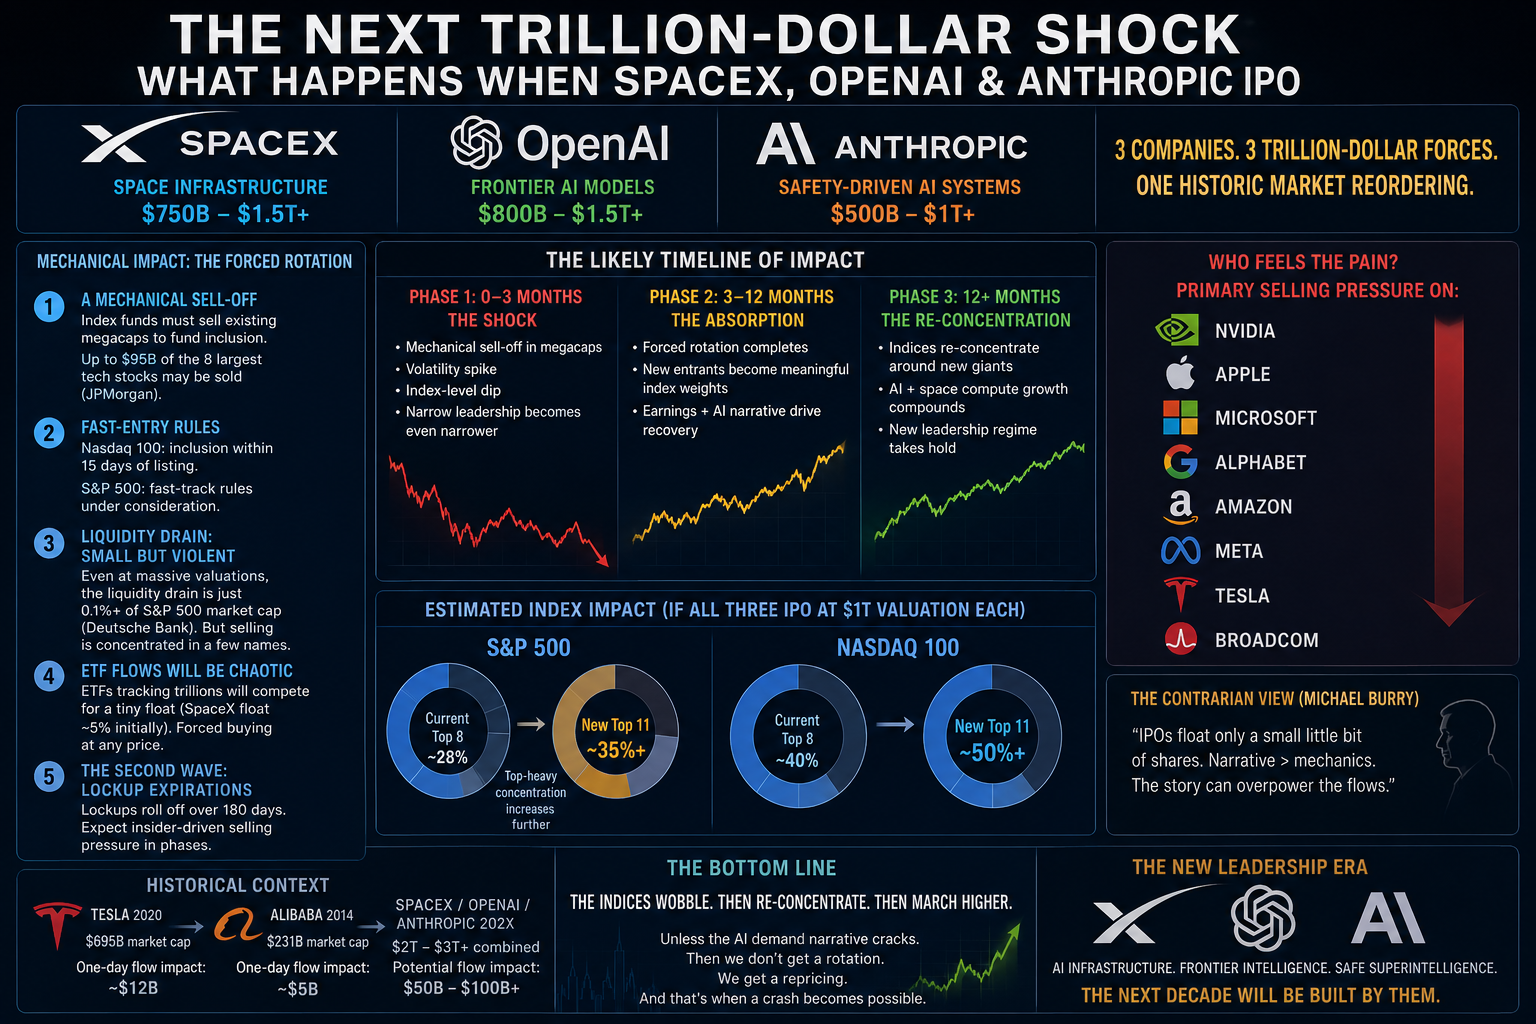
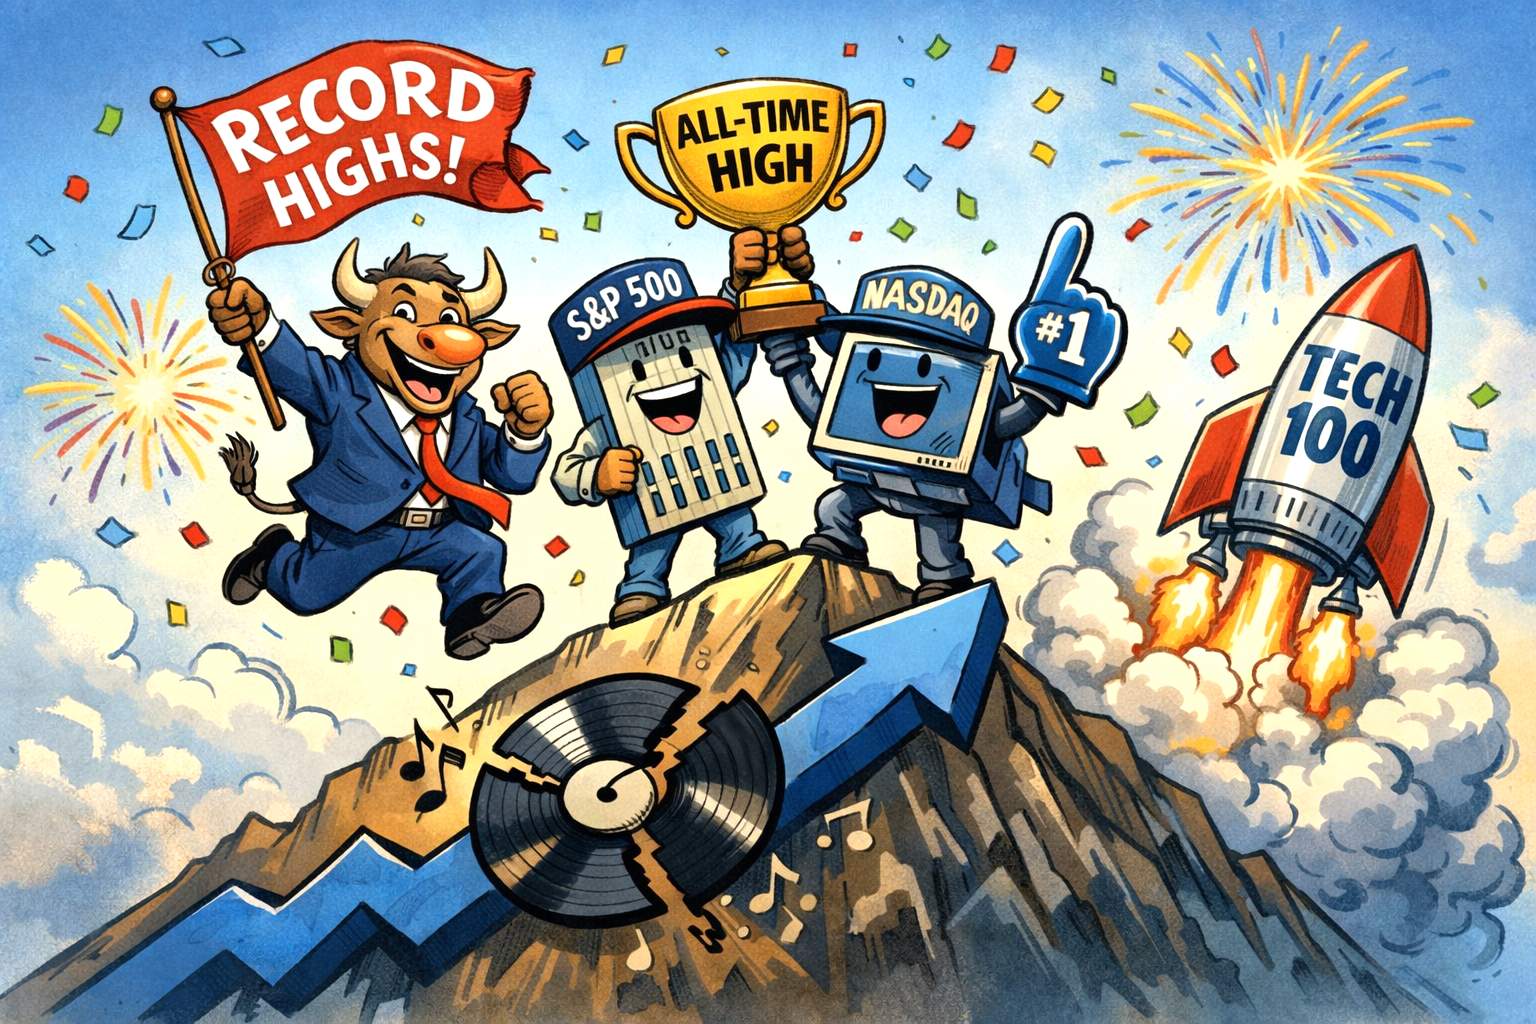
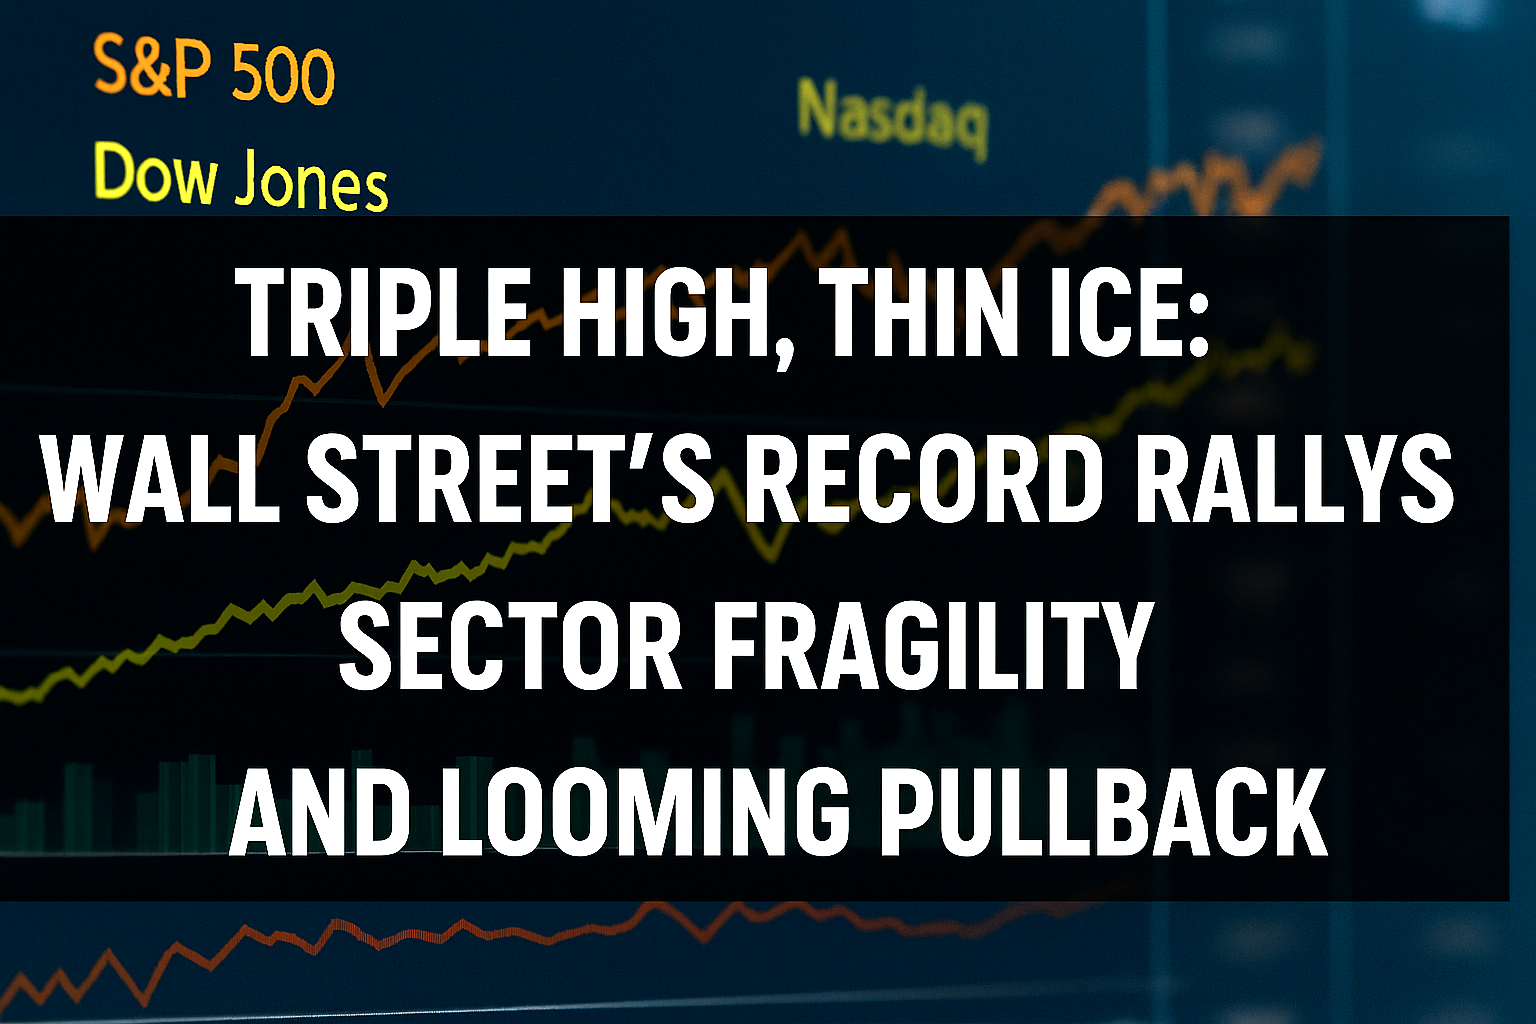
The expected public listings of SpaceX, OpenAI and Anthropic represent the most consequential cluster of IPOs in two decades.
Each company sits at the centre of a structural shift—space infrastructure, frontier AI models and safety‑driven AI systems—and each is likely to command a valuation in the high hundreds of billions, if not beyond.
Their arrival on public markets will not be a routine liquidity event. It will be a reordering of index composition, capital flows and investor psychology.
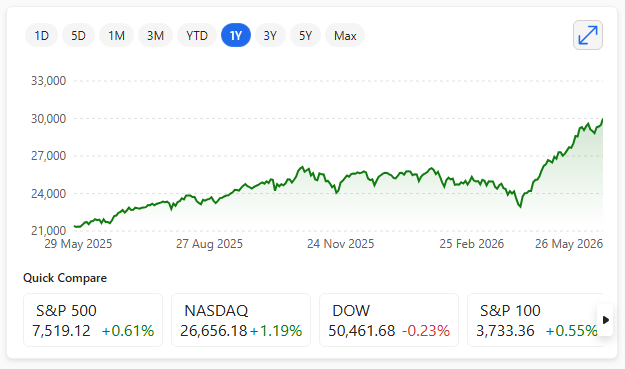
At the mechanical level, the impact on the S&P 500 and Nasdaq will be immediate. Index providers now operate fast‑entry rules that allow very large IPOs to join major benchmarks within days rather than months.
This compresses the adjustment period and forces passive funds to sell existing constituents to make room for the newcomers.
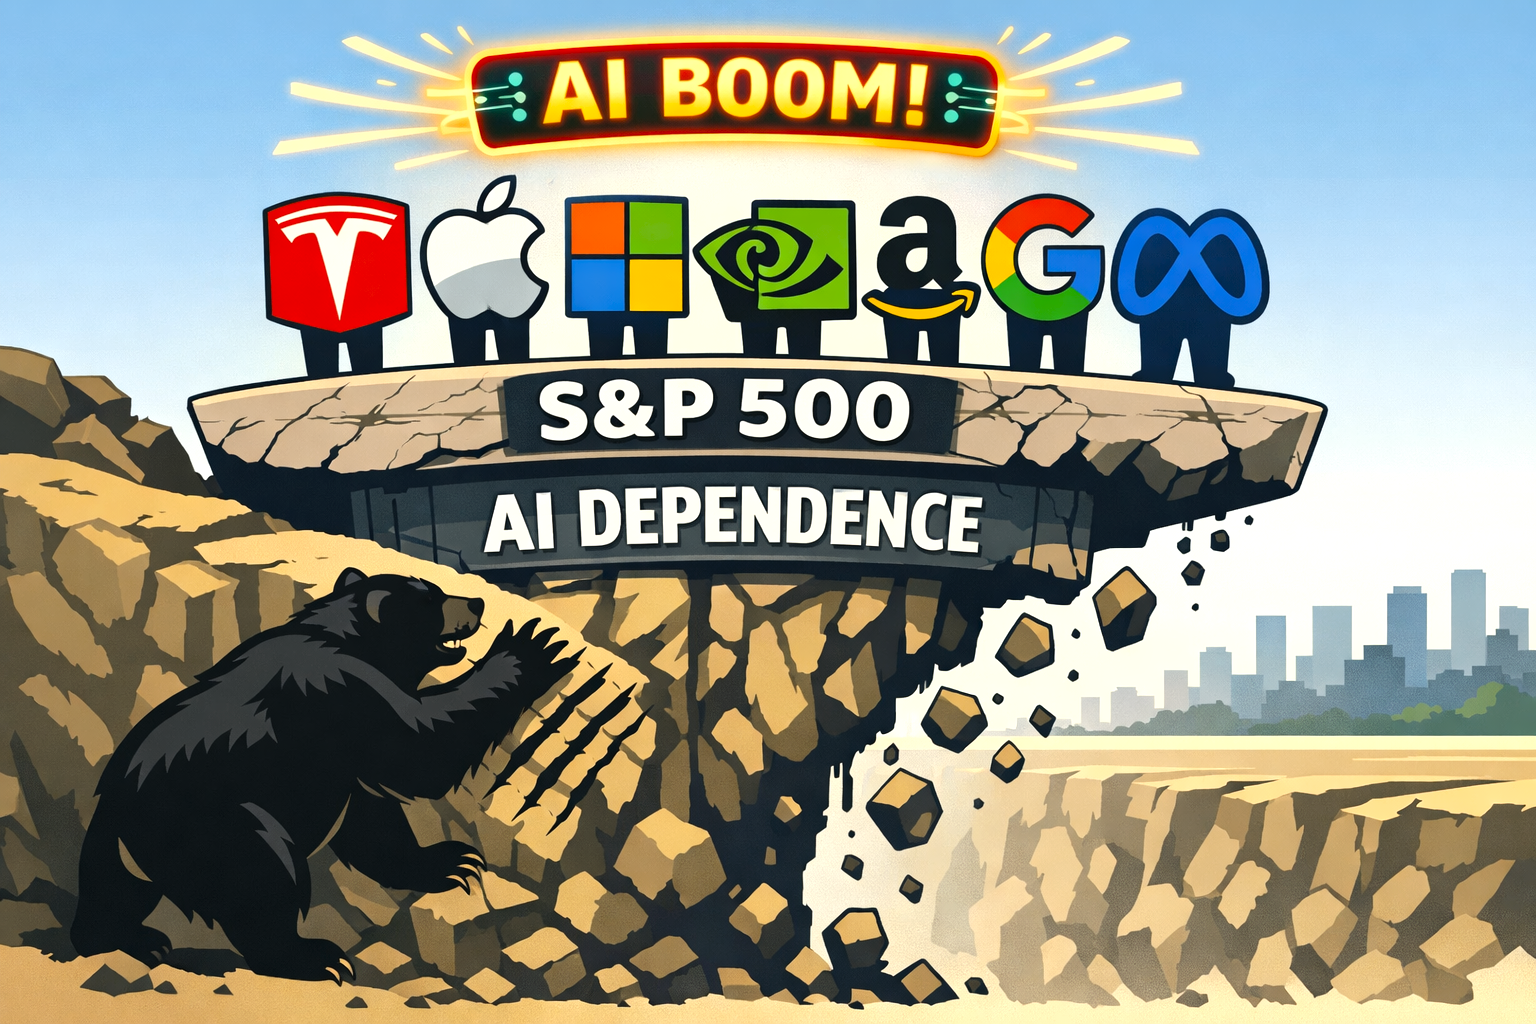
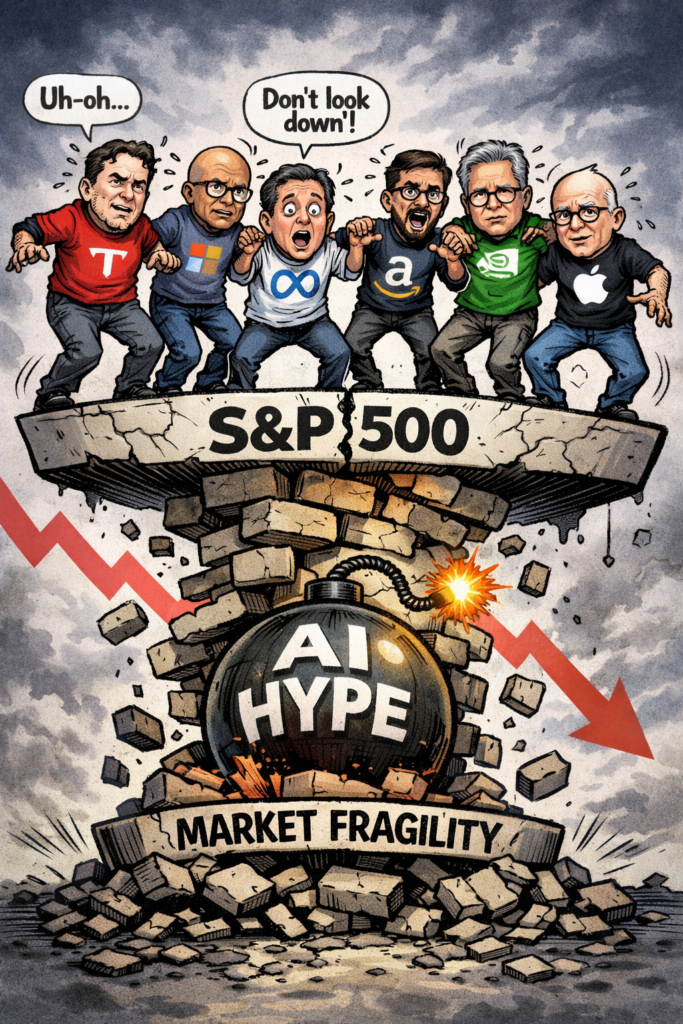
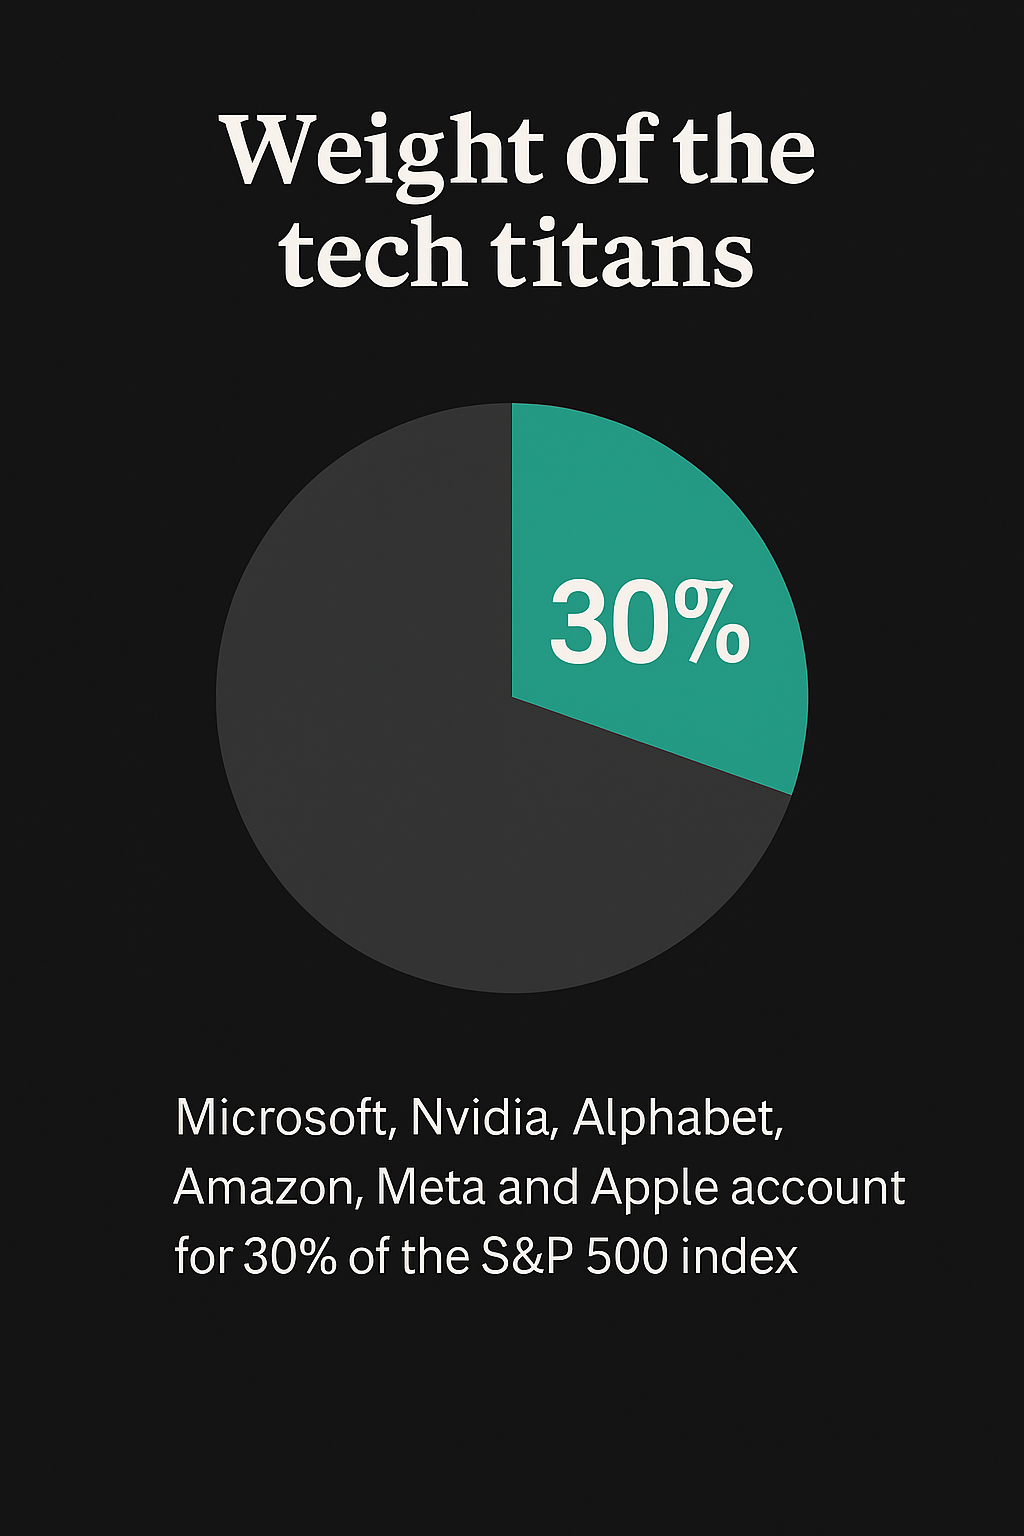
The selling pressure will fall disproportionately on the current megacap cohort—Microsoft, Apple, Alphabet, Amazon, Meta, Nvidia and Tesla—because these names dominate index weightings and therefore become the primary source of liquidity for rebalancing.
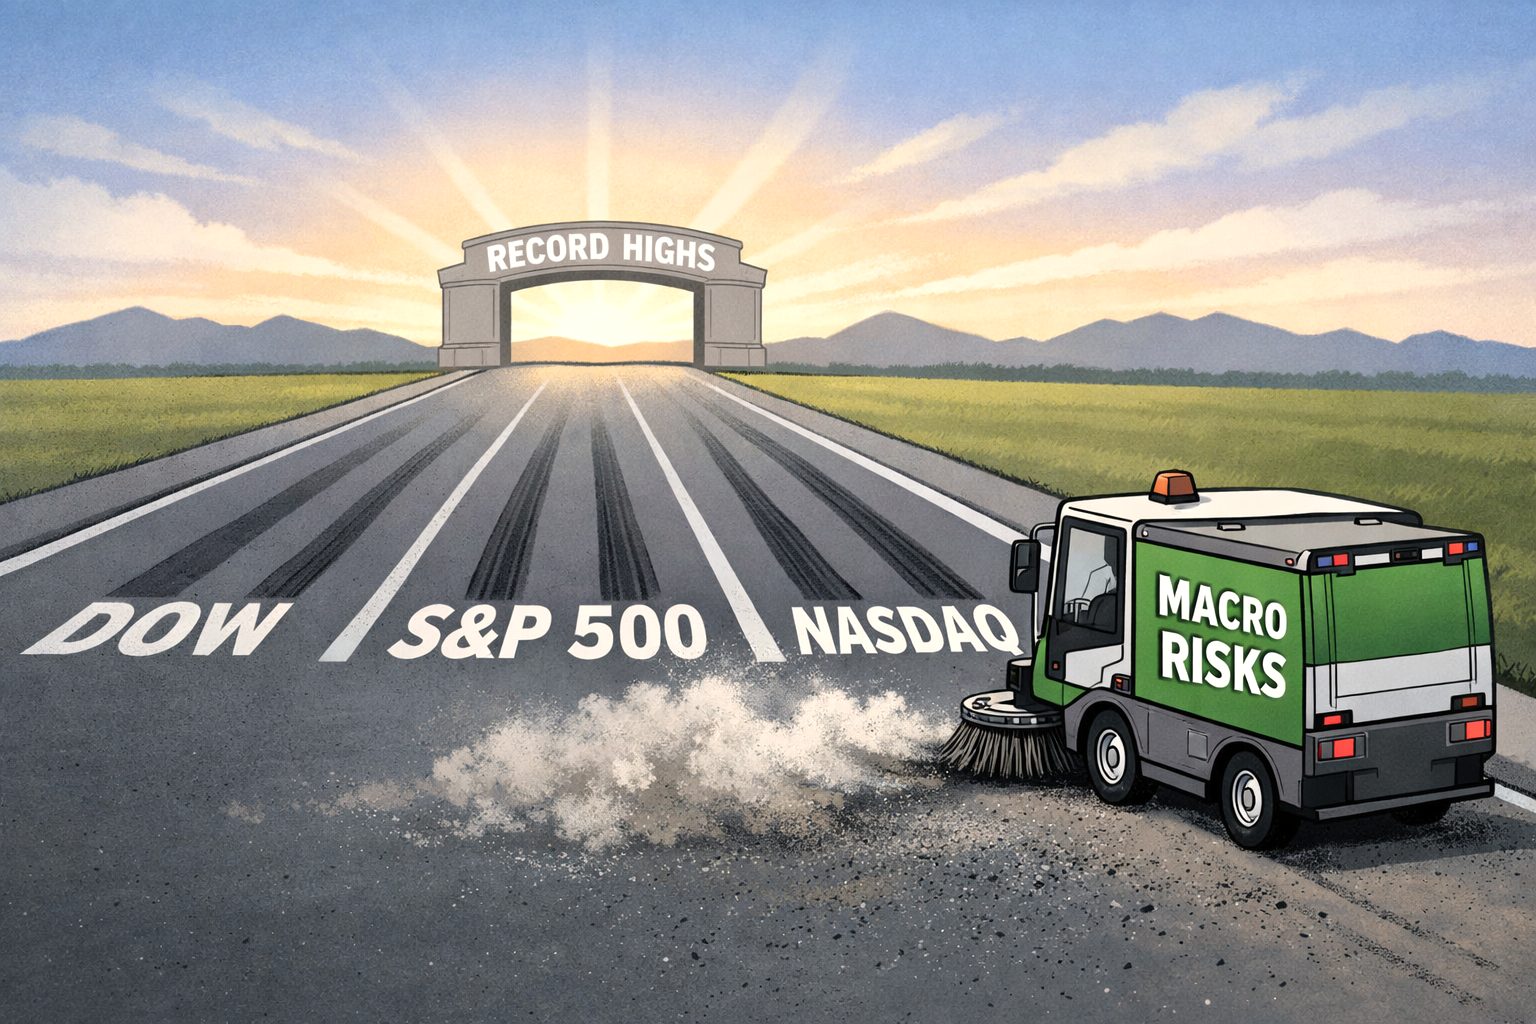
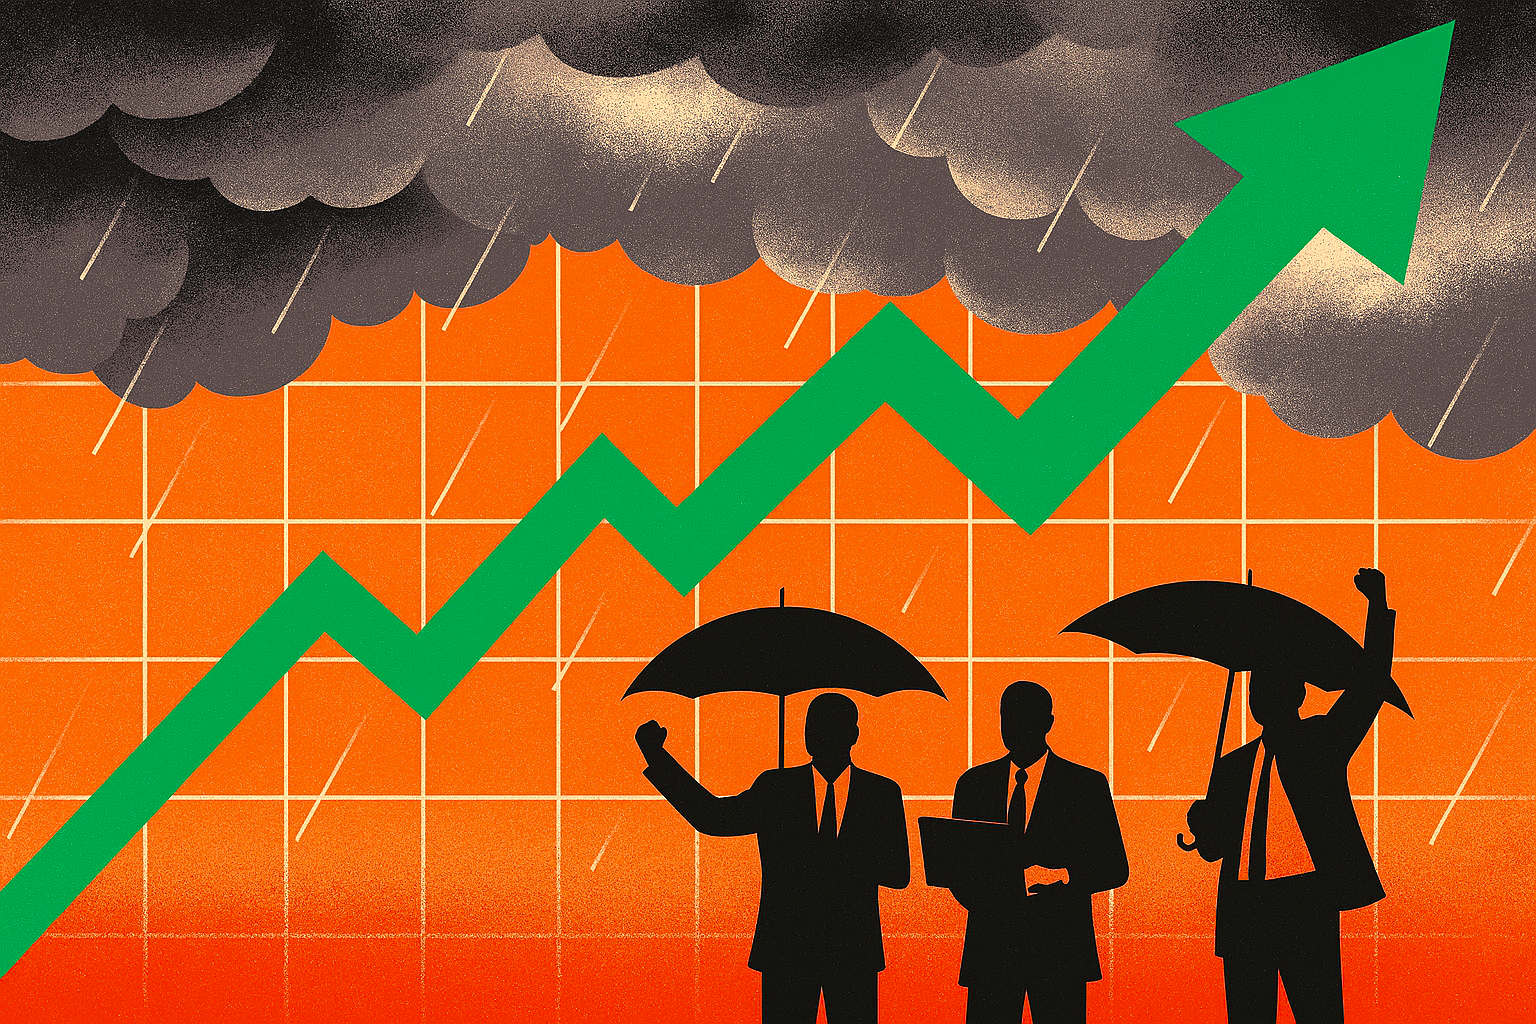
The indices themselves may not fall sharply, but the internal rotation will be violent.
The Nasdaq will feel the shock most acutely. Its concentration in technology means the inclusion of three new giants will trigger a scramble for weight, with ETFs forced to buy limited‑float shares at whatever price the market sets.
The S&P 500, broader and more liquid, will absorb the change more smoothly, but even there the effect will be visible: a temporary dip in existing leaders, a spike in volatility and a rapid reshaping of the top‑ten constituents.
The S&P 500 and Nasdaq will almost certainly experience a temporary liquidity shock, a forced rotation out of existing megacaps, and then—once the dust settles—a re‑concentration around the new AI/space giants.
The scale of SpaceX, OpenAI and Anthropic means the indices will not be able to absorb them quietly.
What will likely happen when SpaceX, OpenAI and Anthropic list their IPOs?
1. A mechanical sell‑off in today’s biggest tech names
Index funds must sell existing holdings to make room for the new entrants.
- Goldman Sachs notes passive funds will need to rebalance as soon as these mega‑caps are added.
- JPMorgan estimates that at a $2T valuation, up to $95bn of the eight largest tech stocks may need to be sold to rebalance portfolios.
This means pressure on Nvidia, Apple, Microsoft, Alphabet, Amazon, Meta, Tesla, Broadcom—the very names currently carrying the indices.
2. Fast‑entry rules accelerate the shock
Nasdaq’s new “fast entry” rules allow these companies to join the Nasdaq 100 within 15 days of listing. S&P Dow Jones is considering similar fast‑track inclusion for mega‑caps. The Motley Fool
This compresses what used to be a 12‑month absorption period into weeks.
3. Liquidity drain is real—but limited in absolute terms
Deutsche Bank estimates that even the largest IPOs would still represent just over 0.1% of S&P 500 market cap. So the market‑wide liquidity drain is modest, but the rotation effect is violent because it concentrates selling in a handful of megacaps.
4. ETF flows will be chaotic
Strategas warns that ETFs tracking trillions will compete for a tiny float, making inclusion “frantic.” SpaceX is reportedly floating only ~5% of shares initially. That means forced buying at any price, followed by forced selling elsewhere.
5. After lockups expire (180 days), the second wave hits
SpaceX’s prospectus notes that selling pressure increases as lockups roll off in phases over 180 days. Expect a two‑stage impact:
- Stage 1: violent index rebalancing
- Stage 2: insider‑driven supply shock
So what happens to the S&P 500?
Short-term (0–3 months after IPOs):
- Mild index-level dip as megacaps are sold to fund inclusion.
- Volatility spike around rebalance windows.
- Narrow leadership becomes even narrower temporarily.
This is consistent with historical mega‑IPO patterns (e.g., Tesla’s inclusion forced tens of billions in one-day flows).
Medium-term (3–12 months):
- The S&P 500 becomes more top‑heavy, not less.
- SpaceX, OpenAI, Anthropic quickly become meaningful index weights due to their trillion‑dollar valuations.
- If AI earnings continue to dominate, the index likely recovers and re‑concentrates around the new entrants.
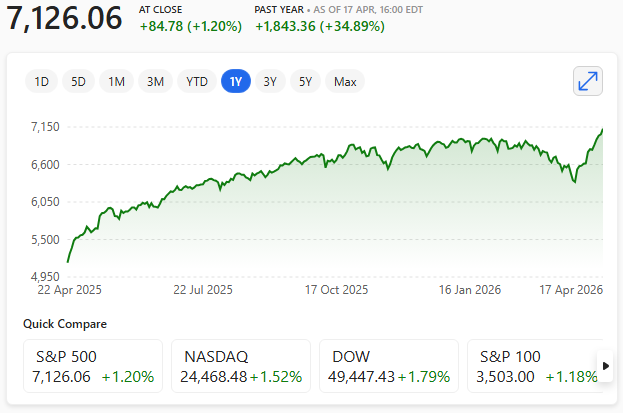
HSBC reportedly notes that stronger tech valuations—especially from high‑valuation IPOs—could push the S&P 500 above 8,000 if earnings broaden.
What about the Nasdaq?
The Nasdaq 100 is hit harder because:
- It is more tech‑concentrated.
- Fast‑entry rules force inclusion within 15 days.
Expect:
- Sharper rotation, especially out of semiconductor and hyperscaler names.
- Higher volatility as QQQ must buy the new entrants aggressively.
- A structural reshaping: SpaceX, OpenAI and Anthropic could become low‑ to mid‑single‑digit weights almost immediately.
The contrarian view (Michael Burry)
Burry argues the IPOs won’t break the bull market, because IPOs float only a “small little bit” of shares, limiting true supply impact. He believes narrative > mechanics.
There’s truth in that: the story of AI and space‑compute may ultimately lift the indices after the initial turbulence.
My Opinion
Short-term: Expect a sell‑off in existing megacaps, a volatility spike, and mechanical downward pressure on both S&P 500 and Nasdaq.
Medium-term: Once the forced rotation is complete, the indices likely resume their upward trend, now with three new trillion‑dollar engines powering them.
Long-term: This is the biggest index‑composition shock since the dot‑com era. The S&P 500 and Nasdaq will become even more dominated by AI‑infrastructure and space‑compute giants.
In other words: the indices wobble, then re‑concentrate, then march higher—unless AI demand itself cracks.
If that happens then we’ll most likely witness a crash!