The artificial intelligence boom faces a potentially dangerous turning point. After years of extraordinary investment, soaring valuations and relentless enthusiasm, cracks are emerging in the credit markets that have helped finance America’s AI revolution.
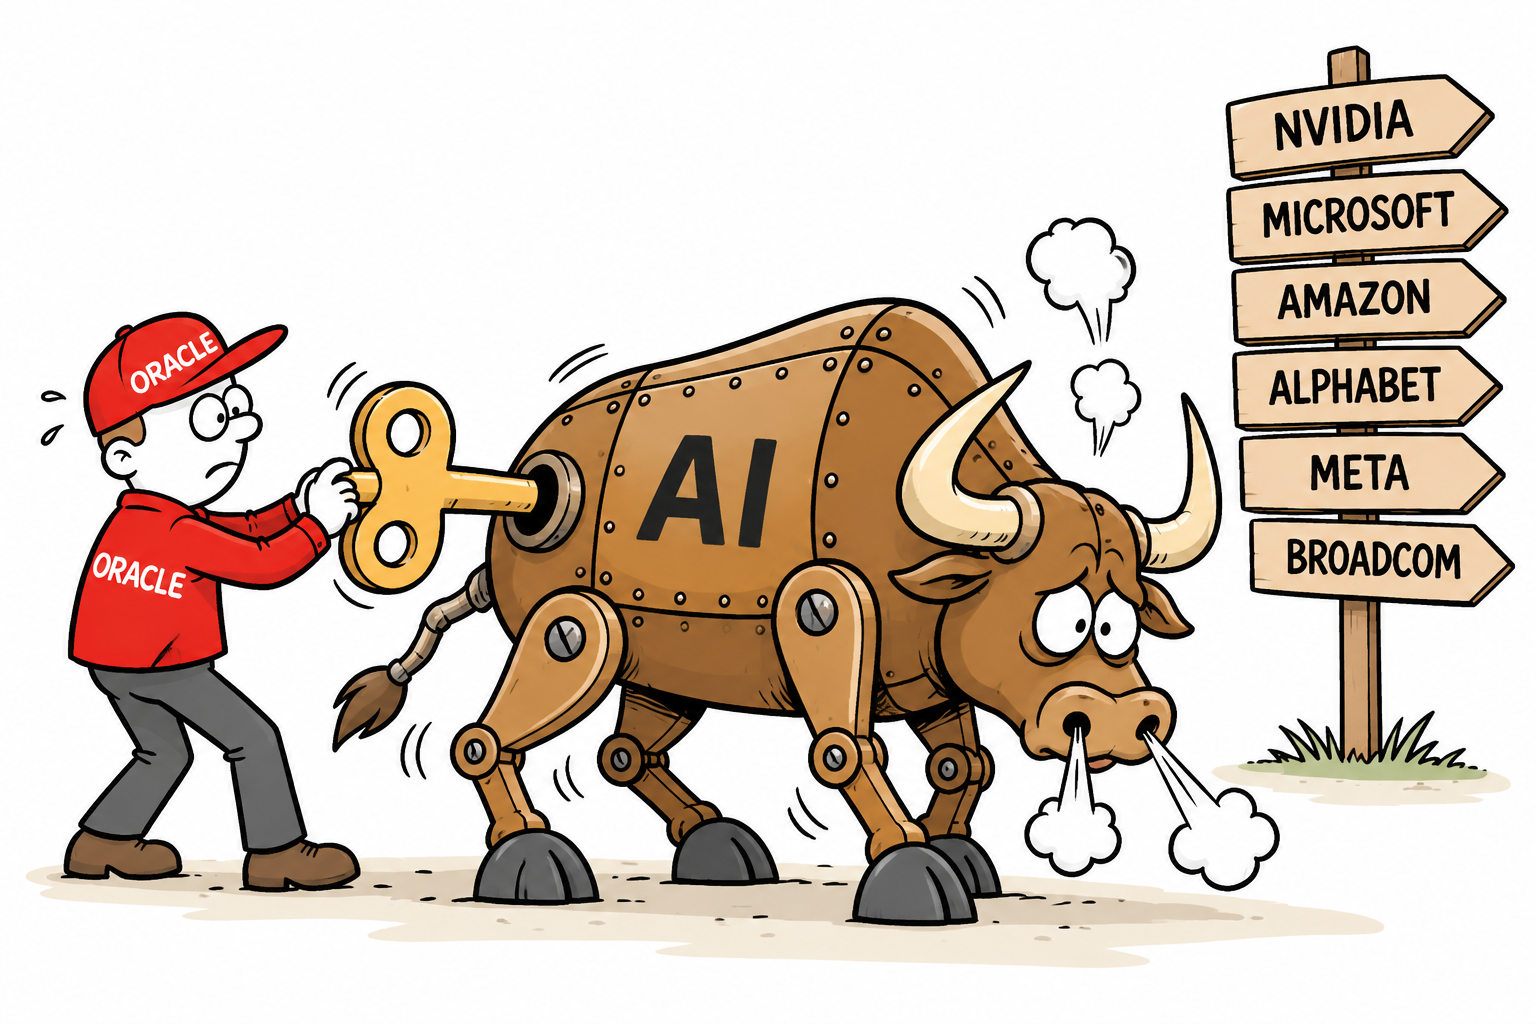
At the centre of the storm stands Oracle, increasingly regarded as a barometer of whether the debt-fuelled AI expansion can continue.
Nervous
Investors are becoming nervous about the enormous borrowing required to construct data centres, purchase advanced chips and develop the infrastructure supporting artificial intelligence.
The warning signs are unmistakable
Oracle’s five-year credit default swap (CDS) spreads, effectively the cost of insuring against debt default, reportedly reached a record 288 basis points on 15th October 2026.
Meanwhile, heavily indebted AI infrastructure provider CoreWeave has seen its spreads exceed 1,000 basis point.
These figures do not indicate imminent defaults, but they reveal growing anxiety about the sustainability of AI financing.
The implications for Wall Street could be substantial
Oracle must convince investors that its enormous infrastructure commitments can generate sufficient revenues and cash flow to justify mounting financial obligations.
Should confidence deteriorate further, borrowing costs could rise, financing could become harder to secure and ambitious AI expansion plans could face delays.
That would threaten companies throughout the AI ecosystem
Nvidia, Broadcom and other semiconductor suppliers depend heavily on continued infrastructure spending. Microsoft, Amazon, Alphabet and Meta could also face increasing scrutiny over their enormous capital expenditure commitments.
The technology-heavy Nasdaq would be particularly vulnerable, while the broader S&P 500 could suffer from its substantial exposure to America’s largest technology companies.
A prolonged credit squeeze could trigger further selling, valuation compression and a rotation towards less capital-intensive sectors.
However, an AI collapse is far from inevitable
Strong earnings, continued demand for computing power and credible financing arrangements could restore confidence. Indeed, American technology stocks rebounded on Monday following the previous week’s sharp declines.
Nevertheless, the balance of risk appears increasingly uncomfortable.
The greatest danger is that a credit crisis develops before AI revenues can justify the investment.
Oracle may not determine the entire AI industry’s future, but its ability to reassure lenders could influence whether Wall Street’s extraordinary technology bull market survives its next major test.
The U.S. stock market continues to defy those warning that valuations, concentration and excessive optimism have created a dangerous combination.
Yet the question is no longer simply whether American shares are expensive. It is whether the assumptions supporting those valuations can continue to hold.
The S&P 500 has become increasingly dependent on a relatively small number of giant companies, many of which are at the centre of the artificial intelligence boom.
That concentration has become one of the most important — and potentially overlooked — risks facing investors.
A market increasingly dominated by a handful of companies
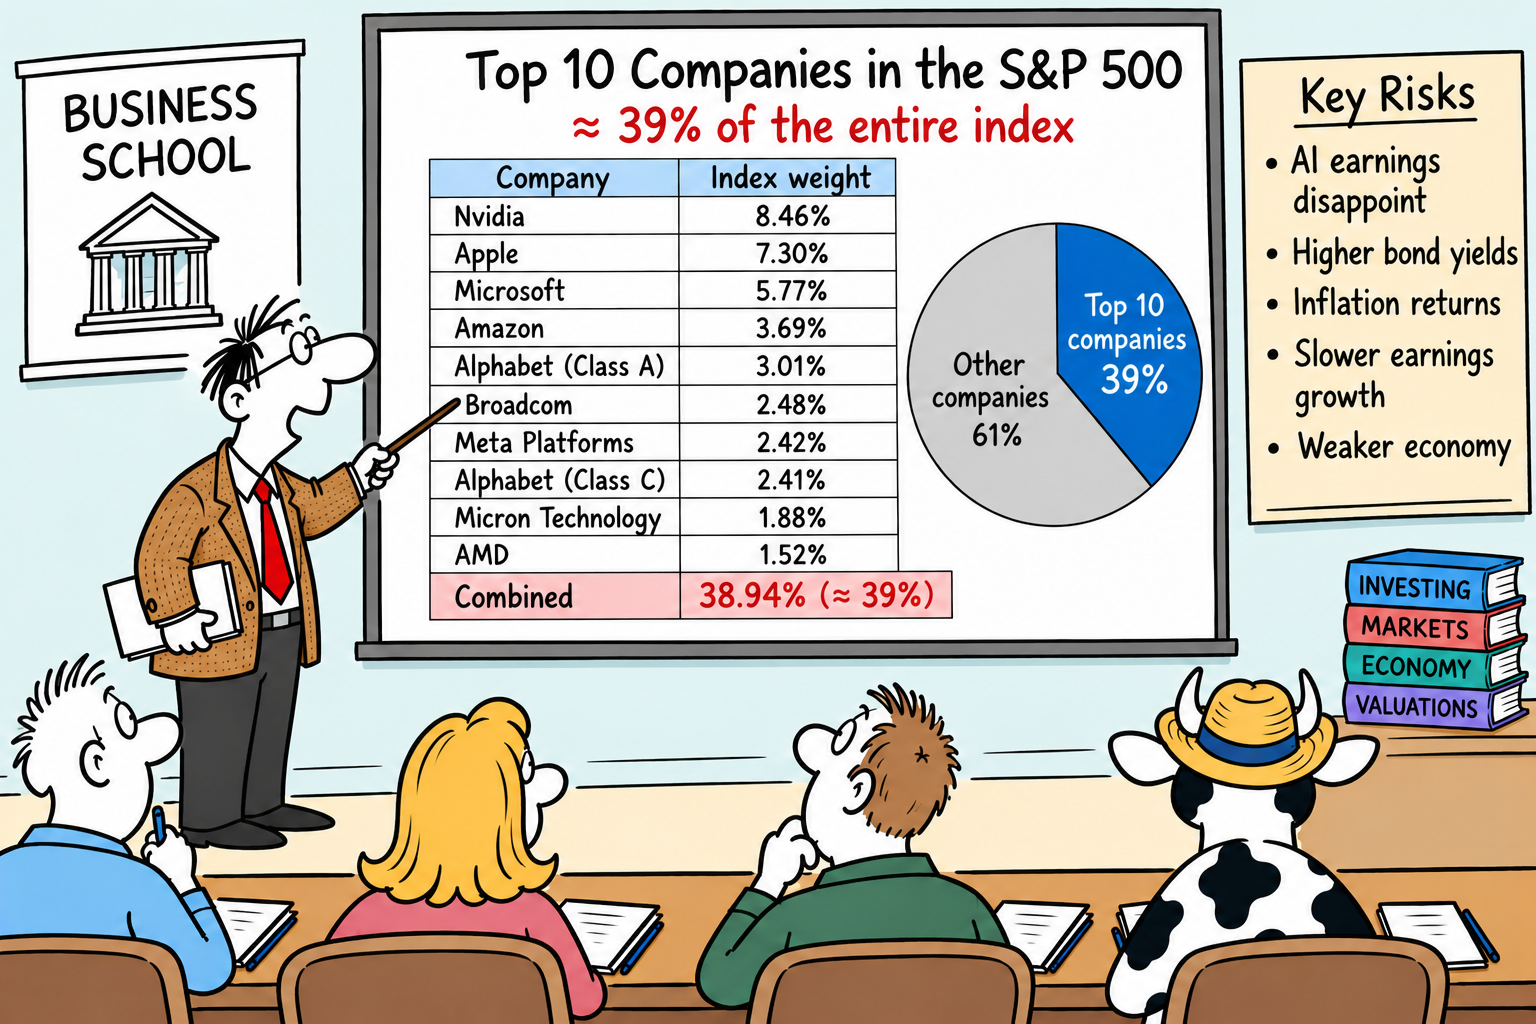
The ten largest holdings account for approximately 39% of the entire S&P 500 index, according to the holdings figures used for this analysis. Alphabet appears twice because its Class A and Class C shares are separate index constituents.
Company
Approx. index weighting
Nvidia
8.46%
Apple
7.30%
Microsoft
5.77%
Amazon
3.69%
Alphabet Class A
3.01%
Broadcom
2.48%
Meta Platforms
2.42%
Alphabet Class C
2.41%
Micron Technology
1.88%
AMD
1.52%
Combined
38.94% (≈39%)
Note: These are the approximate holdings weights used in the original analysis, dated 1st October 2026. Index weightings change as share prices move.
Look beyond the individual names and the concentration becomes even more striking. Nvidia alone represents more than 8% of the index, while Alphabet’s two share classes together account for more than 5%. These companies also have enormous exposure to the AI investment boom.
That matters because a correction in one or two companies would not necessarily threaten the wider market. But if investors simultaneously lose confidence in the AI trade, the consequences could be considerably larger.
The AI assumption
Investors have poured enormous amounts of money into companies expected to benefit from artificial intelligence, while the world’s largest technology companies are committing vast sums to data centres, semiconductors and computing infrastructure.
For now, strong corporate earnings have provided justification for much of the optimism. But this is where the greatest risk may lie.
The market does not necessarily need AI to fail. Investors simply need to become less convinced that the enormous capital being committed today will generate sufficiently large profits in the future.
If the returns from AI investment take longer to materialise, or if competition forces companies to spend more to maintain their position, valuations could come under pressure.
Are valuations too high?
Valuations are certainly elevated by historical standards.
That does not automatically mean a crash is imminent. Expensive markets can remain expensive for years if corporate earnings continue to grow strongly.
The more important question is whether earnings can grow quickly enough to justify today’s prices.
This distinction is particularly important because the S&P 500 is a market-capitalisation-weighted index. When Nvidia, Apple and Microsoft rise sharply, they have a much greater influence on the index than hundreds of smaller companies.
In other words, the S&P 500 can appear remarkably strong even when performance underneath the surface is considerably less impressive.
That creates a potential vulnerability.
Treasury yields could become the trigger
Bond yields represent another major threat.
Higher Treasury yields give investors an increasingly attractive alternative to equities. They also reduce the present value of future corporate profits, which particularly affects companies whose valuations depend heavily on strong growth many years into the future.
If U.S. Treasury yields remain elevated, investors may eventually become less willing to pay premium prices for technology and AI companies.
The problem is that higher yields can put pressure on share prices even when companies continue to report rising profits. Investors may simply decide that those profits are worth less today.
Then there is inflation
A renewed rise in energy prices could make the situation considerably more difficult.
Higher oil prices can feed directly into inflation, making it harder for the Federal Reserve to cut interest rates. That could keep borrowing costs and Treasury yields higher for longer.
The combination of higher inflation, higher bond yields and slowing earnings growth would be particularly uncomfortable for a market trading at elevated valuations.
Geopolitical tensions, tariffs and disruptions to energy supplies could add to the pressure, while higher borrowing costs would affect businesses and households alike.
What would actually reverse the bull market?
The most dangerous scenario would not necessarily be a single event. It could be a combination of several developments:
AI investment disappoints: expected returns fail to justify the enormous sums being spent.
Corporate earnings growth slows: companies deliver less than investors have priced in.
Treasury yields remain high: bonds become more competitive with equities.
Inflation returns: energy prices or other costs prevent interest rates from falling.
The economy weakens: consumers spend less and corporate revenues come under pressure.
Valuations contract: investors become unwilling to pay such high multiples for future earnings.
Any one of these could cause volatility. Several occurring together could turn a normal correction into something much more serious.
The S&P 500 does not necessarily need a recession to fall sharply. If investors simply decide that today’s earnings forecasts are too optimistic, valuations could contract significantly.
Because almost four-tenths of the index is concentrated in just ten holdings, a simultaneous sell-off in major technology and AI-related shares could have an outsized effect on the entire market.
A correction without a recession?
Consider a simplified illustration. If the S&P 500 were trading at 7,800, earnings expectations subsequently fell by 10%, and investors reduced the valuation multiple from 19 times earnings to 16 times, the index could theoretically fall to around 5,900.
That would represent a decline of approximately 24%, without requiring an economic catastrophe.
This is an illustration rather than a market forecast, but it demonstrates how falling earnings expectations and lower valuations can reinforce each other.
And finally
The U.S. stock market is not necessarily a bubble simply because valuations are high. These are profitable, enormously successful companies with genuine earnings and powerful businesses.
But the market has increasingly priced in an exceptionally good future.
The bull market can therefore continue if earnings keep delivering. AI investment may generate substantial returns, inflation may remain contained, and Treasury yields may eventually fall.
However, if those assumptions begin to unravel, investors may discover that the market has been priced for very little disappointment.
The greatest threat to the U.S. bull market may therefore not be that AI is over — but that expectations for AI have simply become too high.
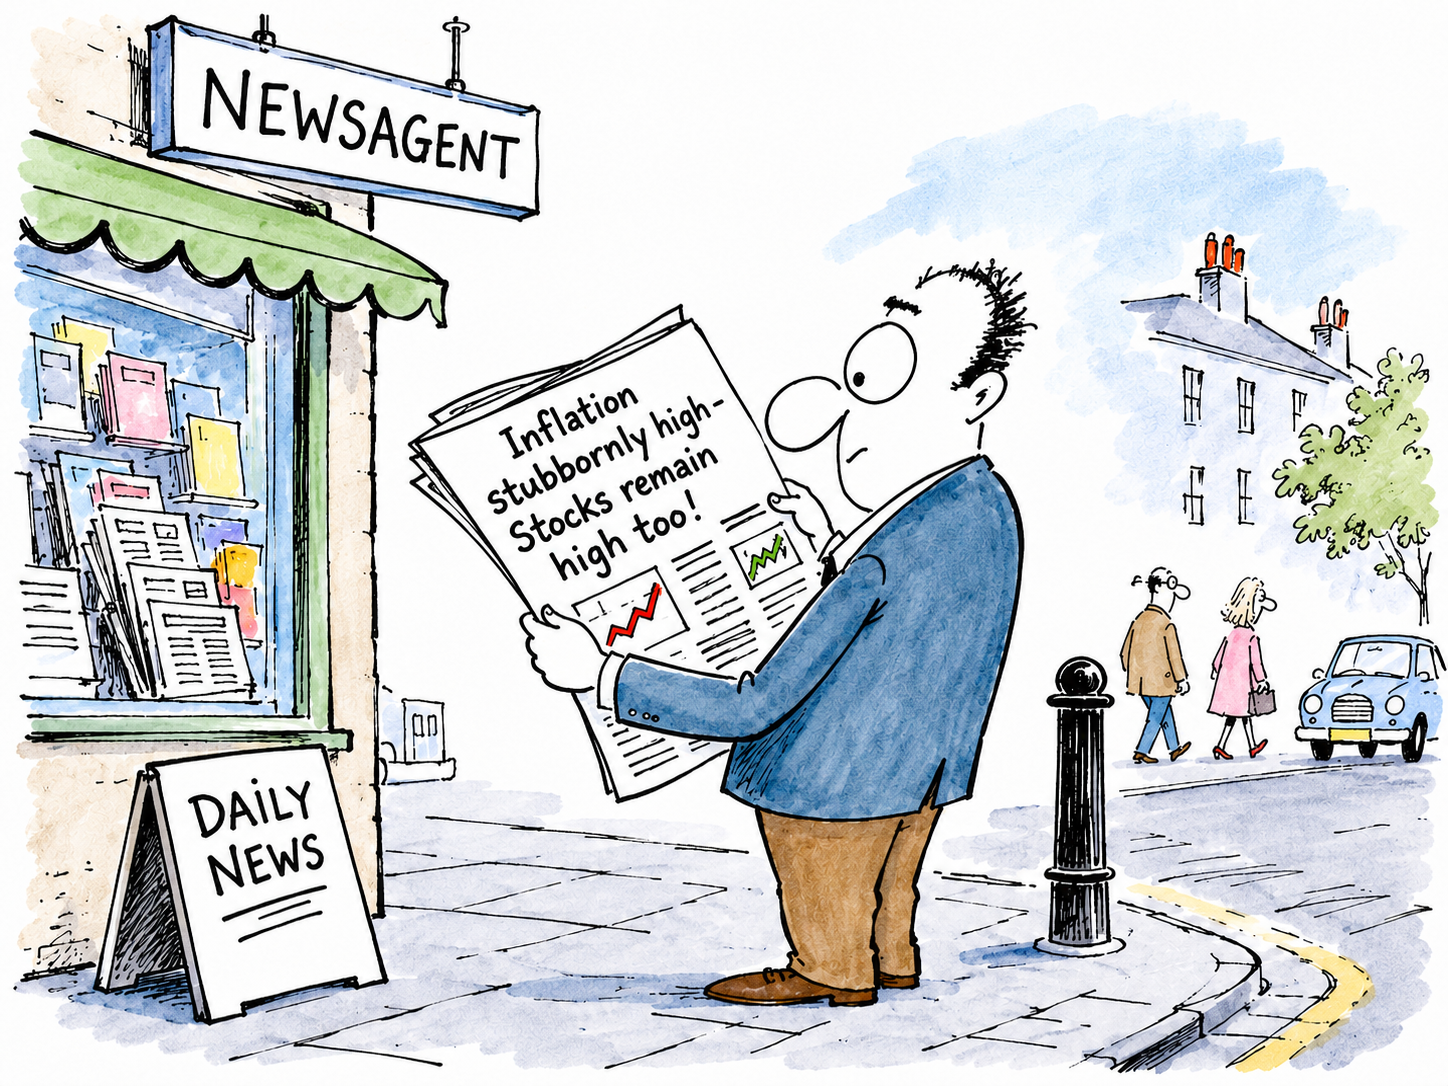
U.S. inflation accelerated in September 2026, raising fresh concerns that the Federal Reserve may struggle to bring price increases under control without keeping interest rates higher for longer.
CPI
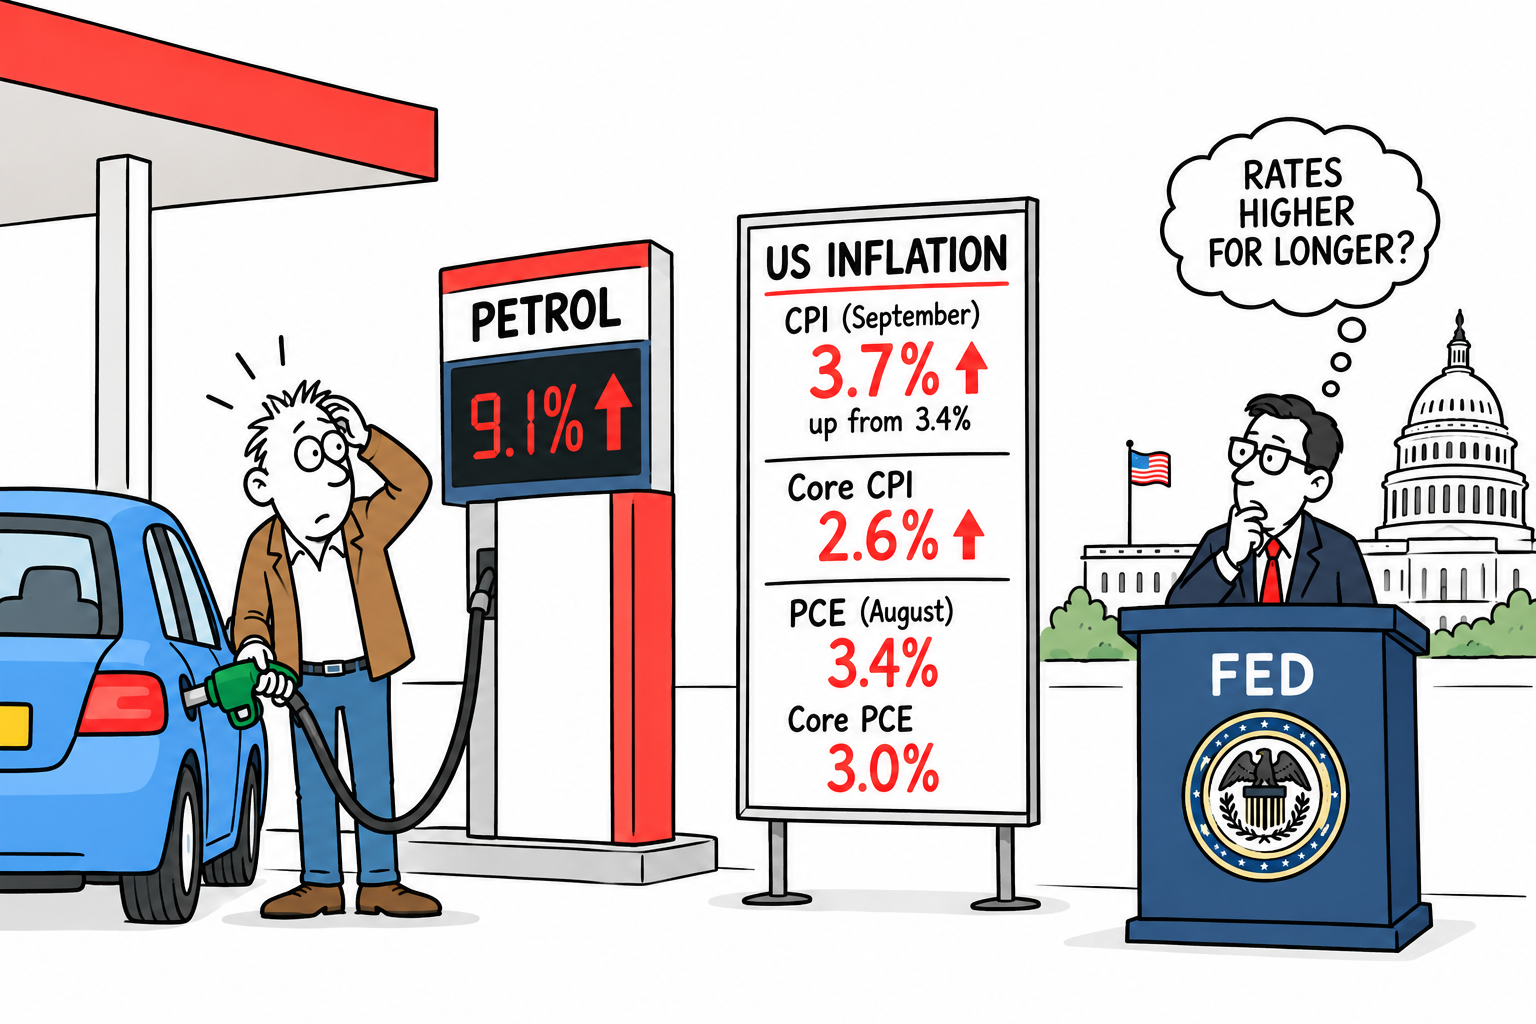
The Consumer Price Index (CPI) rose by 3.7% over the year to September, up from 3.4% in August. Monthly inflation reached 0.6%, driven largely by a sharp 9.1% increase in petrol prices. Core CPI, which excludes food and energy, rose by 2.6% annually.
The figures highlight the growing threat from rising energy costs, which can feed through into transport, manufacturing and household bills, putting further pressure on consumers.
Core PCE, excluding food and energy, stood at 3.0%. Monthly increases were 0.3% and 0.2%, respectively.
Both measures remain above the Fed’s 2% inflation target, complicating decisions over interest rates. Renewed inflationary pressure could delay rate cuts or increase the prospect of further tightening.
For financial markets, the combination of stubborn inflation, rising energy prices and elevated borrowing costs presents a challenging outlook.
Investors will be watching the next PCE figures, due on 29th October 2026, for clues about the direction of U.S. monetary policy.
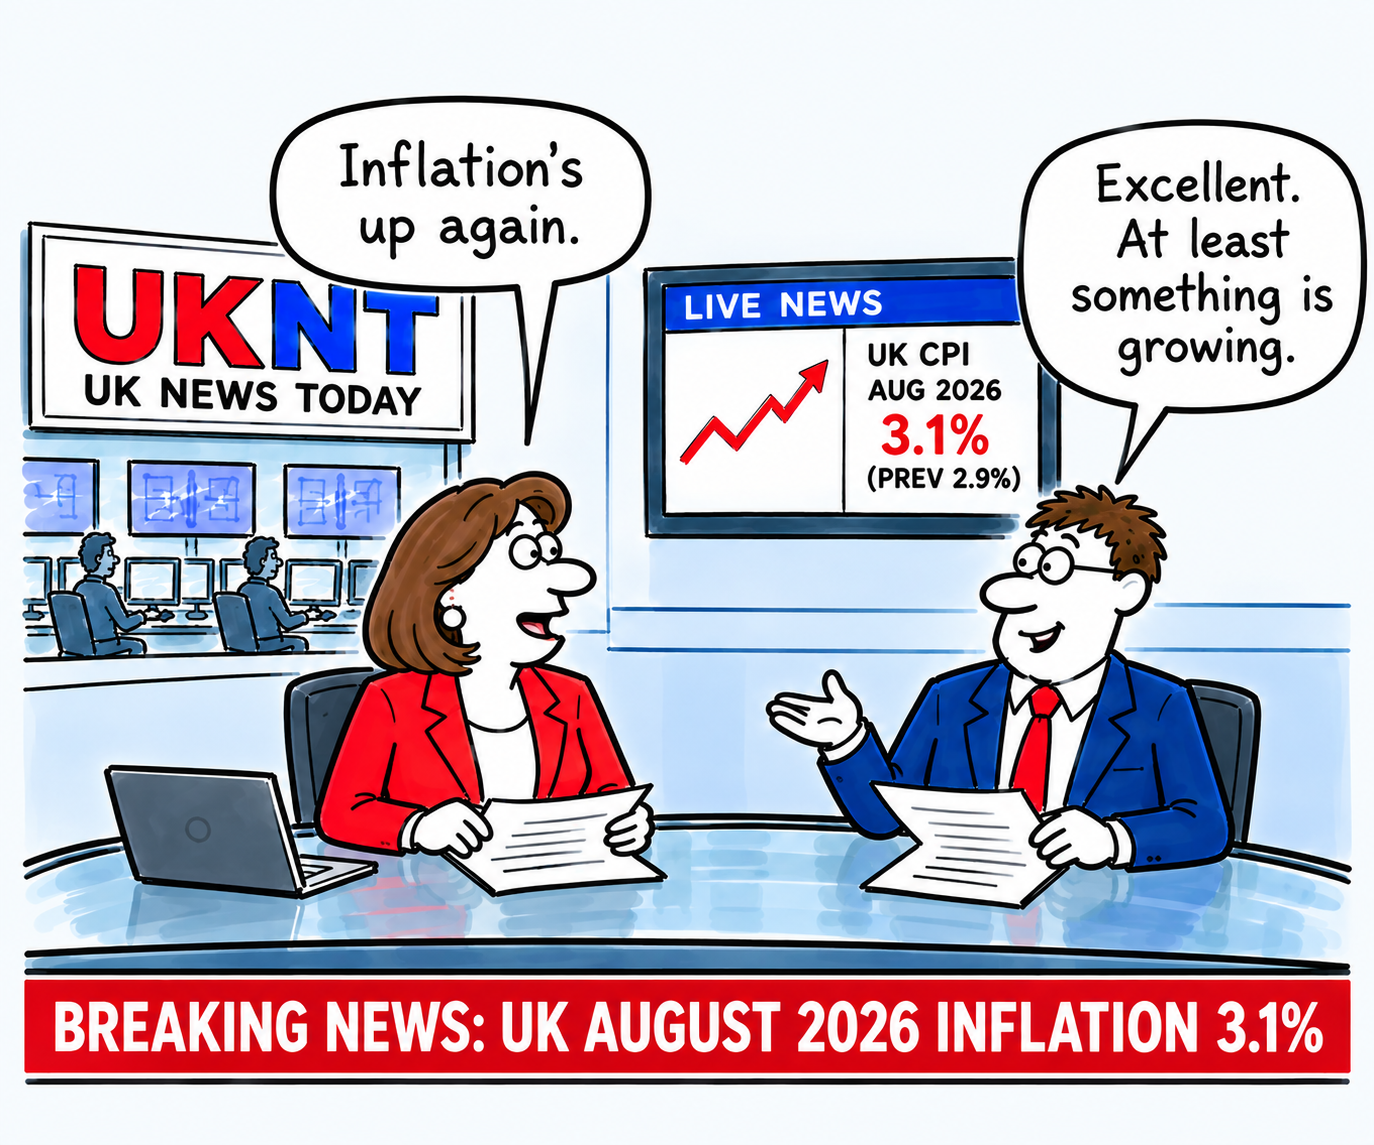
UK inflation has risen to 3.1% in August 2026, up from 2.9% in July, according to the latest figures from the Office for National Statistics.
The increase was driven largely by higher petrol and diesel prices, with transport making the biggest contribution to the rise. Airfares also added to inflationary pressures.
The latest figure is now well above the Bank of England’s 2% target, adding another complication for policymakers considering the future path of interest rates.
However, core inflation remained unchanged at 2.6%, suggesting underlying price pressures have not accelerated across the UK economy.
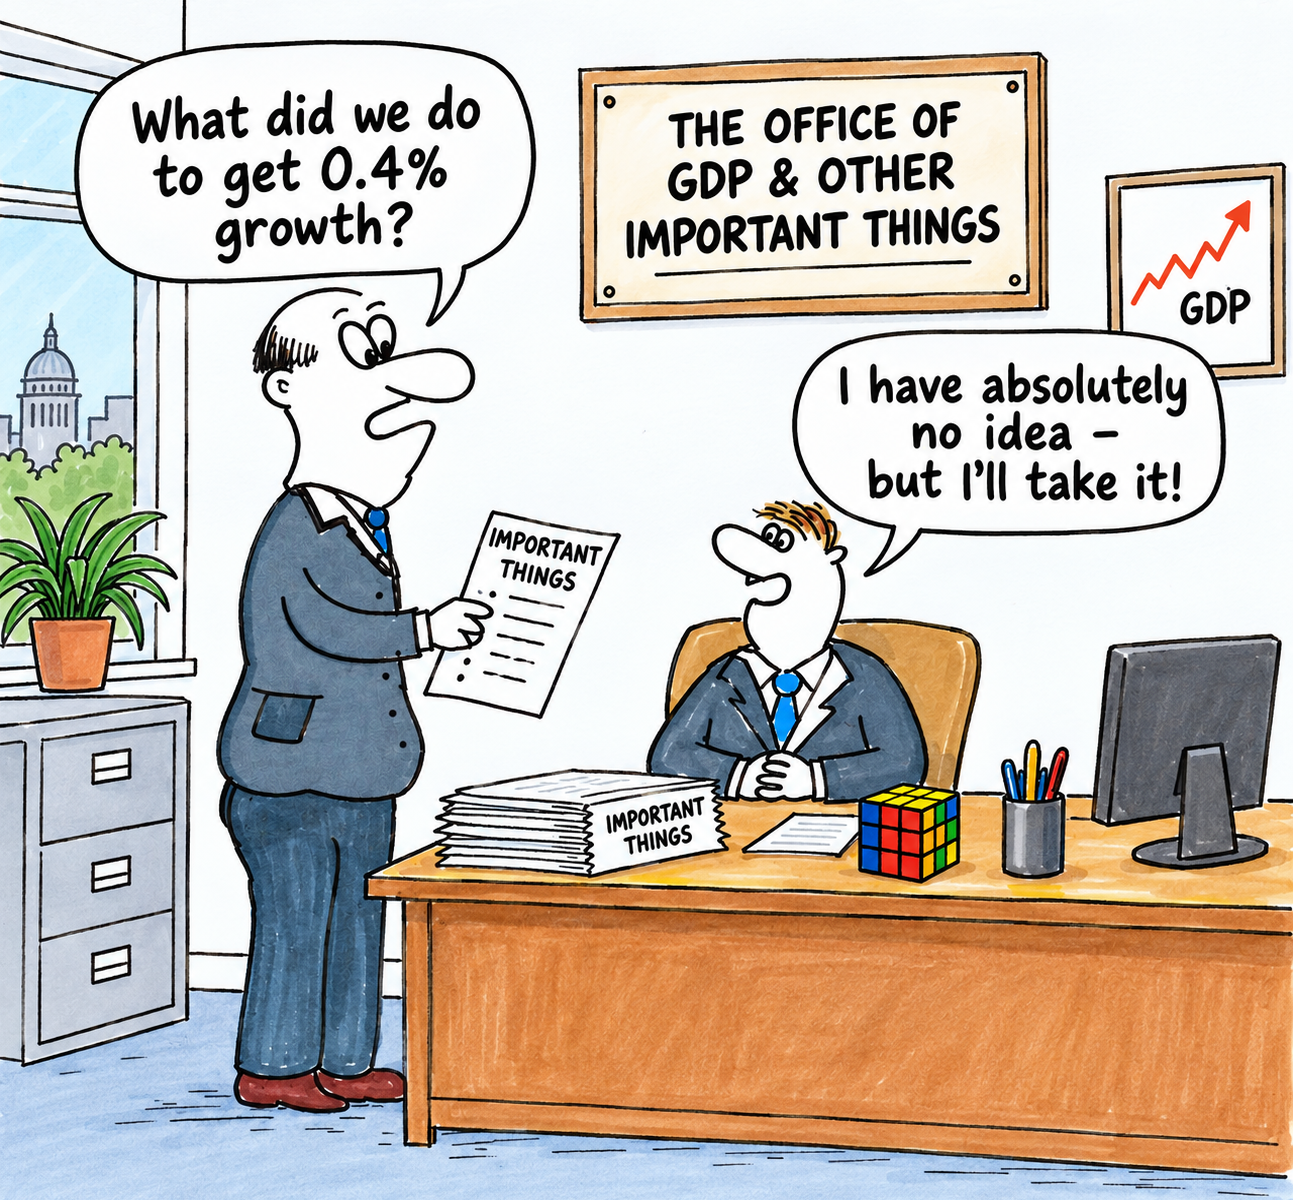
The UK economy delivered an unexpected boost in July, expanding by 0.4%, according to the latest figures from the Office for National Statistics (ONS).
Stronger than expected performance
The stronger-than-anticipated performance confounded economists, who had expected the economy to record no growth during the month.
The July 2026 figures follow growth of 0.3% in June and suggest that the economy carried some of its first-half momentum into the third quarter.
GDP was also 1.6% higher than a year earlier, marking the fastest annual growth rate since February 2025.
AI reportedly assisted growth
Services were the main engine of growth, expanding by 0.4%. Computer programming and consultancy were particularly strong, with the ONS highlighting evidence that businesses involved in artificial intelligence and cloud computing were helping to drive activity.
Manufacturing also performed well, while construction recorded a smaller increase.
Welcome
The figures provide some welcome relief for the government, although economists warn that the outlook remains uncertain.
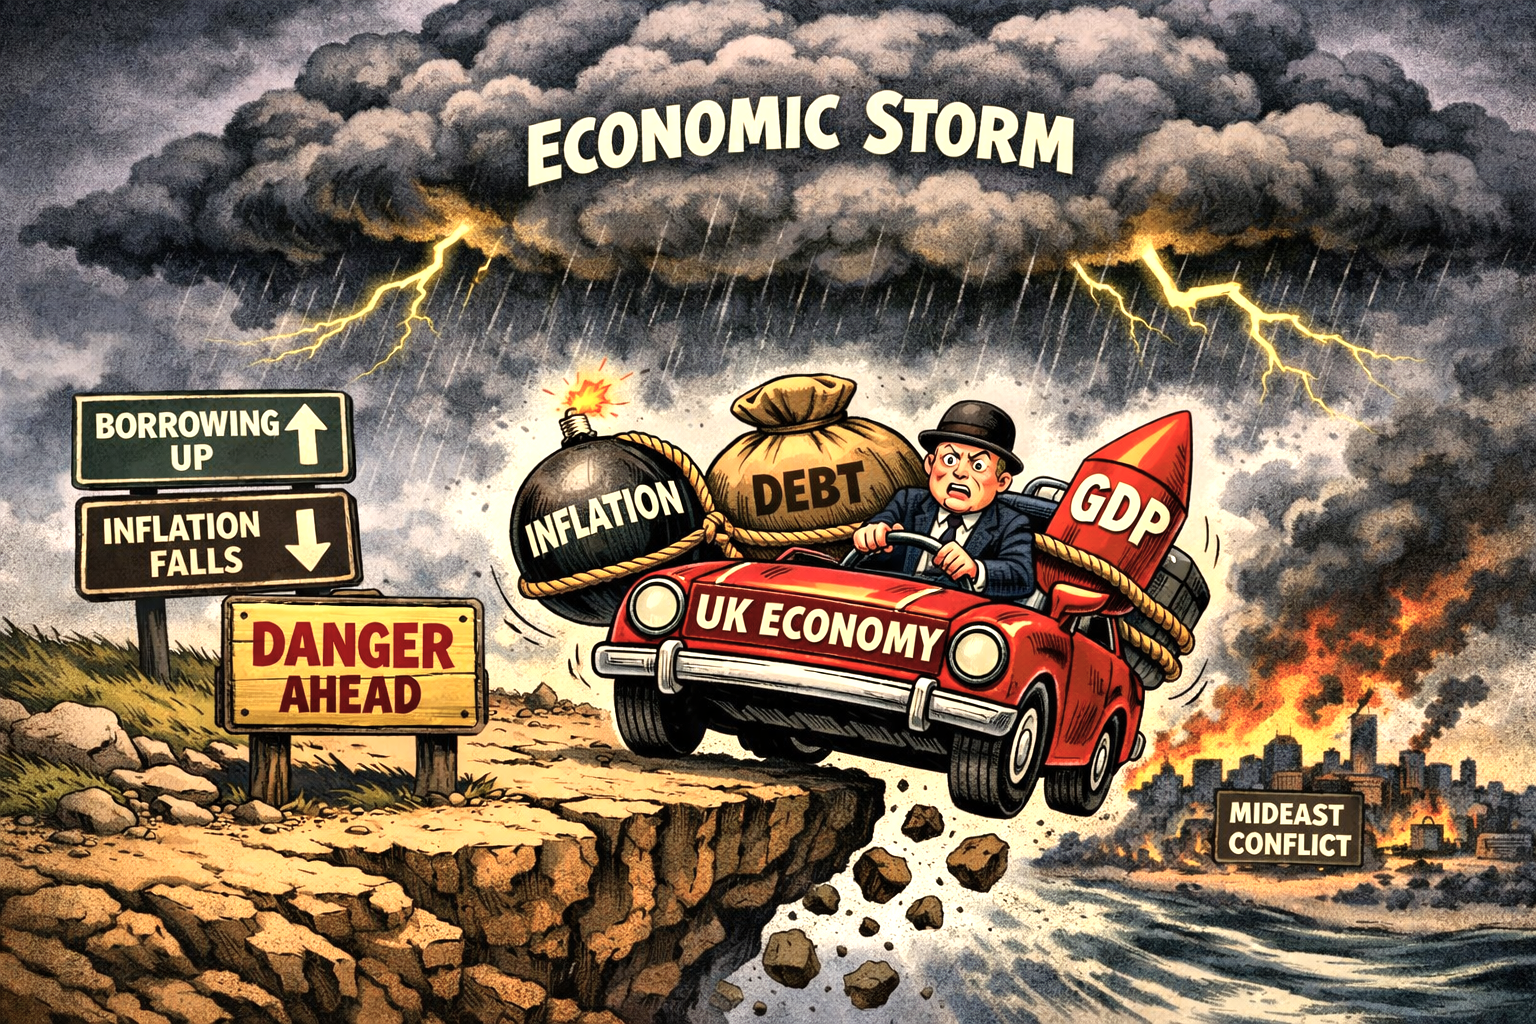
Rising energy prices, inflationary pressures and higher government borrowing costs could weigh on growth in the months ahead.
Nevertheless, July’s figures suggest the UK economy is proving more resilient than many had expected, providing a positive start to the second half of 2026.
America’s inflation problem is proving stubborn, with the latest figures increasing pressure on the Federal Reserve to raise interest rates again.
U.S. consumer prices rose 3.4% in August 2026 from a year earlier, unchanged from July, according to the latest U.S. Consumer Price Index figures.
Increase
Prices increased 0.4% during August 2026, a sharp acceleration from July’s 0.1% rise. Core inflation, which excludes volatile food and energy prices, rose 2.4% year-on-year and 0.3% during the month.
Higher petrol prices were a major contributor, with energy costs rebounding amid renewed geopolitical tensions.
Pressure
However, the persistence of underlying price pressures remains a concern for policymakers, particularly because U.S. inflation is still well above the Fed’s 2% target.
Attention now turns to the Federal Reserve’s September 15th–16th 2026 meeting. Financial markets have reacted strongly to the latest figures, with interest-rate futures putting the probability of a quarter-point rate increase at around 87% on September 16th 2026.
Decision
The Fed therefore faces a difficult decision. Higher rates could help contain inflation but would also increase borrowing costs for households and businesses.
For now, the latest data suggest that the battle against inflation is far from over, making a September rate increase increasingly likely.
On September 10th 2026, the European Central Bank (ECB) raised interest rates in an effort to stop a new wave of inflation from taking hold across the eurozone.
The ECB increased its key deposit rate by 0.25 percentage points to 2.5%, its second rate increase this year. The move comes as inflation has risen above 3%, well above the ECB’s 2% target.
Much of the renewed pressure is being blamed on higher energy prices, linked to the continuing conflict in the Middle East.
Energy costs
More expensive oil and gas can quickly feed through into transport, food and household bills, raising fears that inflation could prove more persistent than previously expected.
The problem for the ECB is that higher interest rates can also weaken economic growth. More expensive mortgages and business loans can discourage households from spending and companies from investing.
Challenge
Although the eurozone economy has shown some resilience, the outlook remains uncertain. The ECB expects inflation to average around 3% this year, while economic growth is expected to remain relatively weak.
The ECB now faces a difficult balancing act: raise rates enough to control inflation, but not so much that it pushes the economy into a deeper slowdown.
Investors are already likely wondering whether further increases could follow in the months ahead.
The Dutch central bank has made a striking move that says much about the changing geopolitical and financial landscape.
Between March and August 2026, De Nederlandsche Bank (DNB) reportedly moved around 86 tonnes of gold from the United States and Canada to London, describing the decision as part of its efforts to strengthen “crisis preparedness”.
The move does not mean the Netherlands has lost confidence in American or Canadian vaults. Rather, it is about accessibility, diversification and the possibility that the international system could become considerably less predictable.
London
Before the transfer, 31.3% of Dutch gold was held in New York and 19.7% in Ottawa. Those proportions have now fallen to 18.5% each, while London’s share has risen from 18.1% to 32.1%. Around 30.8% remains in the Netherlands.
Why London? Quite simply, liquidity. London is the world’s biggest centre for physical gold trading, meaning bullion stored there can be bought, sold, lent or mobilised rapidly if financial markets are disrupted.
DNB says gold held in New York and Ottawa cannot be utilised as quickly or directly during a crisis.
Strategy
There is also a broader strategic calculation. DNB has been examining geopolitical risks ranging from cyber attacks and disrupted supply chains to economic and physical warfare.
Gold, unlike government debt or bank deposits, carries no issuer’s credit risk and can act as a reserve asset when confidence in financial institutions is severely tested.
The timing is nevertheless significant. Relations between Europe and the U.S. have become more politically complicated, while concerns about the reliability of international alliances and financial infrastructure have increased.
Preparedness
DNB insists the move is about resilience rather than politics. But central banks rarely move tens of tonnes of bullion without careful thought.
The message is therefore subtle but important: in an increasingly uncertain world, central banks want their emergency assets not merely to be safe, but immediately usable. And increasingly, gold is becoming that asset.
Britain’s fiscal squeeze is becoming increasingly difficult to ignore. The yield on the UK’s 30-year gilt has climbed to 5.89% — its highest level since 1998 — while the 10-year yield has risen to around 5.25%.
The immediate trigger is largely global: higher oil prices, renewed inflation fears and a worldwide bond sell-off. But Britain has an additional problem: an already stretched public finances position.
Tax, borrow or austerity – the familiar story
The timing could hardly be worse. Higher gilt yields mean higher future borrowing costs and, importantly, higher projected debt-interest payments.
Current estimates suggest that the rise in yields could roughly halve the Chancellor’s fiscal headroom, from around £26bn to about £13.8bn.
That leaves the government with an increasingly familiar choice: raise taxes, restrain spending, borrow more — or accept another round of austerity.
Burgeoning welfare
Welfare is inevitably part of the debate. UK welfare spending is enormous, projected at around £353bn in 2026-27, although more than half goes towards pensioners and the State Pension rather than working-age benefits.
The working-age and health-related components are nevertheless growing rapidly, creating a genuine long-term fiscal challenge.
But blaming welfare alone would be misleading. Debt interest itself has become a major burden. Public-sector net debt was around 95% of GDP in mid-2026, while debt-interest costs have been among their highest levels for decades.
The circle of failure
This is the vicious circle facing Britain: slow growth limits tax revenues; high spending increases borrowing; higher borrowing costs increase debt interest; and higher interest costs leave less money for public services and investment.
So is austerity coming back? Perhaps it never really left. The difference now is that governments are attempting to squeeze an increasingly expensive state while simultaneously trying to protect living standards and stimulate growth.
The October 2026 Budget may therefore be less about political ambition and more about how much pain the bond market will allow Britain to avoid.
Servicing debt
Borrowing costs in the U.S., Japan and Europe have hit similar highs in recent days, reflecting investors’ concerns about inflation, state borrowing levels and spending levels by large tech companies on AI.
World debt is a growing problem too
To be fair, rising yields and higher debt levels are not just a UK problem. France has its share of the burden, Japan, the EU and the U.S. too.
Fresh U.S. inflation figures released on 26th August have delivered an unwelcome reminder that the battle against rising prices is far from over.
The Federal Reserve’s preferred measure, the Personal Consumption Expenditures (PCE) price index, rose 3.7% in July compared with a year earlier, unchanged from June 2026 and above economists’ 3.6% forecast.
Core PCE, which strips out volatile food and energy costs, also remained stubborn at 3.3%, while prices increased 0.2% during July.
Above target of 2%
The figures leave inflation well above the Fed’s 2% target and could complicate expectations for interest-rate cuts. Markets have even increased the possibility of another rate rise later this year.
There was some encouragement elsewhere: personal income increased 0.4% in July 2026, while real consumer spending was broadly flat.
For the Fed, however, the message is clear: inflation is proving sticky, and cutting rates too quickly could risk reigniting price pressures.
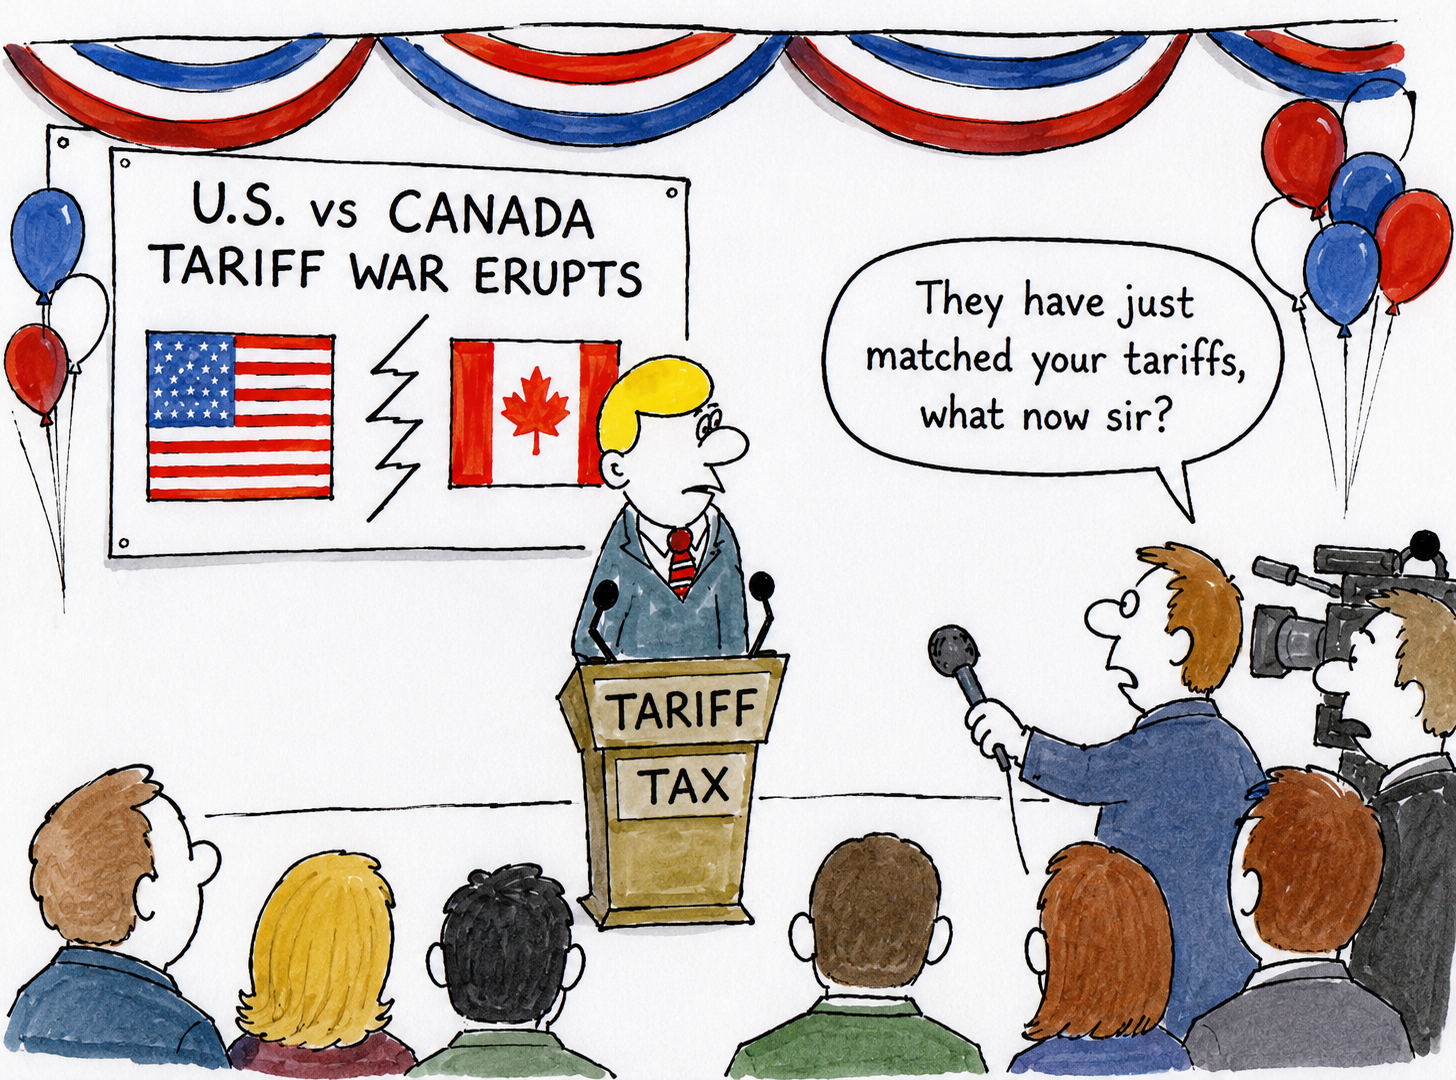
The United States and Canada have entered a new and potentially damaging phase of their long-running trade dispute, with both neighbours now imposing steep tariffs on each other’s goods.
Escalation
The latest escalation came after trade negotiations broke down. From 22nd August 2026, the United States imposed 50% tariffs on around $27.6 billion (£20.5bn) of Canadian goods, targeting products covered by new Section 338 measures.
The duties include major categories of Canadian exports, with steel, aluminium, vehicles, auto parts and other manufactured goods among those affected.
U.S. action
Washington argues that the measures are necessary to counter what it regards as discriminatory Canadian trade policies, particularly involving dairy, motor vehicles and U.S. alcoholic drinks.
The White House has also threatened further action, including a planned 50% tariff on Canadian cars and trucks from January 2027, adding another major risk for the integrated North American automotive industry.
Canada responds
Canada has now responded in kind. From 8th September 2026, Ottawa will impose retaliatory tariffs of 15%, 25% and 50% on approximately $27.6 billion of US imports, matching the American duties product for product.
The targeted goods include steel and aluminium, furniture, clothing, appliances, dairy products, fish and seafood, agricultural equipment, pulp and paper and electronics.
Significant
The significance of this confrontation extends far beyond the value of the tariffs themselves. The U.S. and Canada have one of the world’s largest trading relationships, with hundreds of billions of dollars in goods crossing their shared border every year.
Tariffs ultimately act like a tax on trade. Importers face higher costs, which can feed through to manufacturers, retailers and eventually consumers.
Trust?
Companies that have spent decades building highly integrated North American supply chains could also face disruption.
What began as a dispute over market access and trade policy is therefore becoming a much broader economic confrontation.
The big question now is whether Washington and Ottawa can return to negotiations before the tariff battle starts inflicting lasting damage on both economies.
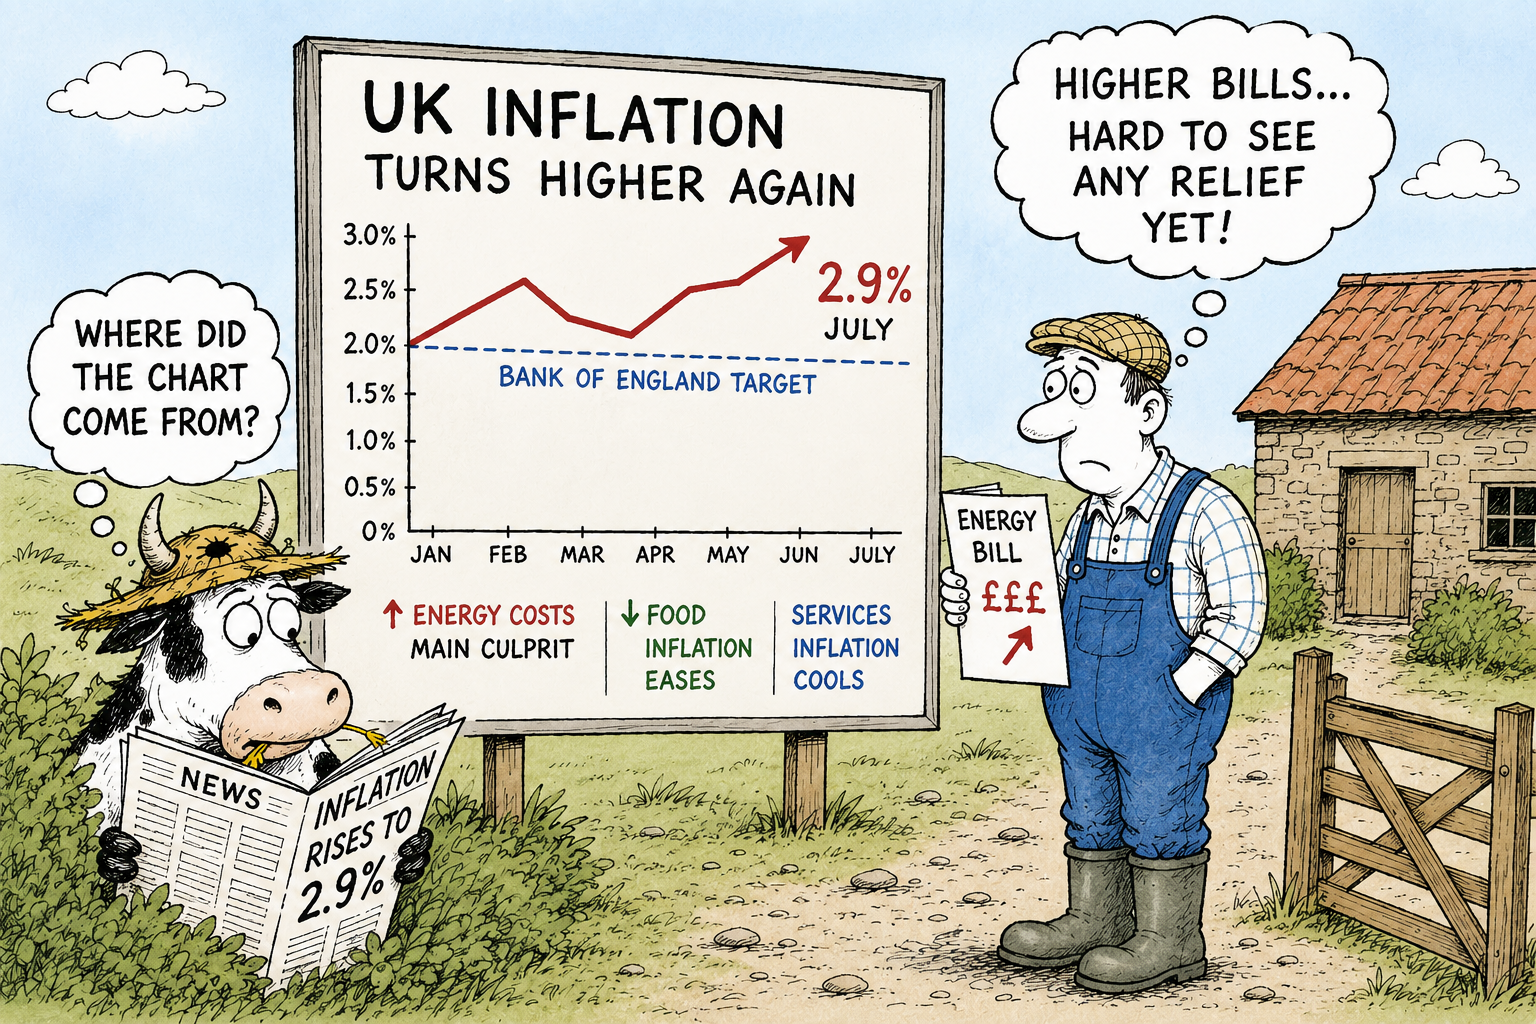
The UK’s inflation rate has moved higher again, providing an unwelcome reminder that the battle to bring prices under control is far from over.
Consumer price inflation rose to 2.9% in July 2026, up from 2.6% in June and moving further above the Bank of England’s 2% target.
The increase was largely driven by higher household energy costs following the latest rise in the energy price cap.
Not all negative
Gas prices increased sharply, putting renewed pressure on household budgets and pushing housing and household services inflation higher. For millions of families, the effect will be felt directly through larger energy bills.
However, the figures are not entirely negative. Food inflation eased to 1.3%, while services inflation fell from 3.6% to 3.4%. Core inflation, which strips out some of the more volatile components, remained at 2.6%.
Bank of England dilemma
That creates a difficult picture for the Bank of England. Inflation is moving in the wrong direction, but some of the underlying pressures are continuing to moderate.
The latest figures therefore make further interest-rate cuts more complicated. The Bank will want to avoid reigniting inflation, while also recognising that higher borrowing costs can weigh heavily on an already fragile economy.
For consumers, however, the message is simpler: the cost-of-living squeeze is easing, but it certainly isn’t over.
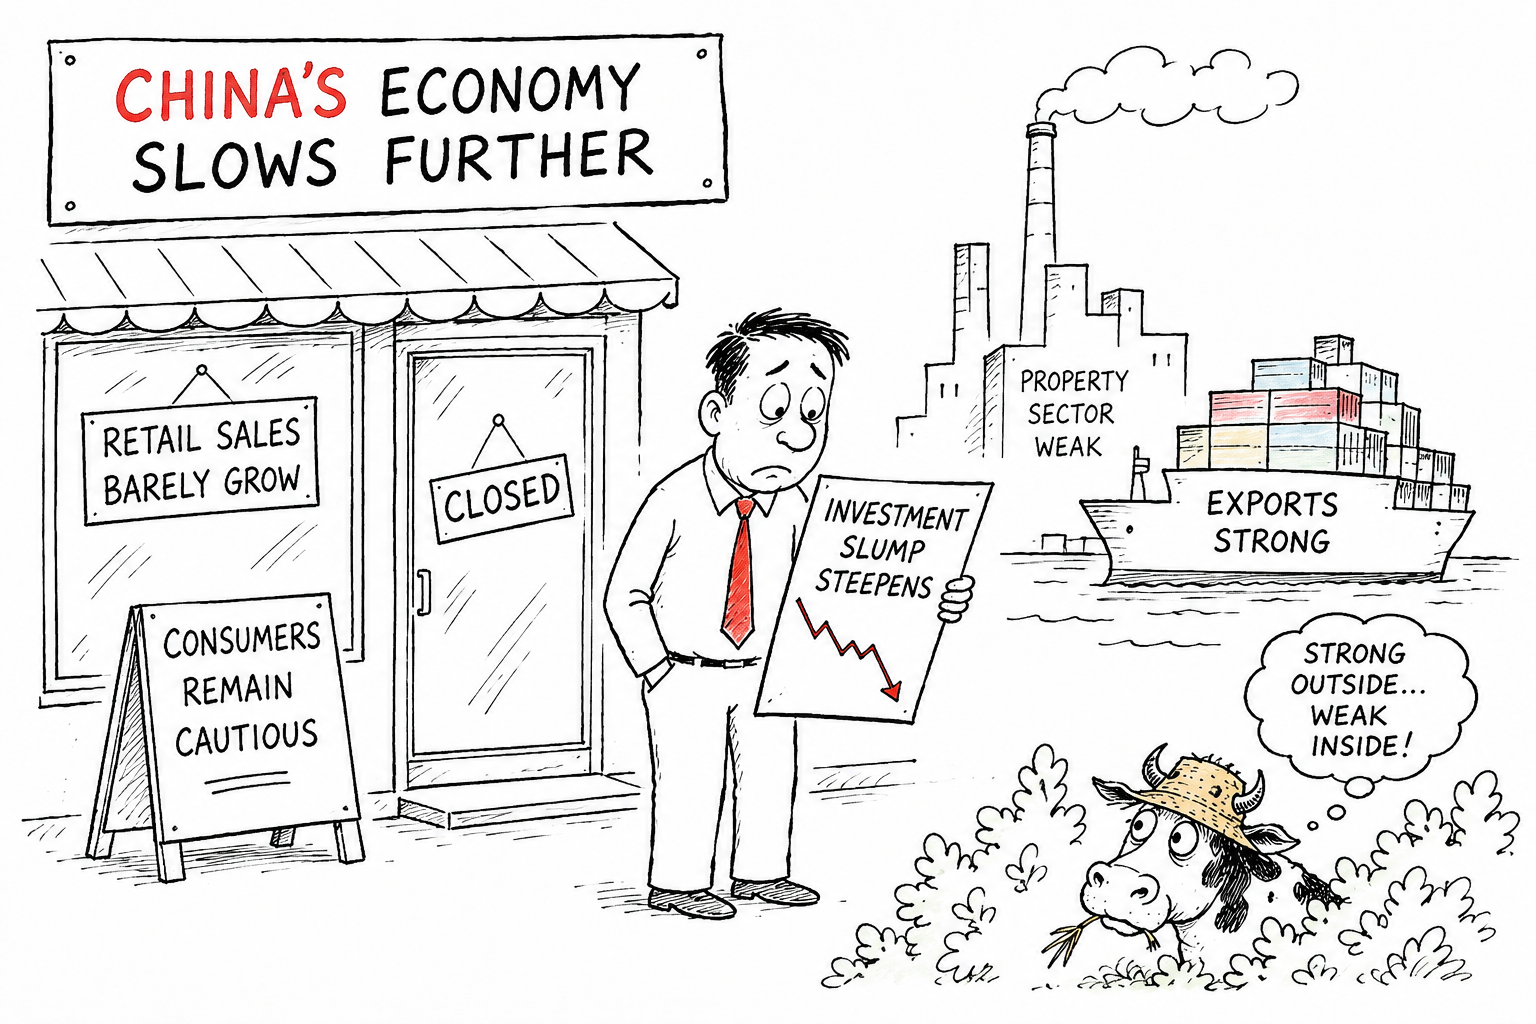
China’s economic recovery lost further momentum in July 2026, as weak consumer spending and a deepening investment slump highlighted the growing challenges facing the world’s second-largest economy.
Retail sales, a key measure of household demand, increased by just 0.6% year-on-year, slowing from 1% growth in June and falling well short of economists’ expectations of around 1.5%.
The figures suggest that Chinese consumers remain cautious despite government efforts to encourage spending.
Investment
Investment was an even greater concern. Fixed-asset investment fell 6.7% during the first seven months of 2026, compared with a 5.7% decline in the January-June period. The worsening figures underline the continuing weakness in property and other traditional areas of the economy.
Industrial production provided little comfort, growing 4.5% in July, down from 5.3% in June and below expectations.
Meanwhile, the property market remains under pressure, with new home prices broadly stagnant and property investment, sales and construction continuing to weaken.
AI tech a bright spot
China’s exports remain a notable bright spot, particularly in technology and AI-related manufacturing.
But the widening gap between strong external demand and weak domestic consumption is becoming increasingly difficult to ignore.
Beijing has promised measures to boost domestic demand and public spending, but the latest figures suggest that existing policies are struggling to generate sufficient momentum.
The message from July is increasingly clear: China can still manufacture and export its way forward but persuading its own consumers to spend and businesses to invest is proving much harder.
The UK economy expanded in the second quarter of 2026, although the pace of growth slowed, highlighting the fragile nature of the recovery.
According to the Office for National Statistics (ONS), real GDP increased by 0.4% between April and June 2026, following stronger growth of 0.6% in the first quarter.
The economy was 1.2% larger than a year earlier, while GDP per head rose 0.4% during the quarter and was 1.0% higher year-on-year.
Service growth
Services remained the main engine of growth, expanding by 0.5%, while construction grew by 0.3%. Production, however, recorded no growth, underlining the uneven nature of the recovery.
The monthly figures provide a mixed picture. GDP fell 0.1% in April 2026, was flat in May 2026 and then rose 0.3% in June 2026, suggesting some momentum returned towards the end of the quarter.
Trade deficit
However, businesses and policymakers face significant challenges. The ONS reports that the UK’s total goods and services trade deficit widened to £8.0 billion in Q2, while goods exports fell sharply in June 2026.
The figures therefore offer cautious encouragement rather than a decisive economic breakthrough.
With growth slowing and trade pressures persisting, the coming months will test whether the UK recovery can build sustainable momentum.
NB ONS figures are the first quarterly estimate and may be revised at a later date.
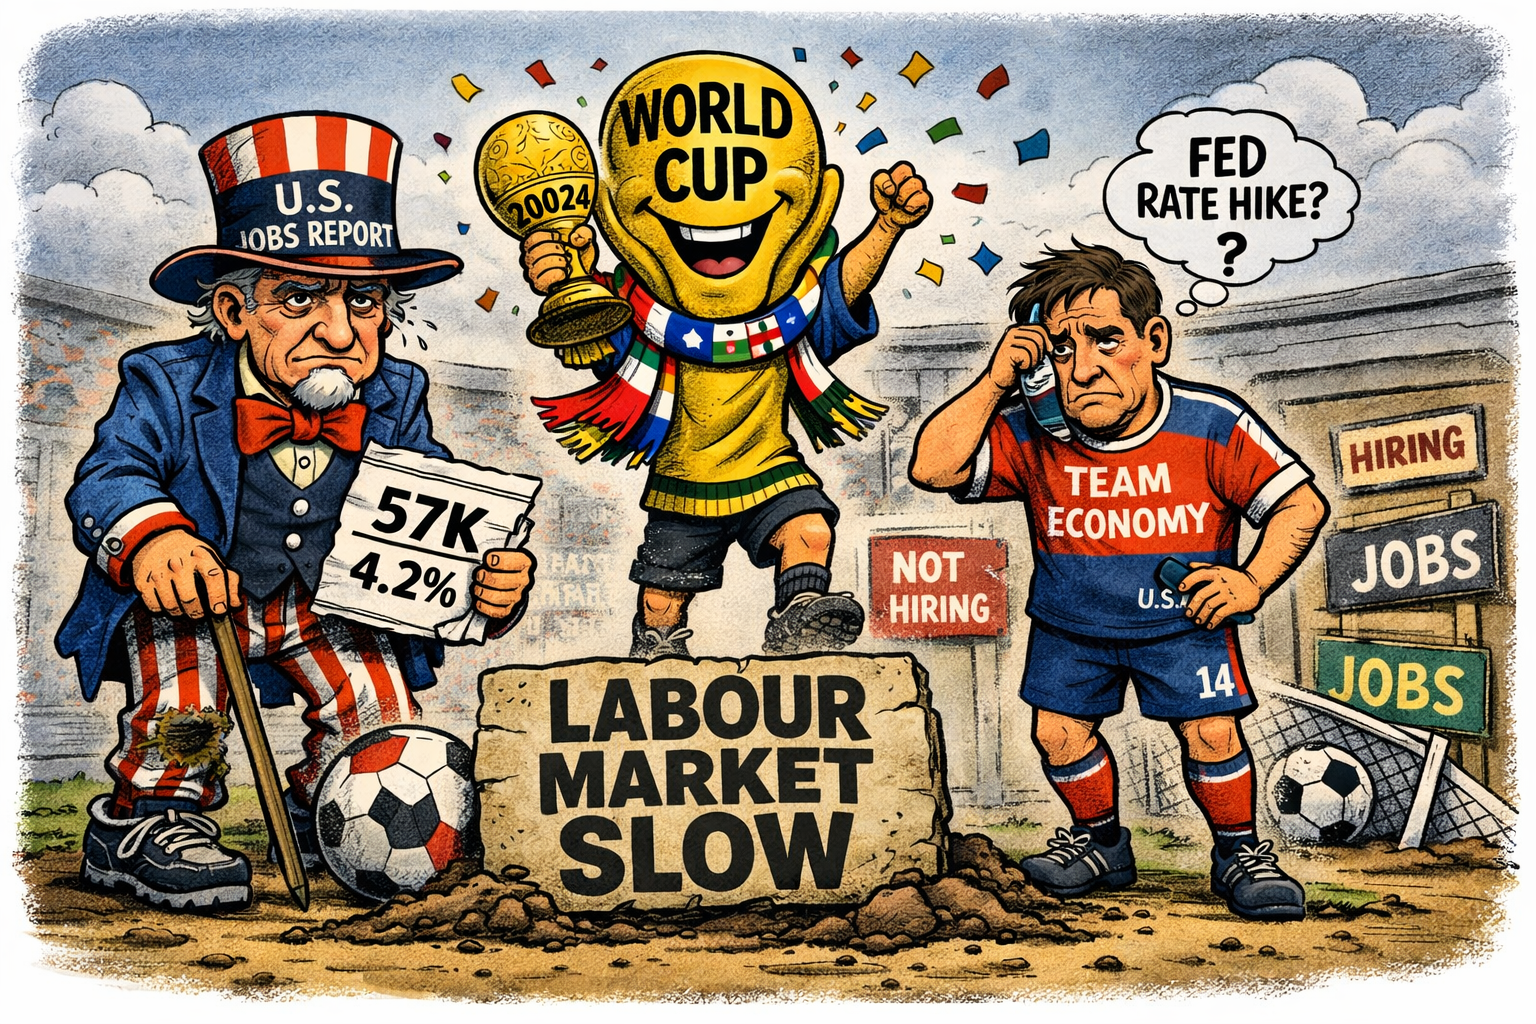
The latest U.S. jobs report underscored a clear cooling in labour market momentum, with June’s 2026 nonfarm payrolls rising by just 57,000, well below economists’ expectations and marking the weakest gain in four months.
And this despite an expected job boost as the U.S. hosts a highly successful record-breaking Football World Cup.
Although the headline unemployment rate dipped to 4.2%, this improvement was largely cosmetic: the labour force participation rate fell to 61.5%, its lowest level since March 2021, meaning fewer people were counted as actively seeking work.
Beneath the surface, the household survey painted a more troubling picture. Employment dropped sharply, with 507,000 fewer people reporting they were at work, and revisions to earlier months erased 74,000 previously reported jobs — undercutting the narrative of springtime strength.
Leisure and hospitality suffered a notable setback, shedding 61,000 positions, while gains were concentrated in a narrow band of sectors: professional and business services (+36,000), social assistance (+25,000), and healthcare (+22,000).
Financial markets reacted cautiously, with investors trimming expectations of a Federal Reserve rate rise in September 2026.
Overall, the data reportedly suggests a labour market losing steam, shaped more by statistical quirks and workforce exits than by genuine economic resilience.
United Kingdom – Latest Data This Week to June 19th 2026
Labour market:
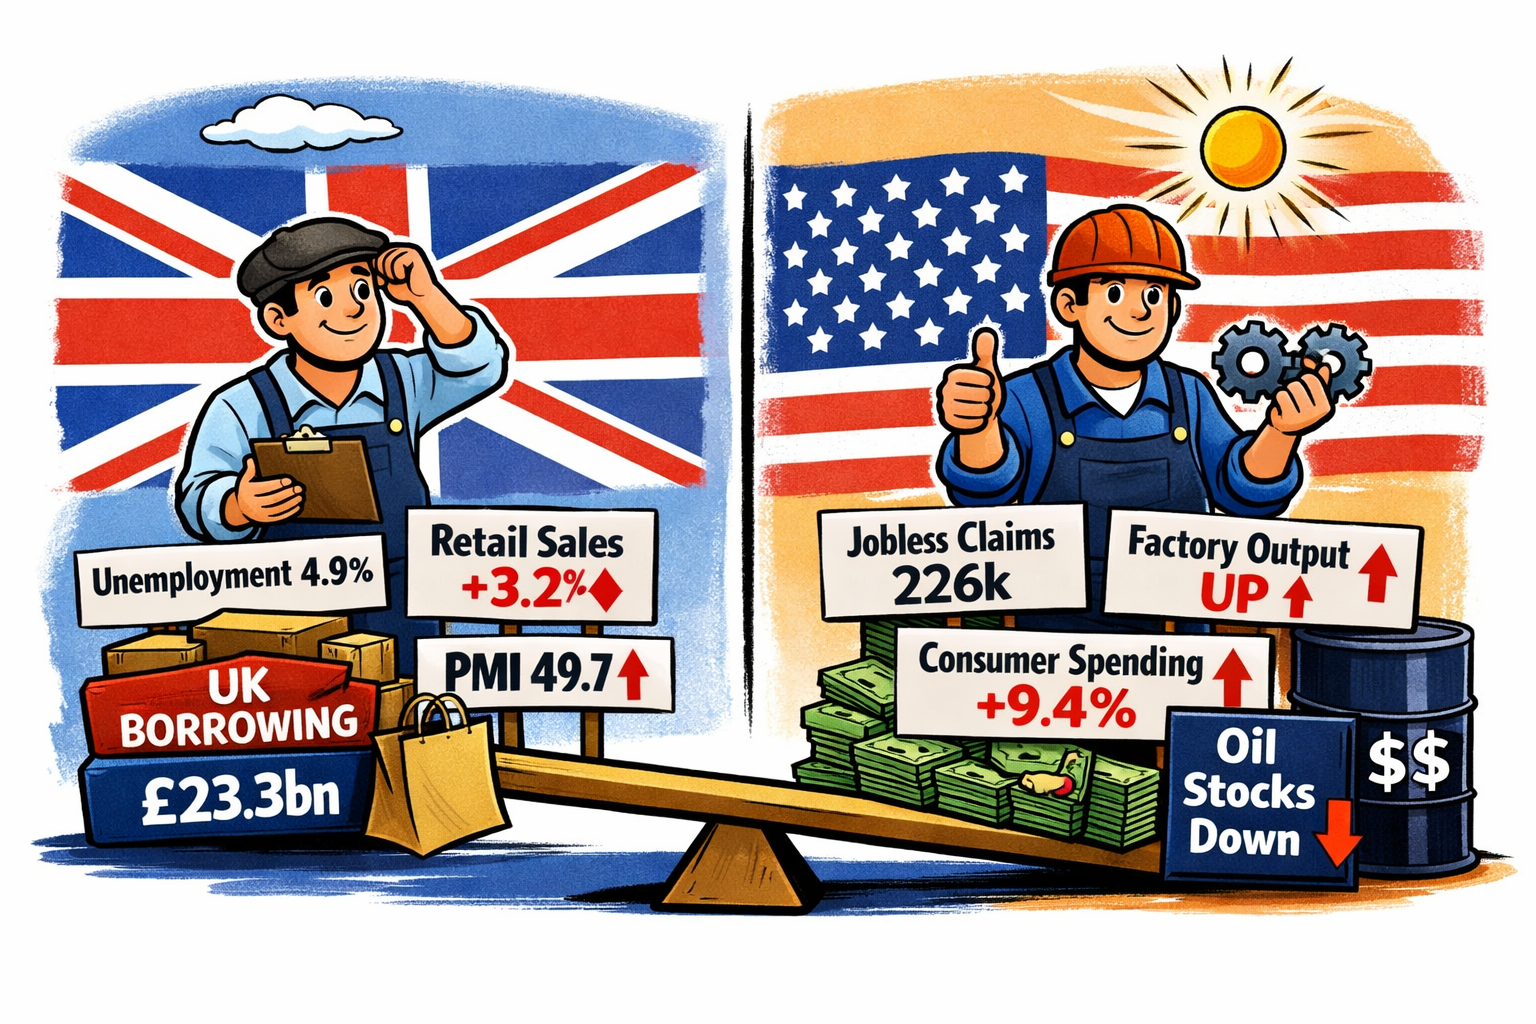
The UK unemployment rate for April 2026 held at 4.9%, slightly below the previous 5% reading. Average earnings including bonuses grew 4.4%, while earnings excluding bonuses rose 3.4%. Employment increased by 100,000 in April, although HMRC payrolls for May showed only a marginal +2,000 change.
Retail sales:
Retail sales rebounded strongly in May 2026, rising 1.2% month‑on‑month and 3.2% year‑on‑year, reversing April’s declines. Retail sales excluding fuel also rose 1.2% MoM and 4.6% YoY.
Public finances:
Public sector net borrowing (excluding banks) came in at £23.3bn in May, slightly worse than April’s revised figure.
Business activity:
Flash PMIs for June show mixed momentum:
Manufacturing PMI: 53.9 (expansion)
Services PMI: 49.3 (contraction)
Composite PMI: 49.7 (borderline contraction) These readings suggest the UK economy is losing some pace heading into summer.
United States – Latest Data This Week to 19th June 2026
Labour market:
Initial jobless claims for the week ending 13th June 2026 fell slightly to 226,000, broadly in line with expectations. Continuing claims rose to 1.81 million, indicating some softening in labour market conditions.
Manufacturing & business surveys:
The Philadelphia Fed Manufacturing Index jumped to 10.3 in June from –0.4, signalling a notable improvement in factory activity.
The S&P Global flash PMIs for June show:
Manufacturing: 55.1 (solid expansion)
Services: 50.7 (modest expansion)
Composite: 51.5 (steady growth) These point to a resilient US private‑sector backdrop.
Housing & consumer indicators:
Mortgage rates eased slightly, with the 30‑year rate dipping to 6.47%.
Redbook retail sales rose 9.4% YoY, suggesting firm consumer spending.
Capital flows & energy:
Net long‑term TIC flows for April registered $103.1bn, indicating strong foreign demand for US assets.
API data showed a sharp –8.33 million barrel draw in crude oil stocks, hinting at tighter near‑term supply.
Overall Pictures for UK and U.S.
UK: A mixed week — labour market steady but softening at the margins; retail sales surprisingly strong; PMIs signalling a mild loss of momentum; public borrowing still elevated.
US: Data broadly stronger — manufacturing rebounded, services steady, jobless claims stable, and consumer spending indicators show firm.
China’s economy showed fresh signs of strain in May 2026, with retail sales slipping for the first time this year and exposing the fragility of the country’s consumer‑led recovery.
The latest figures point to households becoming more cautious as job insecurity, weak income growth and a still‑ailing property sector weigh on confidence.
Retail sales — a key gauge of consumer demand — fell compared with a year earlier, reversing April’s modest rise.
Troubling?
Analysts note that the decline is particularly troubling because it comes despite a raft of local government incentives aimed at boosting spending on cars, appliances and electronics. Instead, households appear to be prioritising savings over discretionary purchases.
Industrial production continued to expand, but at a slower pace than earlier in the spring, suggesting that the export‑heavy manufacturing sector is also losing some momentum.
With global demand softening and geopolitical tensions disrupting supply chains, factories are finding it harder to sustain the strong output seen earlier in the year.
Weakness
The weakness in May 2026 adds pressure on Beijing to consider more forceful support measures. While policymakers have so far resisted large‑scale stimulus, the combination of faltering consumption and a deep property downturn is making the recovery increasingly uneven.
For now, the data underline a simple reality: China’s rebound remains fragile, and confidence is still in short supply.
The European Central Bank jolted markets yesterday with its first interest‑rate increase since 2023, a move driven by renewed energy‑price pressures linked to the U.S./Iran conflict.
Policymakers signalled that the surge in wholesale gas and oil costs is feeding back into euro‑area inflation, forcing a return to tightening after more than two years of stability.
Investors had expected a cautious stance, but the ECB argued that delaying action risked inflation becoming embedded again, particularly in energy‑sensitive economies such as Germany and Italy.
The decision pushed bond yields higher across the bloc and strengthened the euro, reflecting expectations of a more hawkish path through the summer.
UK Lacklustre Growth
In the UK, fresh GDP data released by the ONS for April 2026 offered a more mixed picture. The economy expanded modestly, continuing the fragile recovery seen earlier in the year, but underlying momentum remains weak.
Services provided the bulk of the growth, while manufacturing and construction were broadly flat.
Economists warn that higher energy prices — the same shock driving the ECB’s decision — could weigh on UK output in the coming months, squeezing household budgets and raising costs for businesses.
Together, the ECB’s shift and the UK’s tentative growth figures underline how vulnerable Europe remains to global energy disruptions.
The UK’s latest run of economic data has delivered a contradictory picture: inflation easing sharply, borrowing surging, and growth outperforming expectations.
Together, the figures show an economy stabilising in some areas while coming under renewed strain in others.
Inflation (CPI)
April CPI fell to 2.8%, down from 3.3% in March, the lowest rate in nearly three years.
The drop was driven by Ofgem’s April energy price cap, which cut household gas and electricity bills, alongside softer rises in water charges, road tax and several food categories.
But economists warn the relief will be temporary. Wholesale energy prices have risen sharply since the U.S. / Iran conflict escalated, and inflation is expected to climb back above 4% later in the year.
The Bank of England is therefore likely to remain cautious about cutting rates.
Forecast out of sync
Government Borrowing (April 2026) The borrowing picture was far less encouraging. The government borrowed £24.3 billion in April — the highest April figure since 2020 and well above the £20.9 billion forecast by the OBR.
Borrowing was £4.9 billion higher than the same month last year, driven by inflation‑linked increases in benefits, the earnings‑linked rise in the state pension, and record April debt‑interest payments of £10.3 billion in 2026.
Analysts note that this deterioration comes before the full impact of the energy‑price shock is felt, raising concerns about the fiscal outlook for the rest of the year.
Growth
GDP Growth The bright spot came from growth: the economy expanded 0.3% in March 2026, beating expectations of a slight contraction, and delivered 0.6% growth for Q1 — the fastest among G7 countries reporting so far.
However, the ONS highlights that much of March’s strength reflected “front‑loading” of spending ahead of expected price rises linked to the Iran war, suggesting momentum may fade as higher energy and fuel costs feed through.
This data comes as the global economy waits for the full impact of the U.S. / Iran conflict to unravel.
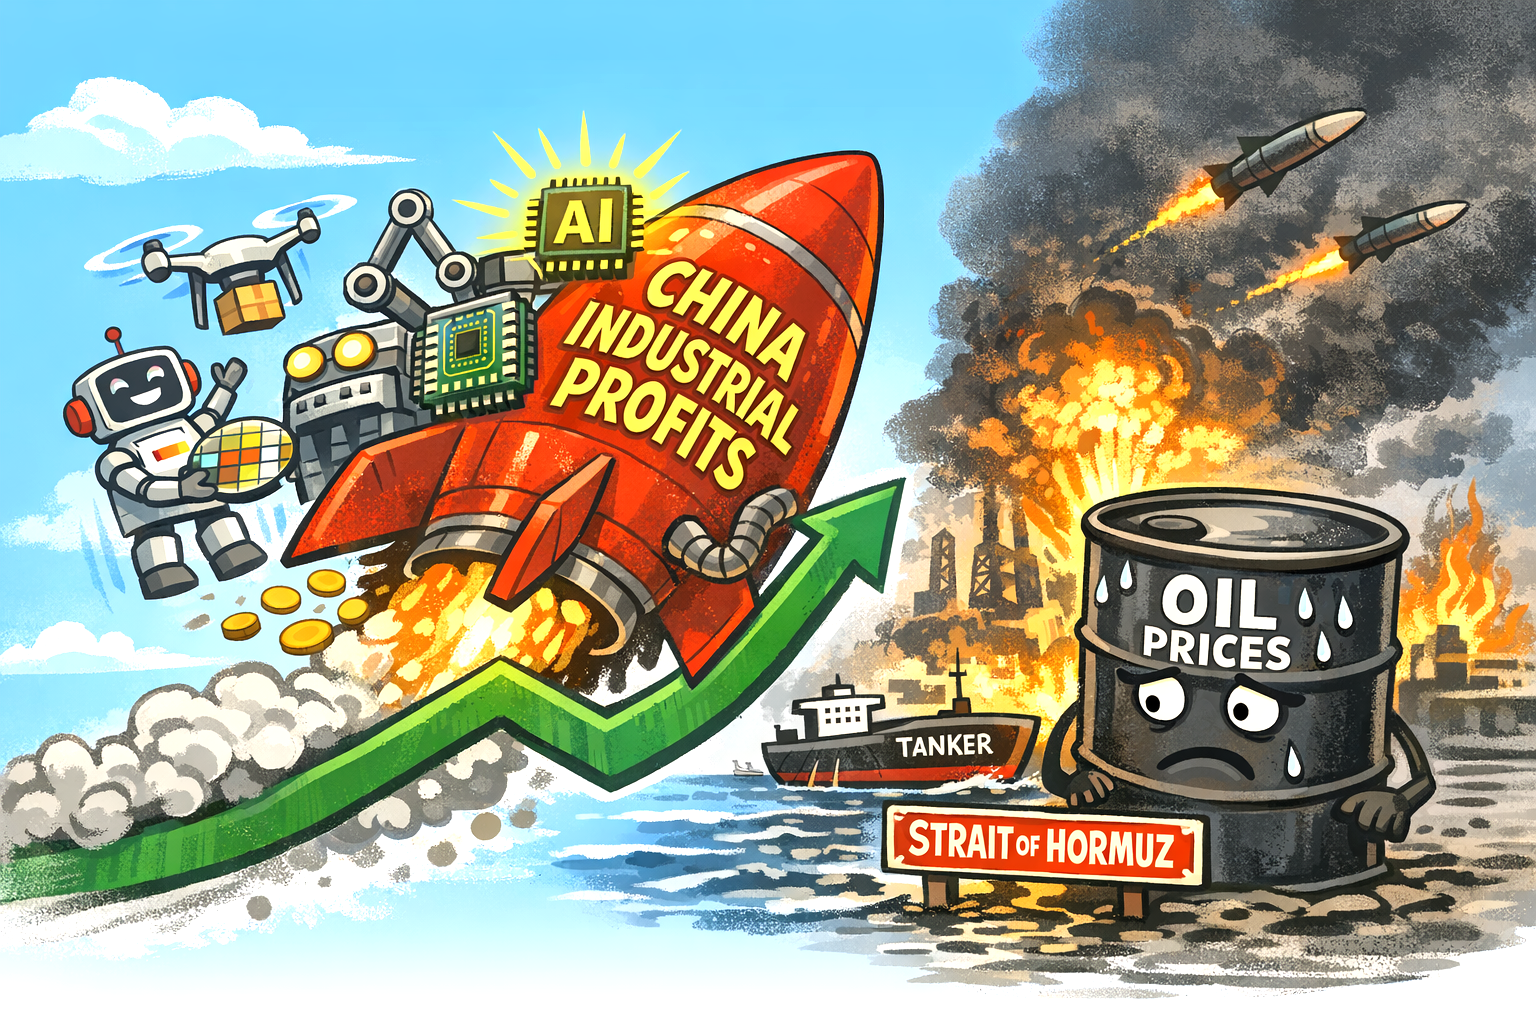
China’s industrial sector delivered its strongest performance in more than half a decade in March 2026, with profits jumping 15.8% year‑on‑year, signalling a decisive shift in the country’s growth engine towards advanced manufacturing and AI‑related hardware.
The latest figures from the National Bureau of Statistics show first‑quarter profits rising 15.5%, marking the best opening to a year since 2017 outside the pandemic distortions.
The surge is highly concentrated. Traditional heavy industry remains subdued, but China’s high‑tech and equipment manufacturers are now carrying the industrial economy.
Tech manufacturing
Profits in high‑tech manufacturing soared 47.4%, while equipment makers posted a 21% rise. Beneath those aggregates lie extraordinary gains: optical fibre producers saw profits climb more than 300%, with optoelectronics and display‑device manufacturers also recording double‑digit increases.
These sectors sit at the heart of China’s AI infrastructure build‑out, from data‑centre components to semiconductor‑adjacent hardware.
Demand for “intelligent products” is also reshaping the landscape. Drone manufacturers reported profit growth above 50%, reflecting both civilian and dual‑use demand as China accelerates its push into autonomous systems and robotics.
This momentum comes despite a sharp rise in global oil prices following renewed tensions in the Middle East. Brent crude briefly topped $108 a barrel, raising concerns about margin pressure.
Partially insulated
Yet China appears partially insulated: a coal‑heavy energy mix, access to discounted Iranian crude and sizeable onshore inventories have softened the immediate impact.
Even so, analysts warn that a prolonged oil shock, tighter sanctions enforcement or disruption around the Strait of Hormuz could still weigh on costs later in the year.
China’s industrial profits are no longer being driven by property‑linked sectors or commodity cycles, but by the country’s accelerating investment in chips, AI hardware and advanced manufacturing — a structural shift that is beginning to reshape the contours of its economic recovery.
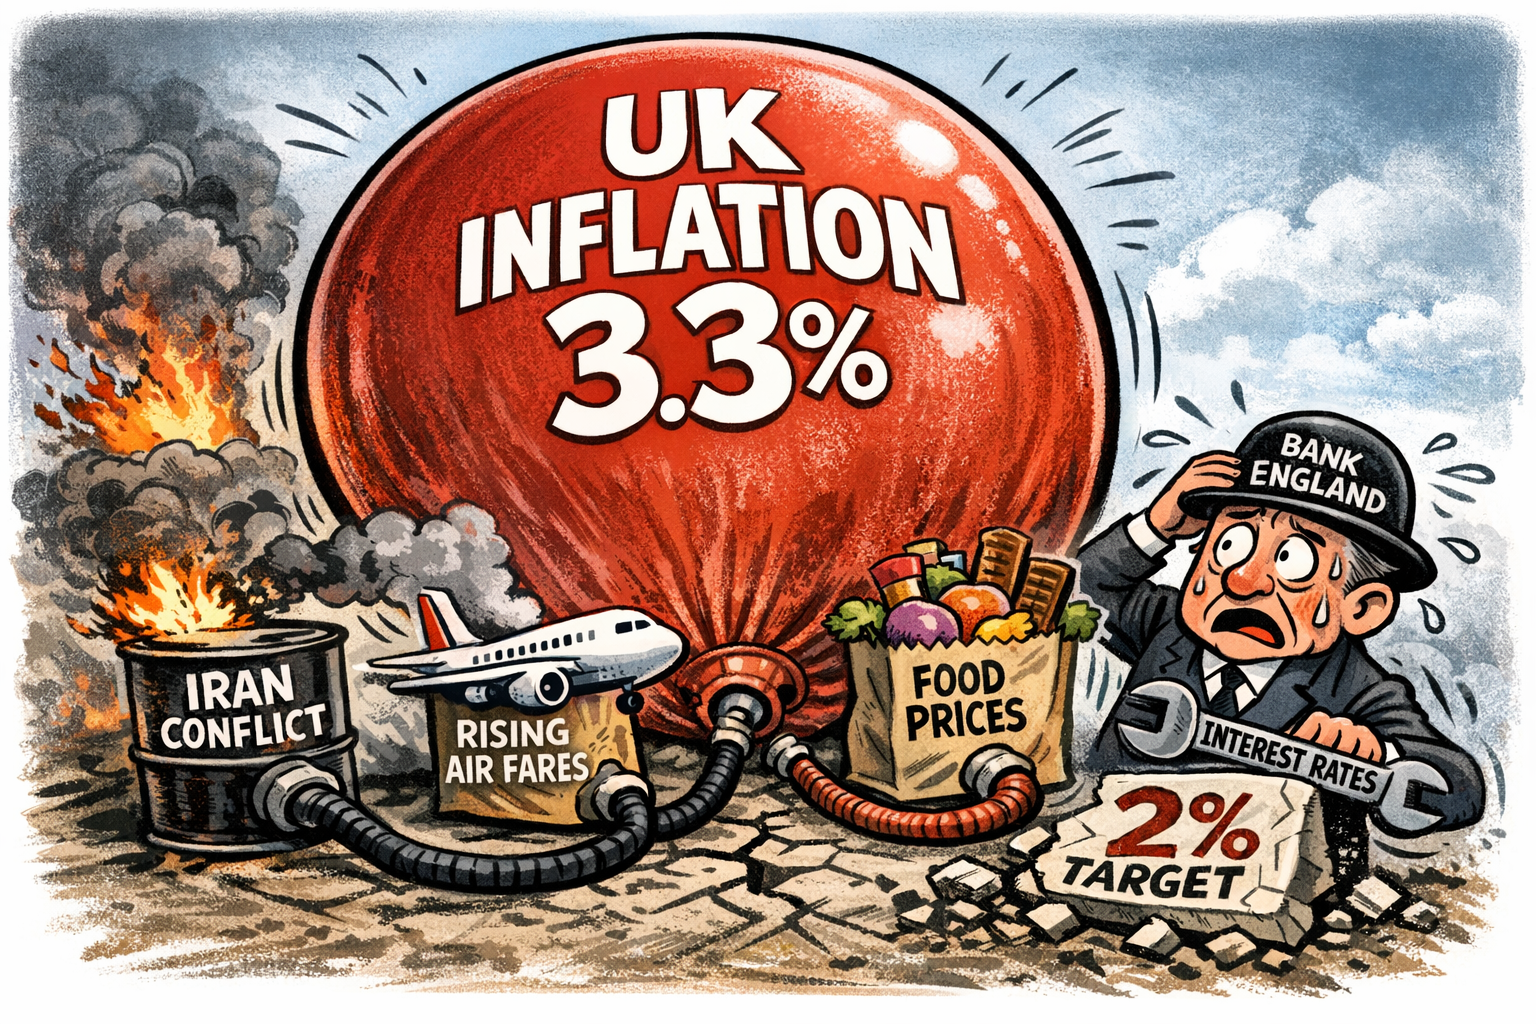
UK inflation jumped to 3.3% in March 2026, driven primarily by a sharp surge in fuel prices linked to the Iran conflict.
UK inflation accelerated to 3.3% in March 2026, up from 3% in February 2026, marking the first clear evidence of the Iran‑U.S. conflict feeding through to consumer prices.
Fuel costs
Official ONS data shows that motor fuel costs were the dominant driver, with petrol and diesel prices rising at their fastest pace in more than three years as global energy markets reacted to the disruption in the Strait of Hormuz.
Air fares
Air fares also rose sharply, partly due to the early Easter holidays, while food inflation picked up again, including notable increases in sweets and chocolate.
Clothing discounted
Clothing provided the only meaningful offset, with retailers discounting more heavily than last year.
The rise pushes inflation further from the Bank of England’s 2% target and complicates the policy outlook.
While economists expect UK inflation to ease slightly in April 2026, the broader risk is that sustained energy pressures could keep price growth elevated for longer.
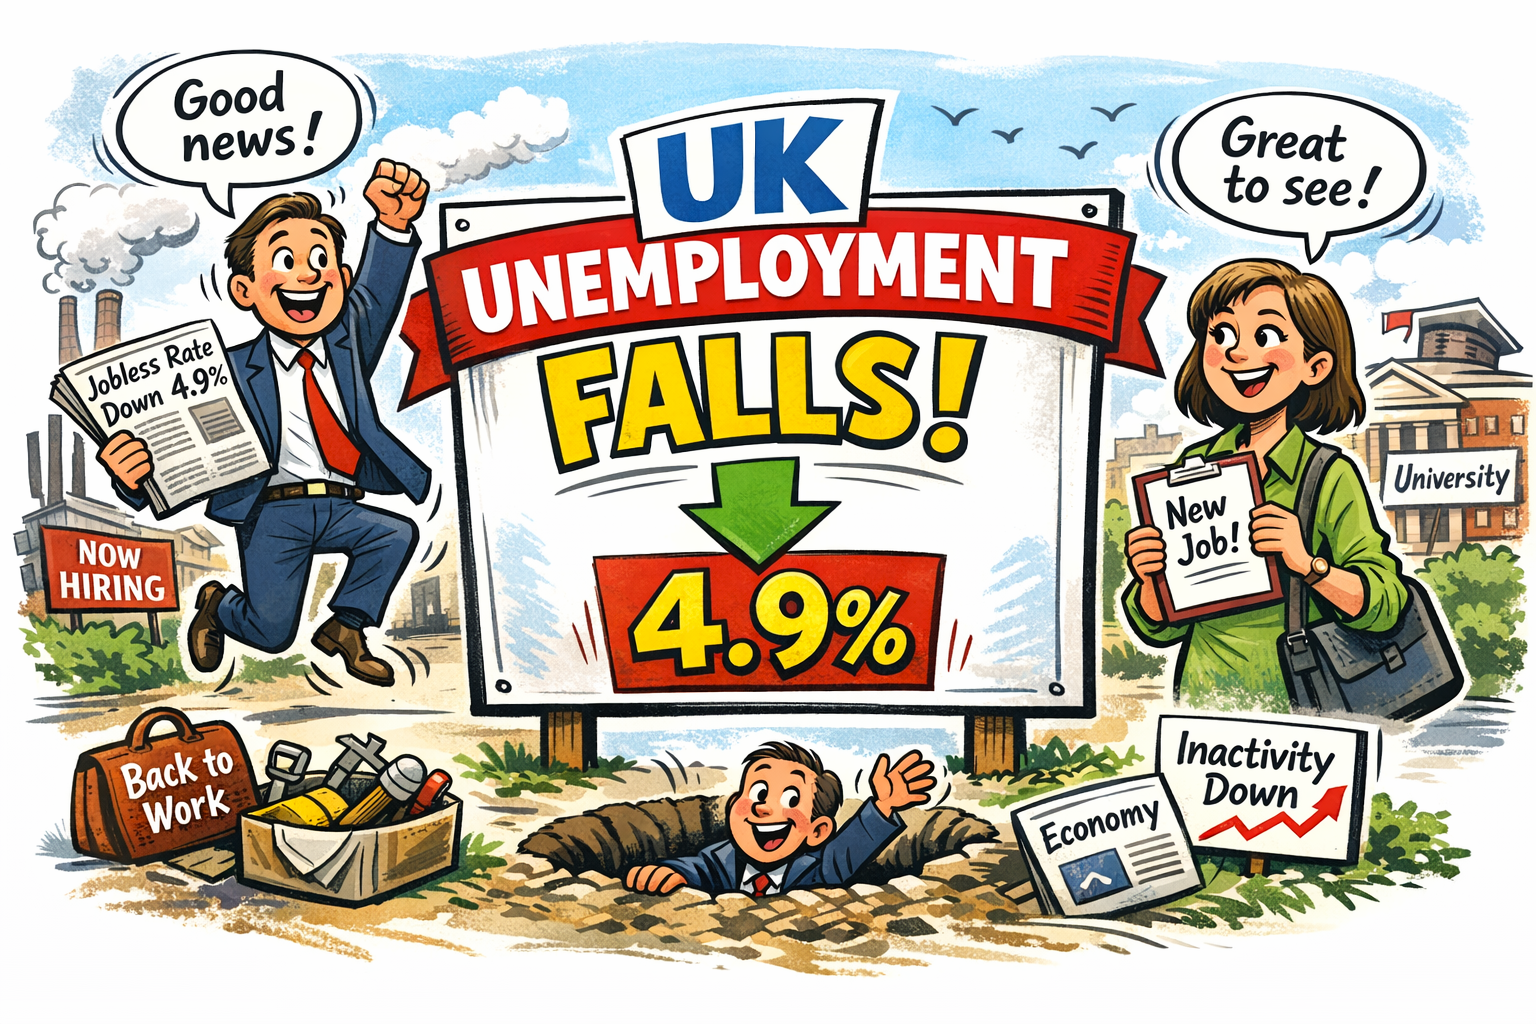
The UK unemployment rate has fallen to 4.9%, according to the latest figures from the Office for National Statistics (ONS), offering a rare moment of optimism in an otherwise unsettled economic landscape.
The data, covering the period from December 2025 to February 2026, shows a drop from 5.2% in the previous rolling quarter, marking the lowest level since mid‑2025.
Steady
Economists had broadly expected the rate to hold steady, making the improvement a mild but welcome surprise. The fall reflects a combination of rising employment in several service‑sector industries and a shift in the composition of the labour force.
Part of the decline, however, stems from an increase in economic inactivity, particularly among students and those temporarily stepping away from the workforce.
This means the headline figure flatters the underlying picture slightly, even if the direction of travel remains encouraging.
Easing wag growth
Wage growth continues to ease, and vacancies remain well below their post‑pandemic peak, suggesting the labour market is still cooling overall.
Yet the drop in unemployment provides the government with a positive data point to cling to at a time when households are grappling with high living costs and businesses are navigating weak demand.
For now, the labour market appears to be stabilising rather than sliding.
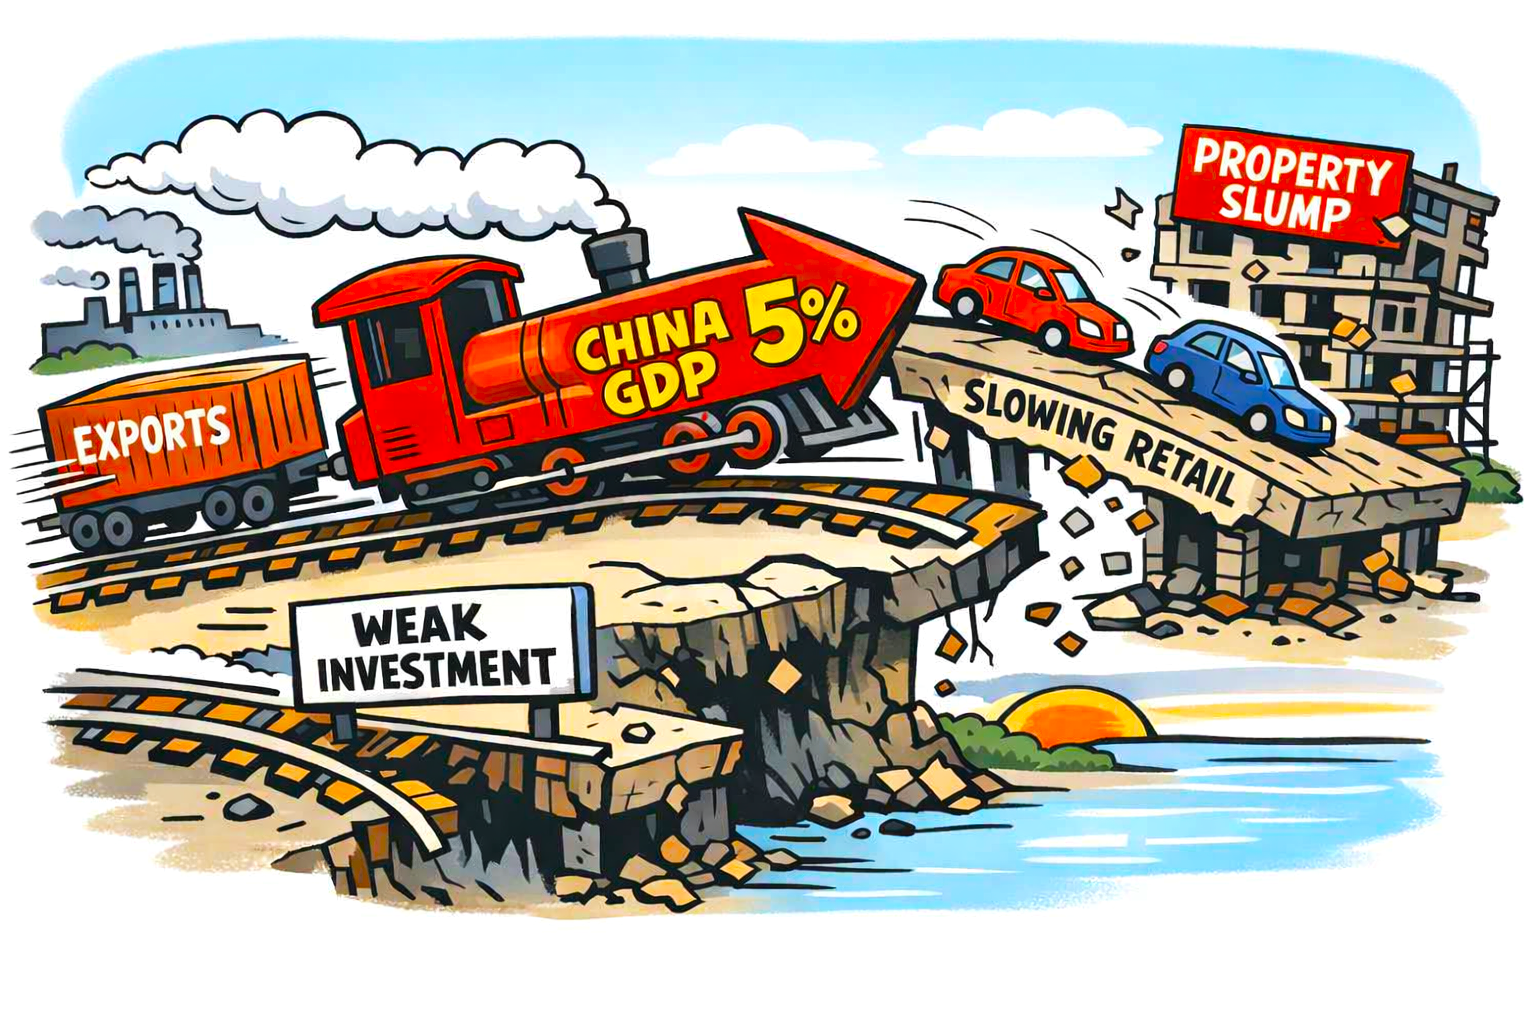
China’s latest GDP figures show the economy expanding by 5% in the first quarter, a rare upside surprise at a time when global demand is wobbling and domestic confidence remains brittle.
The number beats expectations and marks an acceleration from the previous quarter’s 4.5% pace, but the underlying picture is far less tidy.
Export strength
The headline strength came overwhelmingly from exports, which surged early in the quarter before losing steam as the Iran‑related energy shock pushed up logistics and input costs.
Manufacturing output rose a solid 5.7%, underscoring how China continues to lean on its industrial engine while household spending lags behind.
That imbalance is becoming harder to ignore. Retail sales grew just 1.7% in March 2026, a sharp slowdown from February’s holiday‑boosted reading.
Slower consumerism
Big‑ticket purchases, particularly cars, weakened as oil‑price volatility filtered through to consumer sentiment. Even with government subsidies nudging upgrades in electronics and jewellery, the broader consumer recovery remains hesitant.
Investment data tells a similar story. Fixed‑asset investment rose only 1.7%, dragged down by another steep contraction in the property sector, where developers are still struggling to stabilise balance sheets and complete stalled projects. Real estate investment is now down more than 11% year‑to‑date.
Stronger than expected growth
China will welcome the stronger‑than‑expected growth print, but it does not resolve the structural pressures building beneath the surface.
With the Middle East conflict threatening global trade flows and energy prices, China’s export‑led momentum looks vulnerable.
Policymakers may not rush to deploy large‑scale stimulus, yet the economy’s reliance on external demand leaves it exposed to shocks it cannot control.
The 5% figure is impressive on paper but the foundation beneath it is far less secure.
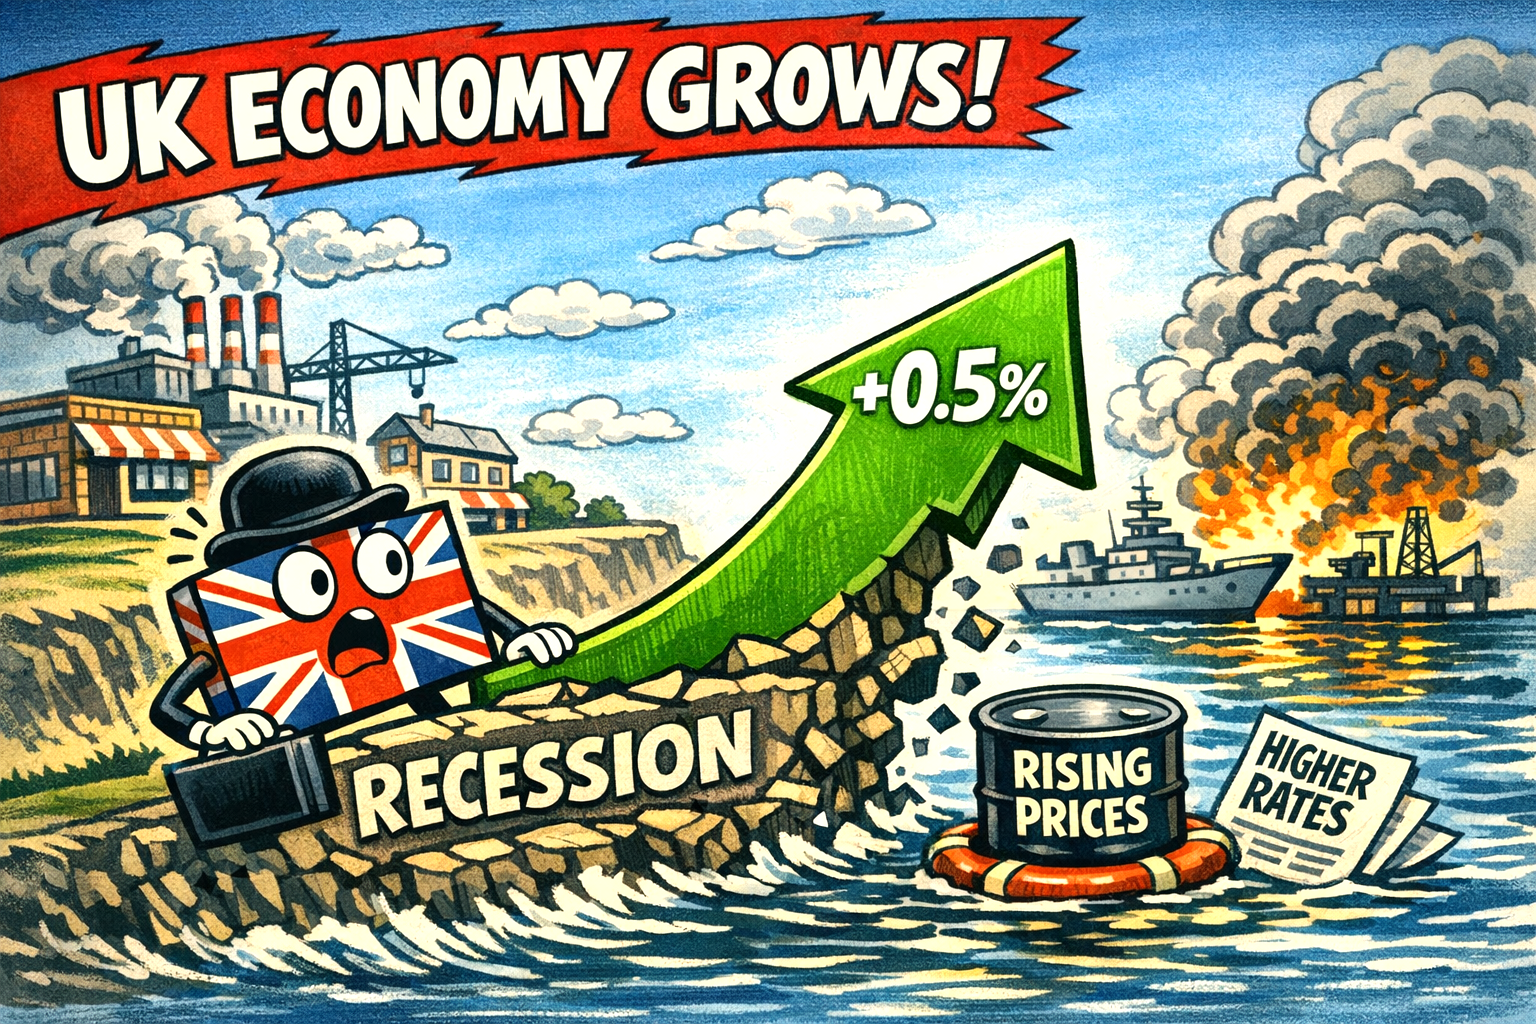
The ONS’s February 2026 figures delivered a rare upside surprise: UK GDP rose 0.5% month‑on‑month, the strongest expansion in more than two years and five times the consensus forecast of 0.1%.
How can forecasts be so wrong?
January2026 was also revised up to 0.1%, overturning the earlier flat reading. On the surface, this looks like the economy finally pulling out of its shallow recession.
In reality, it is a snapshot of momentum that has already been overtaken by events.
Services mani
The growth was broad‑based. Services, which make up over three‑quarters of the economy, expanded 0.5%, marking a fourth consecutive monthly rise.
Production also grew 0.5%, and construction jumped 1.0%. Even the three‑month measure—less noisy than monthly data—showed UK GDP up 0.5%, compared with 0.3% previously. This is the kind of balanced improvement policymakers have been waiting for.
But the timing matters. These numbers capture the economy before the U.S.-Israel-Iran conflict triggered a fresh energy shock at the end of February.
IMF downgrade
Since then, petrol, diesel and heating oil prices have surged, mortgage rates have ticked higher as markets price out rate cuts, and the IMF has downgraded the UK’s 2026 growth outlook to 0.8%.
So February’s strength is real—but it is also backward‑looking. The challenge now is whether any of that momentum survives the shock hitting households and firms this spring.
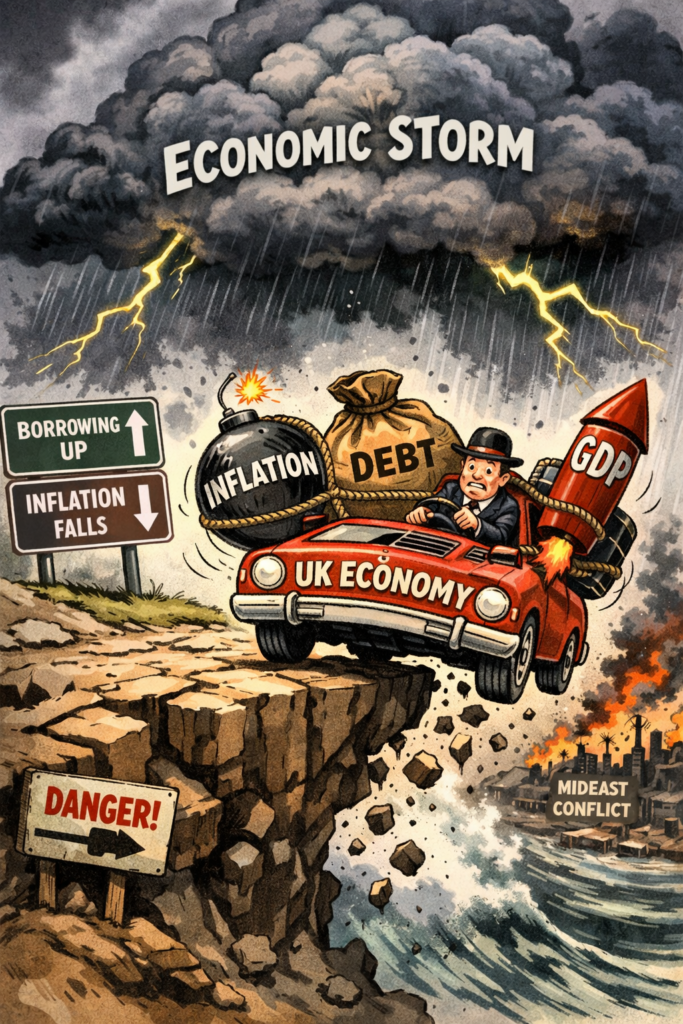
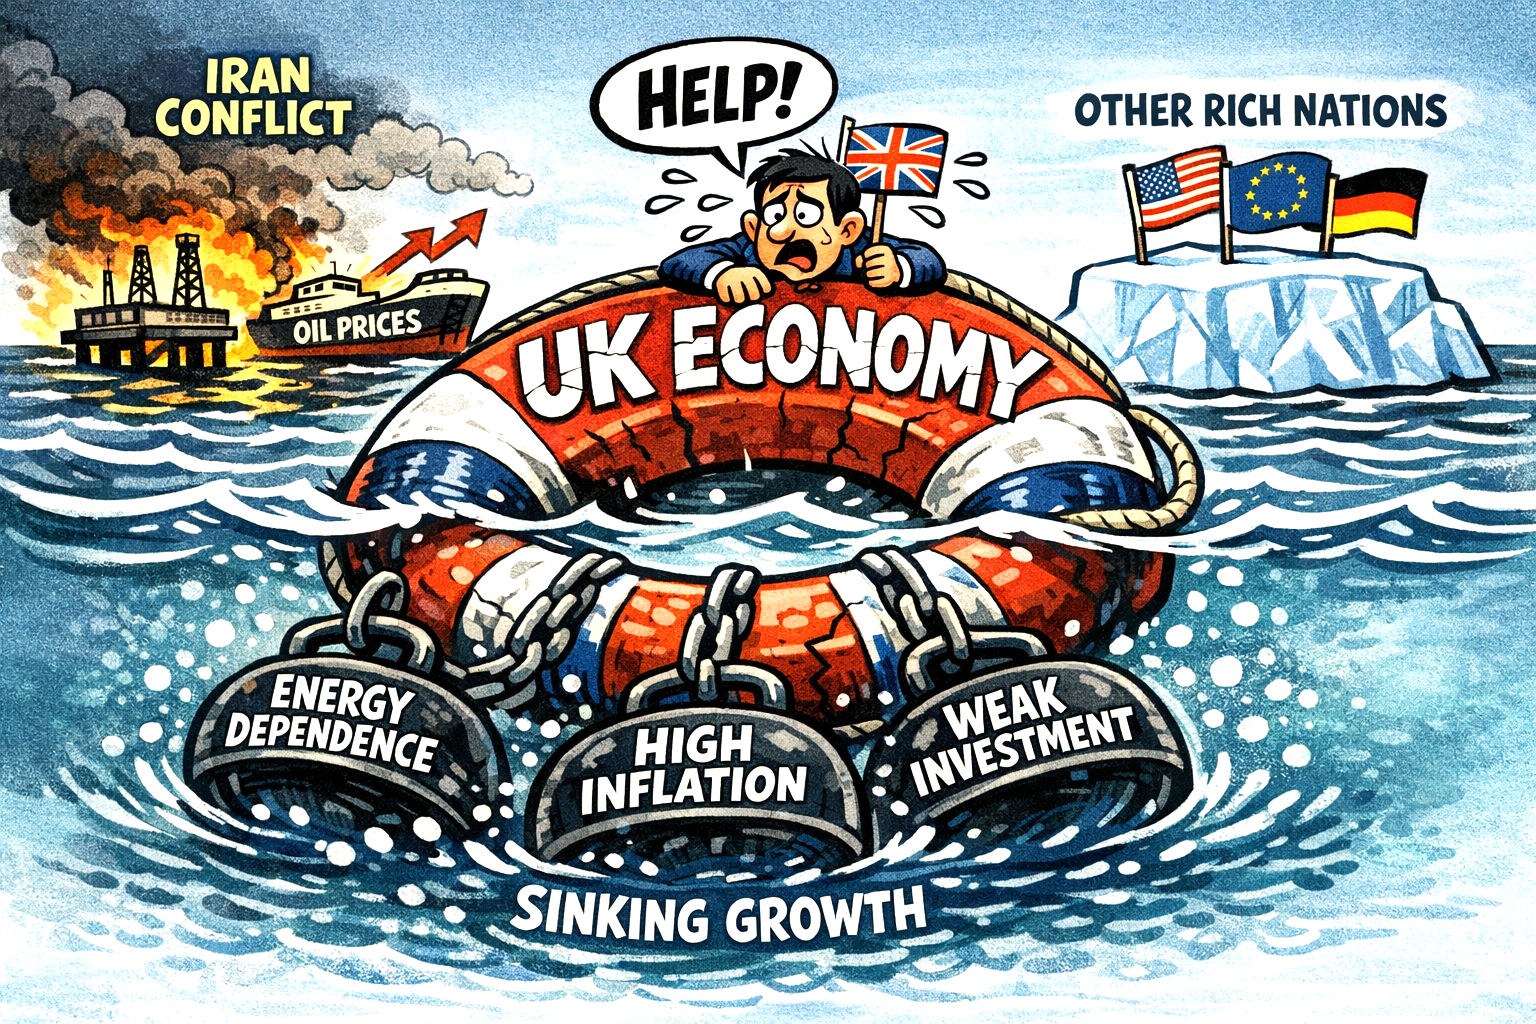
The IMF’s warning that the UK would suffer the sharpest growth hit among rich economies from an Iran‑related war is rooted in a simple structural reality.
Britain is unusually exposed to energy‑price shocks, yet unusually weak in the buffers that normally absorb them according to the IMF.
Why the UK will be hit harder than its peers
The UK enters this crisis with three vulnerabilities
High dependence on imported energy. North Sea output has declined for years, leaving Britain reliant on global LNG markets. When Middle Eastern supply is disrupted, LNG prices spike first and hardest. The U.S. and eurozone have deeper domestic energy bases or cheaper pipeline access.
A structurally fragile inflation profile. The UK’s inflation has been stickier than that of other G7 economies, driven by food, energy and services. A renewed oil shock feeds directly into household bills and transport costs, forcing the Bank of England to keep rates higher for longer.
Weak productivity and stagnant investment. Britain has less momentum to absorb an external shock. When energy prices rise, UK firms cut back faster, and consumers retrench more sharply.
UK Government policy. Ed Miliband and his ‘likely’ misguided staunch defence of Net Zero policies and expensive energy costs have left the UK seriously exposed to shocks – such as this.
The IMF’s logic
The Fund argues that a prolonged disruption in the Strait of Hormuz would push global oil prices sharply higher.
For the UK, this translates into
Higher wholesale gas costs, because LNG markets reprice off oil‑linked benchmarks.
A renewed inflation surge, delaying rate cuts and tightening financial conditions.
A squeeze on real incomes, hitting consumption—the UK’s main growth engine.
A fall in business investment, already one of the weakest in the OECD.
The IMF’s modelling suggests that the UK’s growth rate could fall more steeply than that of the U.S., Germany or France because those economies either have stronger industrial bases, more resilient energy systems or more fiscal space to cushion the blow.
The broader picture
This is less about geopolitics and more about structural brittleness. A global energy shock exposes the UK’s unresolved weaknesses: high import dependence, fragile inflation dynamics and a decade of under‑investment.