Artificial intelligence is advancing at an astonishing pace, but one of its most important developments often goes unnoticed.
Known as model distillation, the technique enables powerful AI systems to become smaller, faster and more practical without sacrificing too much performance.
It is a legal practice but the U.S. and its tech industry is concerned about fair play from other countries.
Teaching
Model distillation works rather like a master teacher passing knowledge to a talented apprentice. A large, highly capable AI model, often called the teacher, is used to train a much smaller student model.
Instead of learning solely from raw data, the student learns from the teacher’s decisions, patterns and reasoning. The result is a compact AI system that can perform many of the same tasks while requiring significantly less computing power – and therefore cheater too.
This has become increasingly important as businesses seek to deploy AI on everyday devices rather than relying entirely on cloud-based services.
Benefits
Smartphones, tablets, laptops, vehicles and industrial equipment all benefit from lightweight AI models that consume less memory, respond more quickly and use less energy.
Lower hardware requirements also reduce operating costs and improve accessibility for organisations of all sizes.
Distillation also plays an important role in making AI more sustainable. Large language models require vast amounts of electricity to train and operate.
By creating efficient distilled models, developers can reduce energy consumption and carbon emissions while still delivering intelligent applications to millions of users.
Beyond language models, distillation is widely used in image recognition, speech processing, robotics and cybersecurity. It allows sophisticated algorithms to operate in real-time, opening new possibilities for automation and intelligent decision-making.
Evolution
As AI continues to evolve, distillation is likely to become even more significant. Rather than simply building ever-larger models, the industry is increasingly focused on making intelligence more efficient, affordable and widely available.
In many respects, distillation represents the bridge between cutting-edge research and practical, everyday AI, ensuring that advanced technology can be used wherever it is needed most.
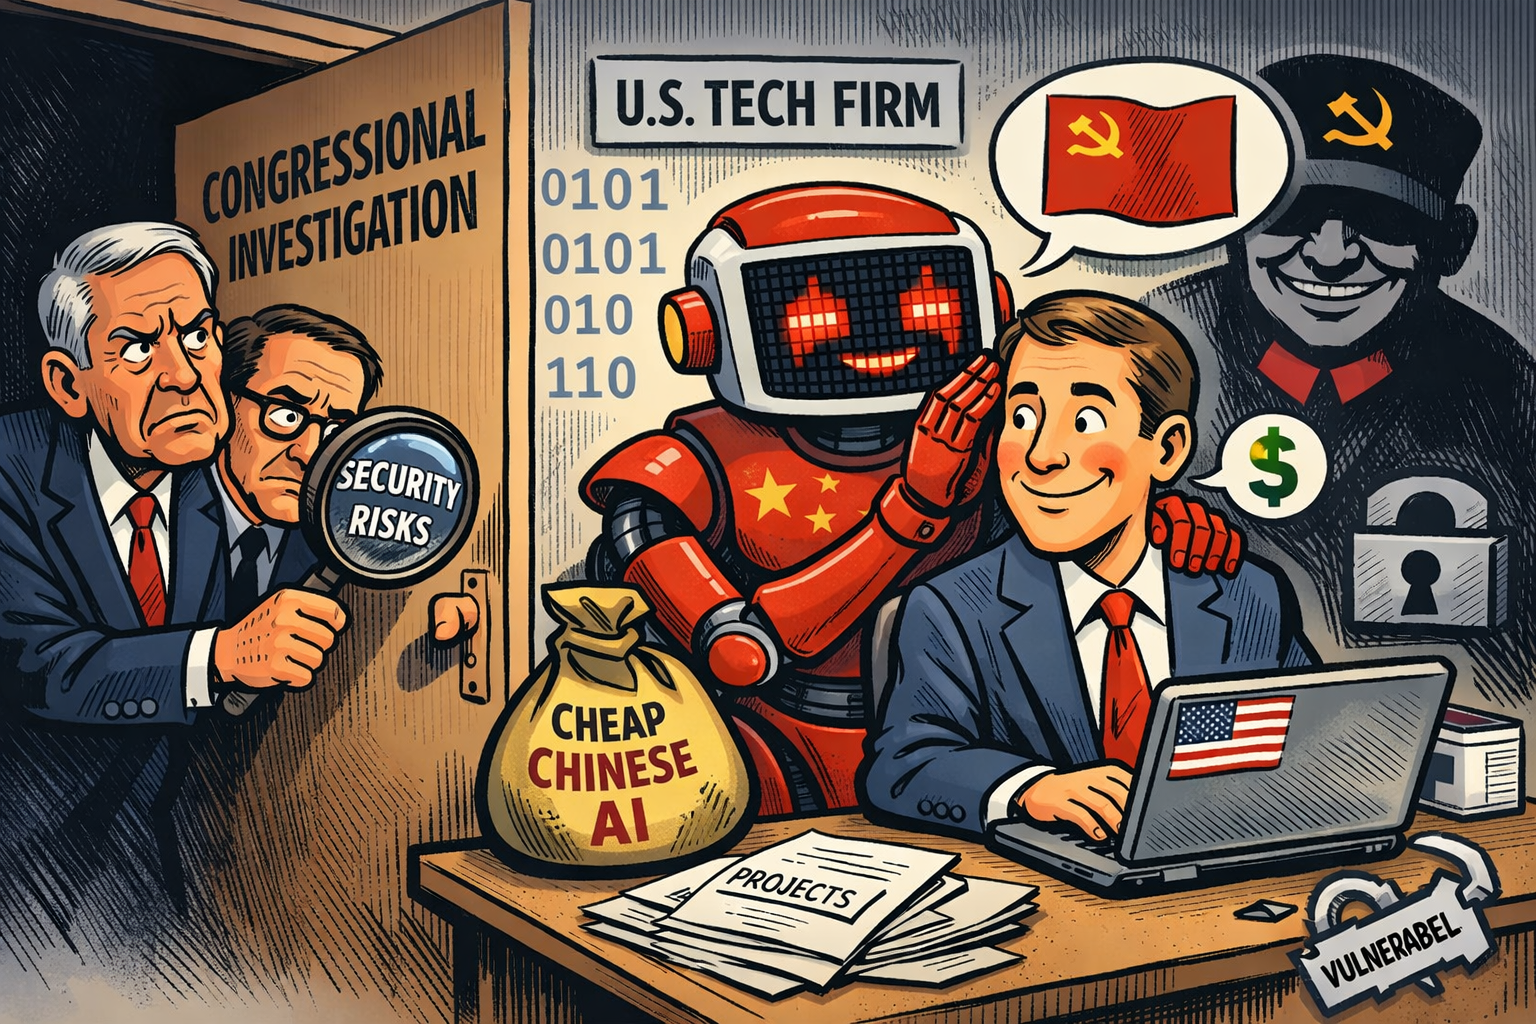
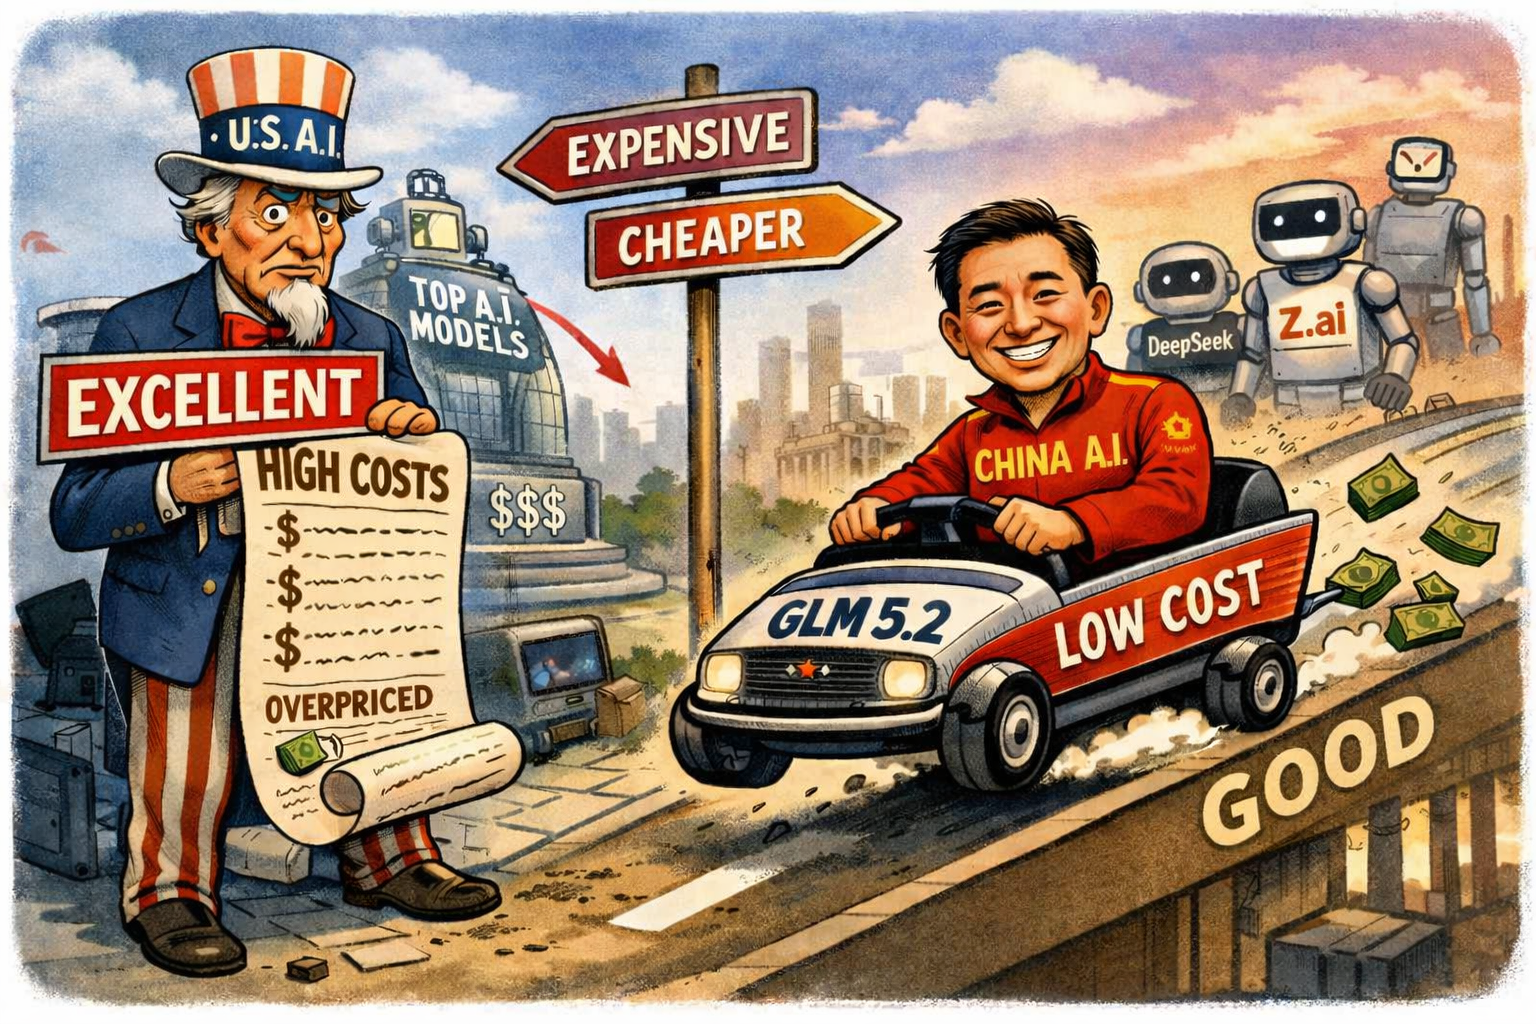
However, the growing success of lower-cost AI models has also become a strategic concern for the United States. In particular, some Chinese AI developers have demonstrated that highly capable models can be produced at a fraction of the cost of their Western counterparts by using techniques such as model distillation.
Debate
This has fuelled debate in Washington over whether advanced AI developed using American-designed semiconductors, software frameworks and research should be enabling overseas competitors to narrow the technological gap.
While there is no evidence that distillation itself is improper, policymakers have become increasingly concerned about the possibility of cutting-edge U.S. technology being used to accelerate the development of rival AI systems.
As a result, export controls on advanced chips and restrictions on access to certain AI technologies have become a central part of the wider competition between the United States and China.