Allegations of suspiciously timed trades have intensified in recent weeks as analysts, journalists, and regulators examine a series of market moves that coincided—sometimes to the minute—with major announcements about the U.S.–Iran conflict.
While no wrongdoing has been proven, the pattern has become difficult for commentators to ignore and calls for formal investigation are growing louder. Can these trades and market movement be explained as coincidence?
Potential ‘speculative’ trading?
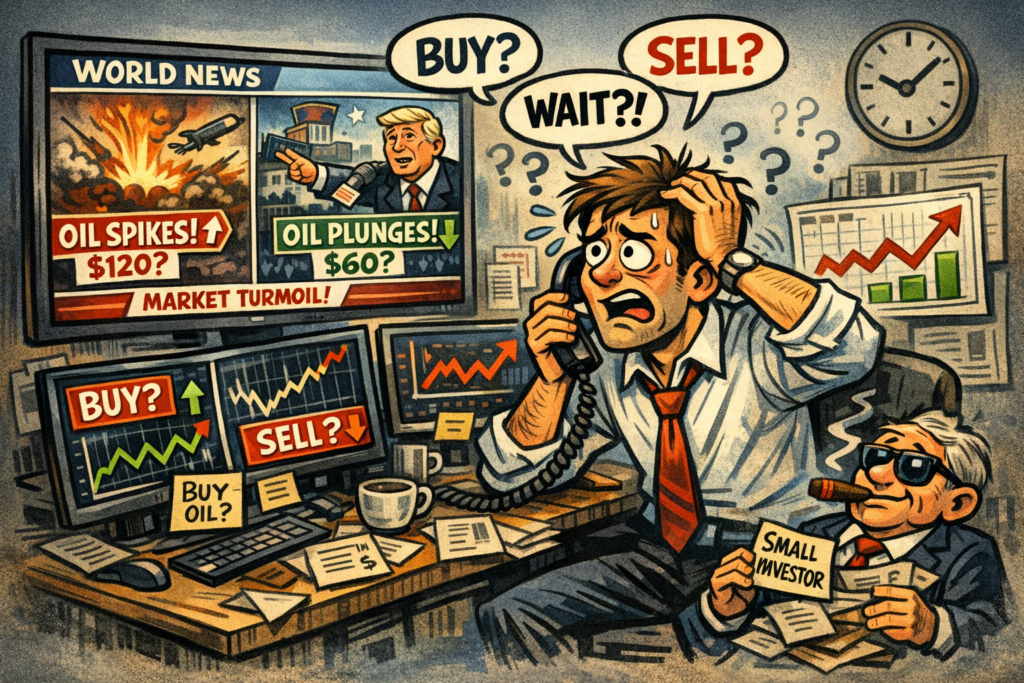
Many media outlets are also highlighting anomalies. For instance, it has been reported that Wealth manager Rachel Winter indicated traders appeared to take out contracts positioned to profit from falling oil prices just minutes before a presidential post claiming “productive” talks with Iran—timing she described as “speculation about insider trading” and worthy of investigation.
This episode was not isolated. Multiple outlets have documented at least two major bursts of unusually large oil futures trades placed shortly before conflict‑related announcements.
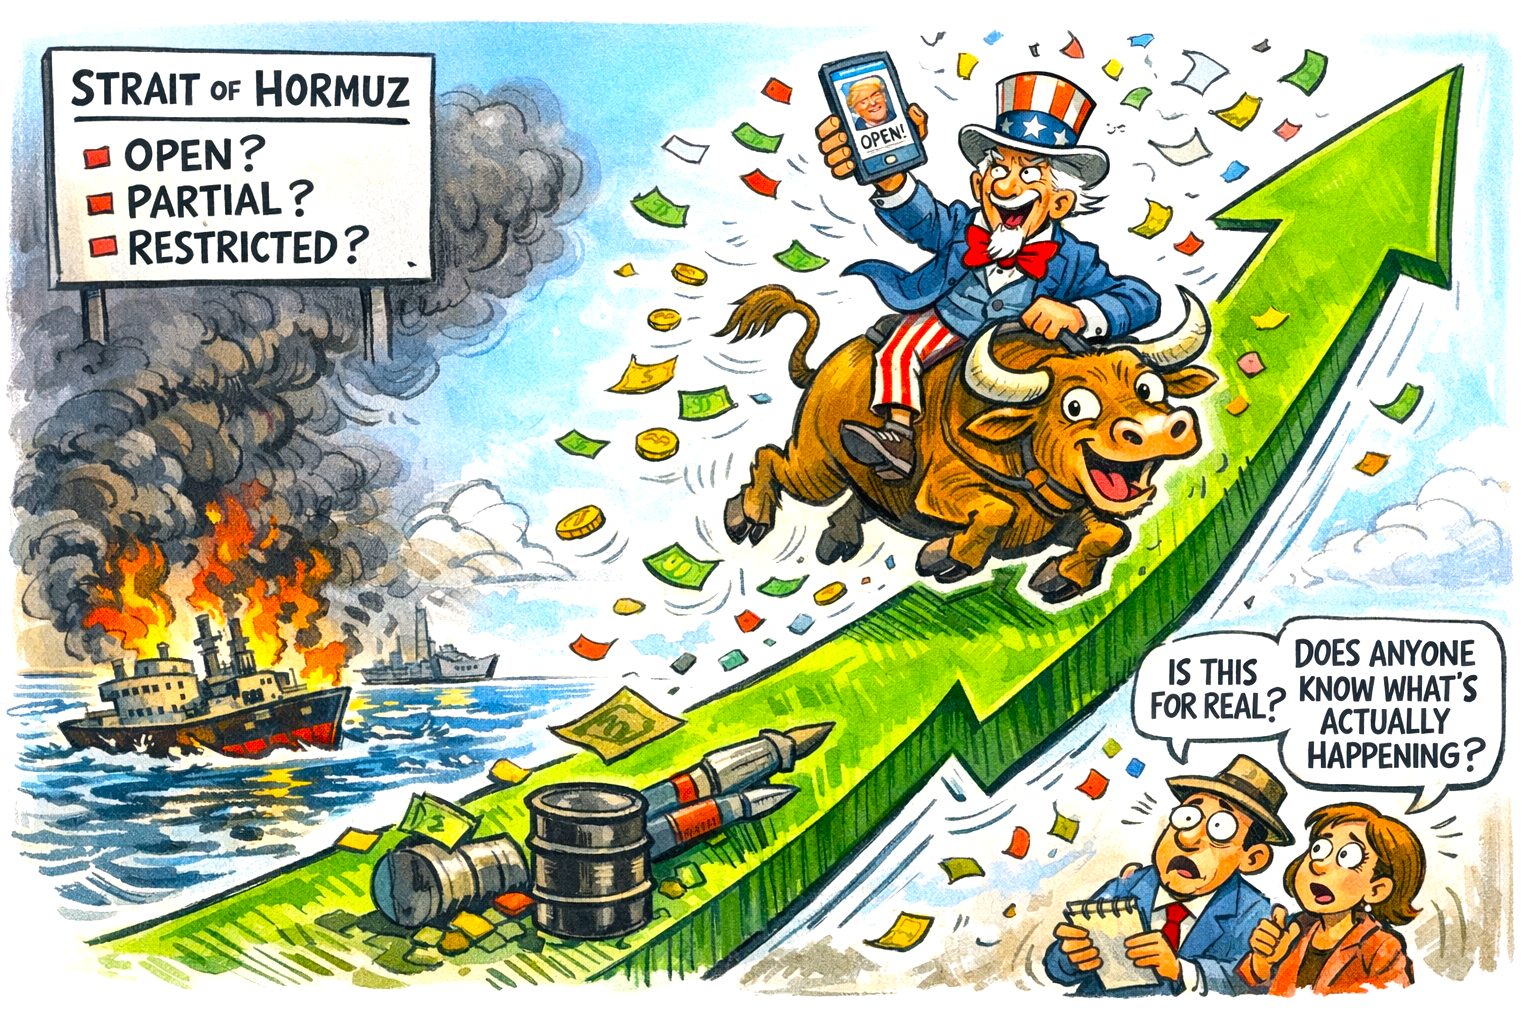
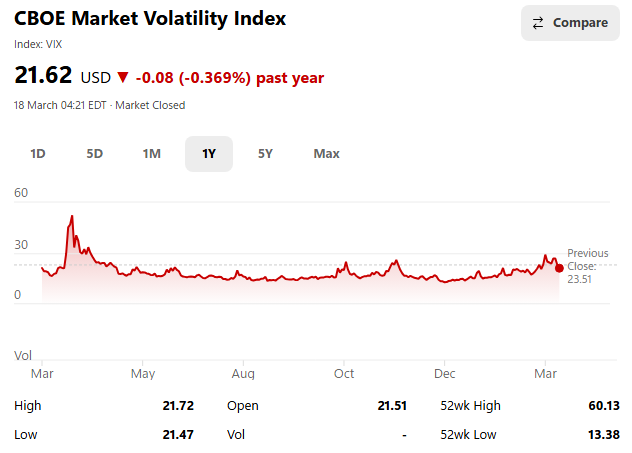
On 17th April 2026, it was reported that roughly $760 million in Brent crude short positions were executed around 20 minutes before Iran’s foreign minister declared the Strait of Hormuz “completely open” following a ceasefire—an announcement that sent oil prices sharply lower.
Analysts at the London Stock Exchange Group reportedly described the volume as “completely atypical,” nearly nine times normal levels.
Earlier in March 2026, it has been reported that traders placed around $500 million in positions shortly before the White House delayed planned strikes on Iran’s energy sector.
A similar pattern emerged on 7th April 2026, when roughly $950 million was positioned for falling oil prices hours before another ceasefire announcement.
These repeated bursts—each ahead of market‑moving news—have fuelled concerns that some traders ‘may’ have had access to information not yet public. Or was it a good guess – a coincidence even?
Reports of ‘unusual’ trading patterns
These reports align with broader commentary. The Independent noted that at least 6 million barrels’ worth of Brent and WTI contracts were suddenly sold in the two minutes before a presidential post about “productive” talks—again raising questions about advance knowledge.
Meanwhile, The London Economic reported that around $580 million in oil bets were placed 15 minutes before the same announcement, with market strategists calling the timing “really abnormal” for a day with no scheduled events.
Even outside traditional markets, anomalies have surfaced. Blockchain analysts identified six newly funded crypto wallets that made nearly £780,000 by betting—hours before explosions were reported—that the U.S. would strike Iran on 28th February 2026.
Across all these cases, commentators stop short of asserting intent. But the clustering of high‑stakes trades immediately before geopolitical announcements has created a clear narrative: the market signals are too sharp, too well‑timed, and too frequent to dismiss without scrutiny.
No intent is suggested – it could just be coincidence?