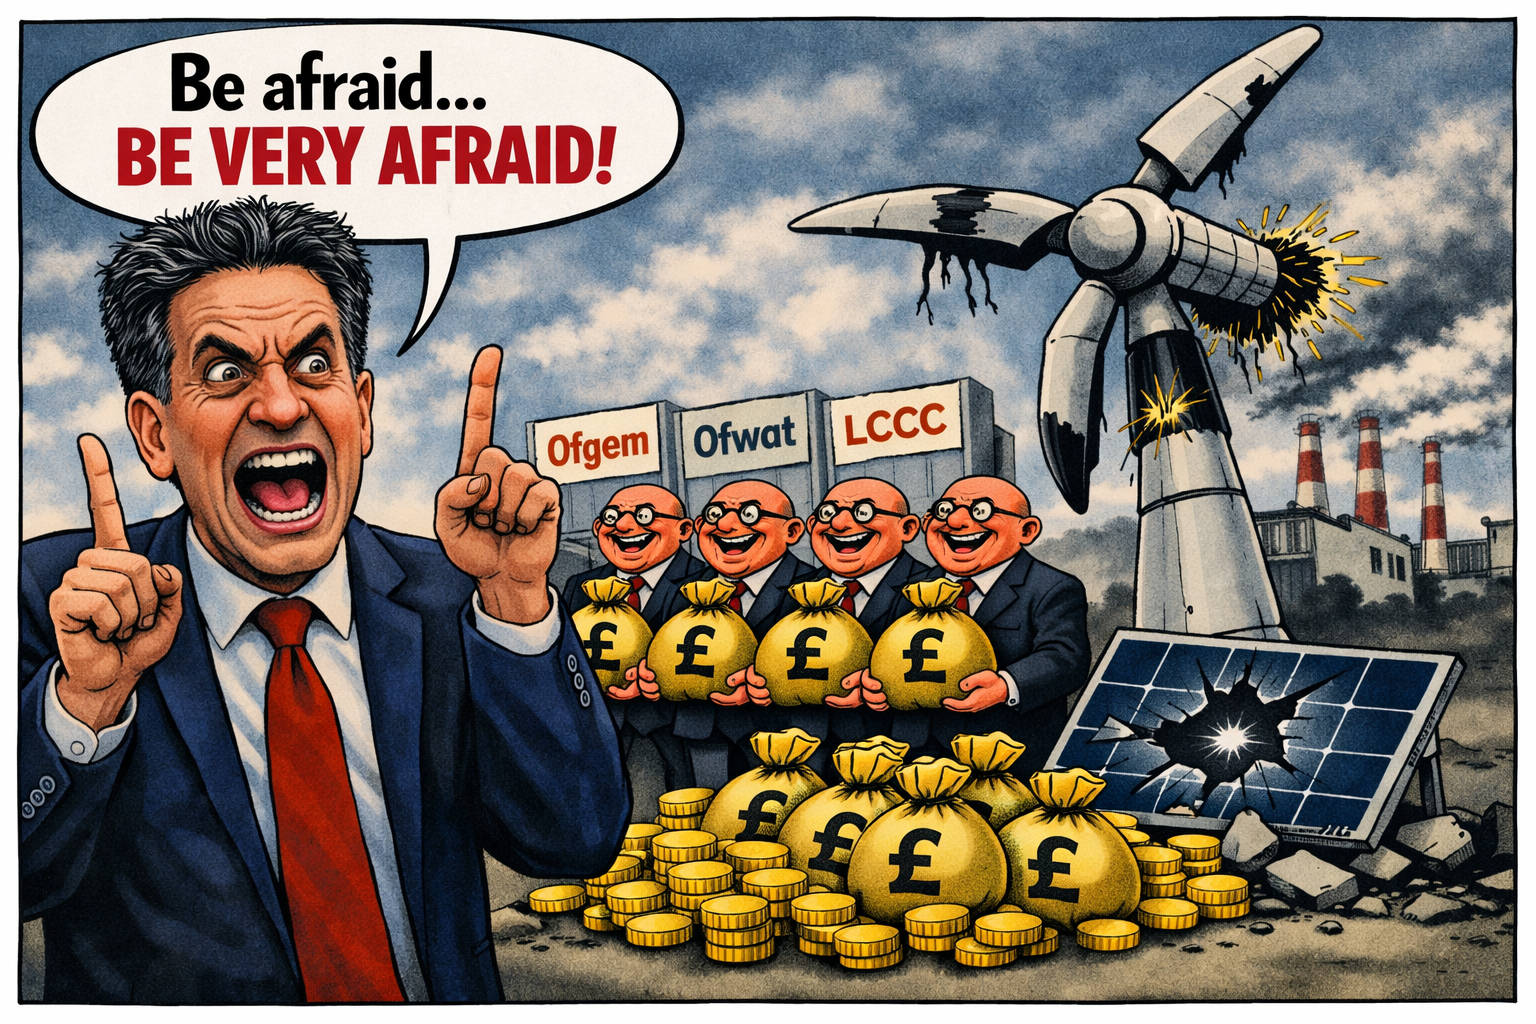
The Ed Miliband energy paradox: how Britain ended up paying France to take its power

UK energy paradox

If you are anything like me, you’re not wrong to feel that this is insane. On the face of it, Britain has:

  • Among the highest electricity prices in the developed world, especially for industry.
  • Growing periods of negative wholesale prices, where generators pay others to take power.

That combination is not just a glitch; it’s the product of how the UK has chosen to do net zero—through a tangle of subsidies, rigid contracts and a grid that was never upgraded to match the political ambition.

This is the Ed Miliband paradox: a “cheap renewables” story that somehow delivers some of the world’s most expensive power, and then occasionally becomes so oversupplied that we literally pay France and others to take it away.

What is actually happening when prices go negative?

Negative prices are not a metaphor. For several dozen hours already this year, the wholesale price of electricity in Britain has dropped below zero.

Generators effectively pay the system to keep running, and interconnectors export that surplus to countries like France, Holland and Belgium—sometimes with a “chunky payment” attached.

This happens when:

  • Supply massively exceeds demand—typically on windy, sunny, mild days when heating and cooling demand is low.
  • Certain generators cannot or will not switch off—because of technical constraints (nuclear, some gas) or because their subsidy contracts reward them for generating regardless of price.
  • The grid cannot move or store the surplus—limited storage, constrained transmission, and slow grid reinforcement mean power piles up in the wrong place at the wrong time.

In that moment, electricity stops being a valuable commodity and becomes a waste product that must be disposed of. Interconnectors to France and others are the “sewer pipe” for that surplus.

Why the UK is uniquely bad at this

Negative prices are not just a British phenomenon—Germany, Spain, the Netherlands and others have also seen record hours of sub‑zero prices as renewables surge. But the UK has managed to combine:

  • High average prices, especially for industry;
  • Frequent negative prices at the margin;
  • Huge policy costs loaded onto bills rather than general taxation.

That cocktail is the result of several design choices.

1. Subsidy structures that pay to generate, not to be useful

A big chunk of UK renewables is supported by:

In a negative price event, the market is screaming “stop generating”. But if your contract still pays you based on output, you have every incentive to keep going. The cost of paying someone else to take the power can be less than the subsidy you’d lose by switching off.

So the system ends up doing something perverse: it pays generators to keep producing power that nobody wants, and then pays other countries to take it away.

2. A grid built for yesterday, not for a renewables surge

The UK has poured money into generation capacity—offshore wind, solar, interconnectors—but has been slow, bureaucratic and under‑invested on:

  • Transmission upgrades—moving power from windy Scotland and the North Sea to demand centres in England.
  • Storage—batteries, pumped hydro, demand‑side response at scale.
  • Flexible backup—fast‑ramping gas, smart tariffs, and industrial load‑shifting.

When you bolt a 21st‑century renewables fleet onto a 20th‑century grid, you get congestion, curtailment and waste.

The system then has to pay wind farms not to generate in some regions, while importing power elsewhere. Negative prices are just the most visible symptom of that mismatch.

3. Political obsession with “headline capacity” over system design

Net zero politics has been sold as a race to headline numbers:

  • X gigawatts of offshore wind by year Y
  • Z per cent of power from renewables
  • “Clean power by 2030”

What has not been sold—or properly designed—is the system architecture that makes that capacity economically coherent: locational pricing, flexible demand, storage, and a planning regime that can actually deliver grid reinforcement on time.

Ed Miliband’s own Electricity Market Review explicitly rejected zonal pricing in favour of a reformed national price, arguing that a single price is “fairest” and better for investment. That sounds nice politically, but it hides the real cost of congestion and mis‑location.

Instead of prices signalling “don’t build another wind farm here until the grid is upgraded”, the system socialises the pain across everyone’s bills.

Why are we paying France?

Interconnectors are not inherently stupid. In a rational system, they:

  • Smooth out volatility—import when you’re short, export when you’re long.
  • Share capacity—you don’t need to build as much domestic backup if you can lean on neighbours.

The problem is that the UK has created a structure where:

  • We over‑generate at certain times because of rigid contracts and inflexible plant.
  • We lack storage and flexible demand to soak up that surplus domestically.
  • We then use interconnectors as a dumping ground, paying others to take power that our own consumers have already funded through subsidies and levies.

France, with its large nuclear fleet and different cost structure, can happily take that cheap or even “paid‑to-take” power, displacing its own generation and lowering its average costs.

Meanwhile, UK industry is paying power prices around 60 per cent higher than in France on average.

So, we (the UK) socialise the cost of building and subsidising the capacity, then export the benefit at a discount.

How did this policy architecture even get created?

This isn’t one bad decision; it’s a stack of incentives and political choices that line up in the worst possible way.

1. Short‑term politics, long‑term contracts

Governments of all colours wanted:

  • Quick, visible progress on renewables.
  • Private capital to fund it, not the state balance sheet.
  • Minimal upfront tax rises.

The answer was long‑term, legally binding contracts (RO, CfDs, capacity market) that shifted risk onto consumers via bills. Once signed, these contracts are hard to change without spooking investors or triggering compensation claims.

So ministers get the photo‑ops—“world‑leading offshore wind”, “clean power by 2030”—while the structural costs and distortions are baked in for decades.

2. Ideological framing: net zero as a moral crusade, not an engineering project

Net zero has been framed as a moral imperative first, an engineering challenge second. That has consequences:

  • Questioning the design is painted as questioning the goal.
  • Complex system trade‑offs are reduced to slogans about “cheap renewables” and “green jobs”.
  • Uncomfortable truths—like the need for gas backup, storage, and grid reform—are pushed into the technical long grass.

The result is a policy environment where it is easier to announce another offshore wind auction than to confront the messy, expensive business of rewiring the grid and redesigning market signals.

3. Regulatory fragmentation and institutional cowardice

Ofgem, National Grid ESO, the Department for Energy Security and Net Zero, the Treasury—each has a slice of the problem, but no one owns the whole system outcome.

  • Ofgem focuses on consumer protection and network costs, often slowing investment.
  • Treasury resists big upfront public spending on grid and storage, preferring “market‑based” fixes.
  • Ministers chase announcements that look good in manifestos.

No one is politically rewarded for saying: “We need to spend billions on grid reinforcement and storage now, or we’ll be paying France to take our power in five years.” So it doesn’t happen at the necessary scale.

Is this fixable, or are we stuck paying others to take our power?

It is fixable—but not with more of the same.

An honest, grown‑up approach would mean:

  • Rewriting incentives so generators are paid for being useful to the system, not just for raw output. That means tighter rules on when subsidies are paid during negative prices, and contracts that reward flexibility.
  • Accelerating grid and storage investment as national infrastructure, not an afterthought. That likely means more state involvement and faster planning, not just hoping private investors will do it.
  • Introducing stronger locational signals—whether full zonal pricing or something close to it—so that the cost of building in the wrong place is visible, not smeared across everyone’s bills.
  • Using interconnectors intelligently, not as a dumping ground: export surplus when it’s genuinely cheap, but don’t subsidise over‑generation just to keep contracts happy.

So how stupid is this policy?

On a technical level, the engineers keeping the lights on are doing miracles with the system they’ve been given. The stupidity sits higher up:

  • Designing a net zero pathway around rigid subsidies and under‑built infrastructure.
  • Refusing to confront the trade‑offs, then acting surprised when the physics bites back.
  • Allowing a political narrative of “cheap green power” to coexist with some of the highest industrial prices in the world and growing episodes of negative pricing.

The real scandal isn’t just that we pay France to take our power. It’s that British households and firms have already paid once—through levies and high tariffs—to build that surplus, and then pay again when the system has to bribe someone else to use it.

Work that one out…!

Oh Dear – Here we go again – Seven Prime Ministers in Ten Years: Why is Britain’s Politics Failing?

7 PMs in 10 Years

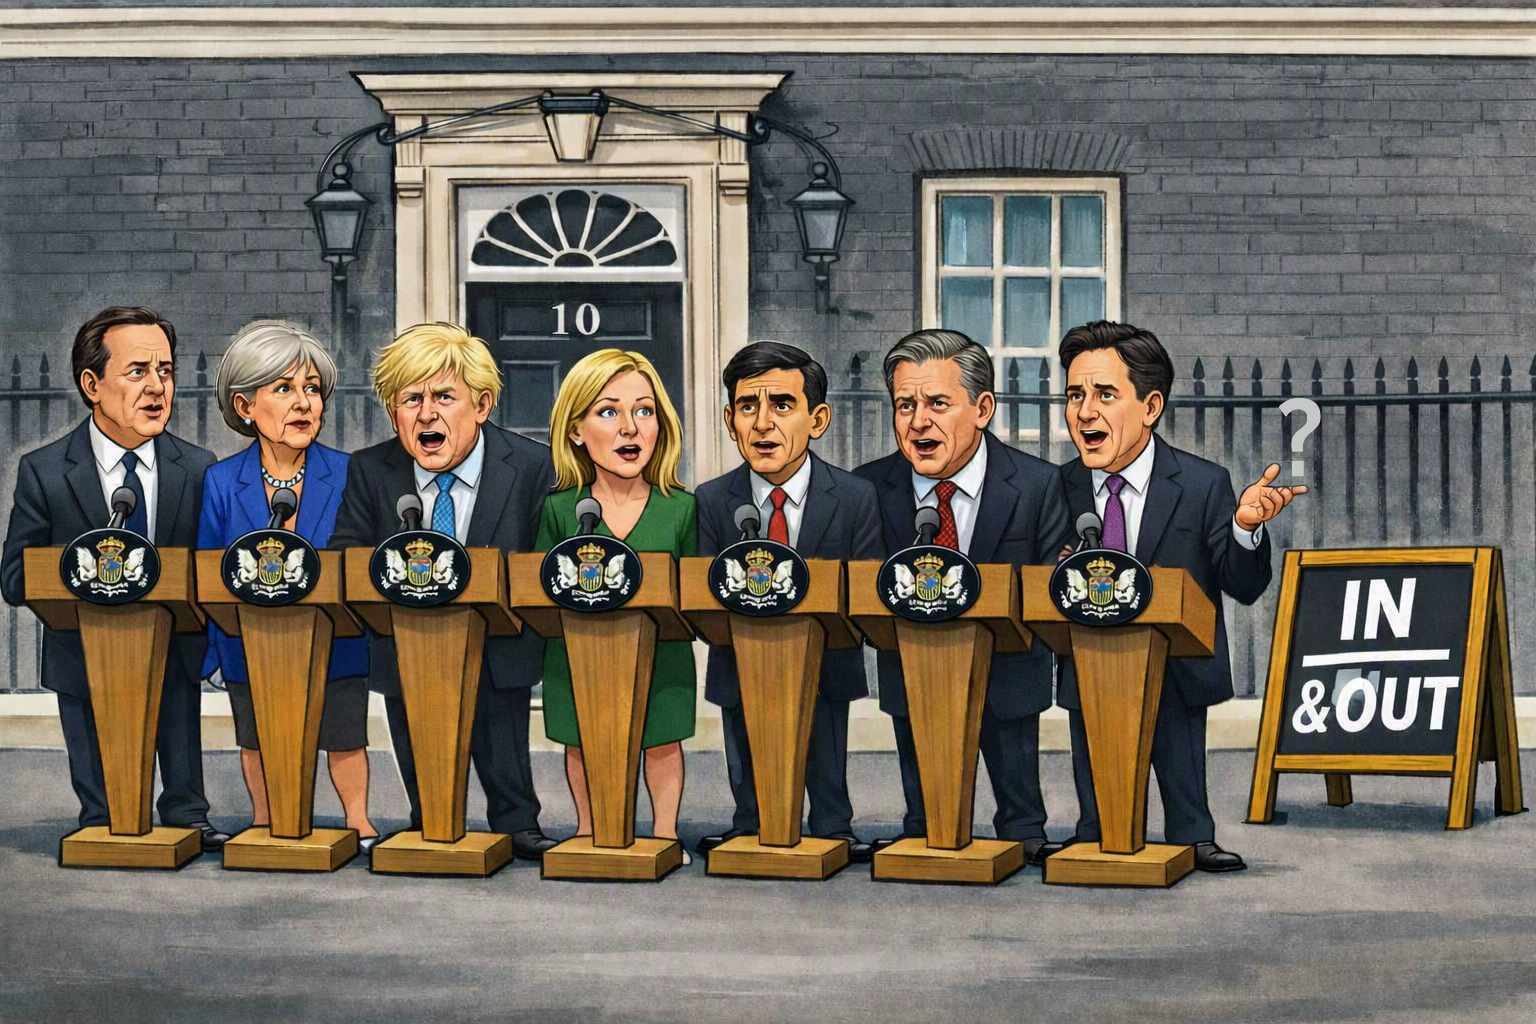
Britain has now burned through seven prime ministers in a decade, an extraordinary rate of political turnover for a country that once prided itself on institutional steadiness.

This is not a run of bad luck or a string of unfortunate personalities. It is the symptom of a political system that has lost its way!

The first rupture was Brexit, which detonated the old Conservative coalition and replaced it with a permanent internal civil war.

Disfunctional

The party ceased to function as a unified governing force and instead became a collection of factions, each convinced it alone represented the “true” mandate of the referendum. Prime ministers were no longer leaders but temporary referees.

Once they failed to contain the infighting, they were removed. Theresa May fell to it. Boris Johnson was consumed by it. Liz Truss was destroyed by it in record time.

But the deeper failure is structural exhaustion. Westminster has been in crisis mode since 2016: Brexit negotiations, minority government, pandemic, inflation shock, energy turmoil, geopolitical instability.

Let’s CHANGE again – just becuase we can

Firefighting

The machinery of state has been asked to deliver transformation while simultaneously firefighting. That combination breeds short‑termism. Policies are launched for headlines rather than outcomes.

Leaders are judged by weekly polling rather than national strategy. The result is a political class that behaves like a boardroom under siege — reactive, brittle, and permanently on edge.

Disillusioned

Layered on top is public disillusionment. Trust in politics has collapsed to historic lows. Voters now punish governments faster and more aggressively than at any point in modern British history. Every scandal becomes existential.

Every by‑election becomes a referendum on the prime minister’s survival. MPs panic, parties fracture, and leaders lose authority long before the electorate formally removes them.

Vacuum

Finally, Britain faces a governance vacuum. The country has major structural problems — weak productivity, regional inequality, an overstretched NHS, fragile public finances — but no long‑term political consensus on how to fix them.

Without a shared national direction, governments drift, parties implode, and leadership churn becomes inevitable.

Fund your way UK?

7 in 10

Seven prime ministers in ten years is not a curiosity. It is a warning light. Until the UK rebuilds political discipline, restores institutional seriousness, and commits to long‑term strategy over short‑term spectacle, the revolving door at No. 10 will keep spinning.

Personal gain – the country’s loss. Imagine if a business was run like this?

And, for your information the UK has had 21 Prime Ministers in the past 100 years (1926 to 2026) including the 7 in the past 10 years.

So, that’s one third of the 21 PM’s in the last 10 years – just think about that.

Shocking, and no wonder the country is lost it’s identity and direction – the people running it don’t even know who they are or what the truly stand for.

Let’s put the vote back to the people.

We can’t keep chopping and changing like this.

UK and U.S. economic data roundup as of week ending 19th June 2026

UK U.S. June 2026 economic data

United Kingdom – Latest Data This Week to June 19th 2026

Labour market:

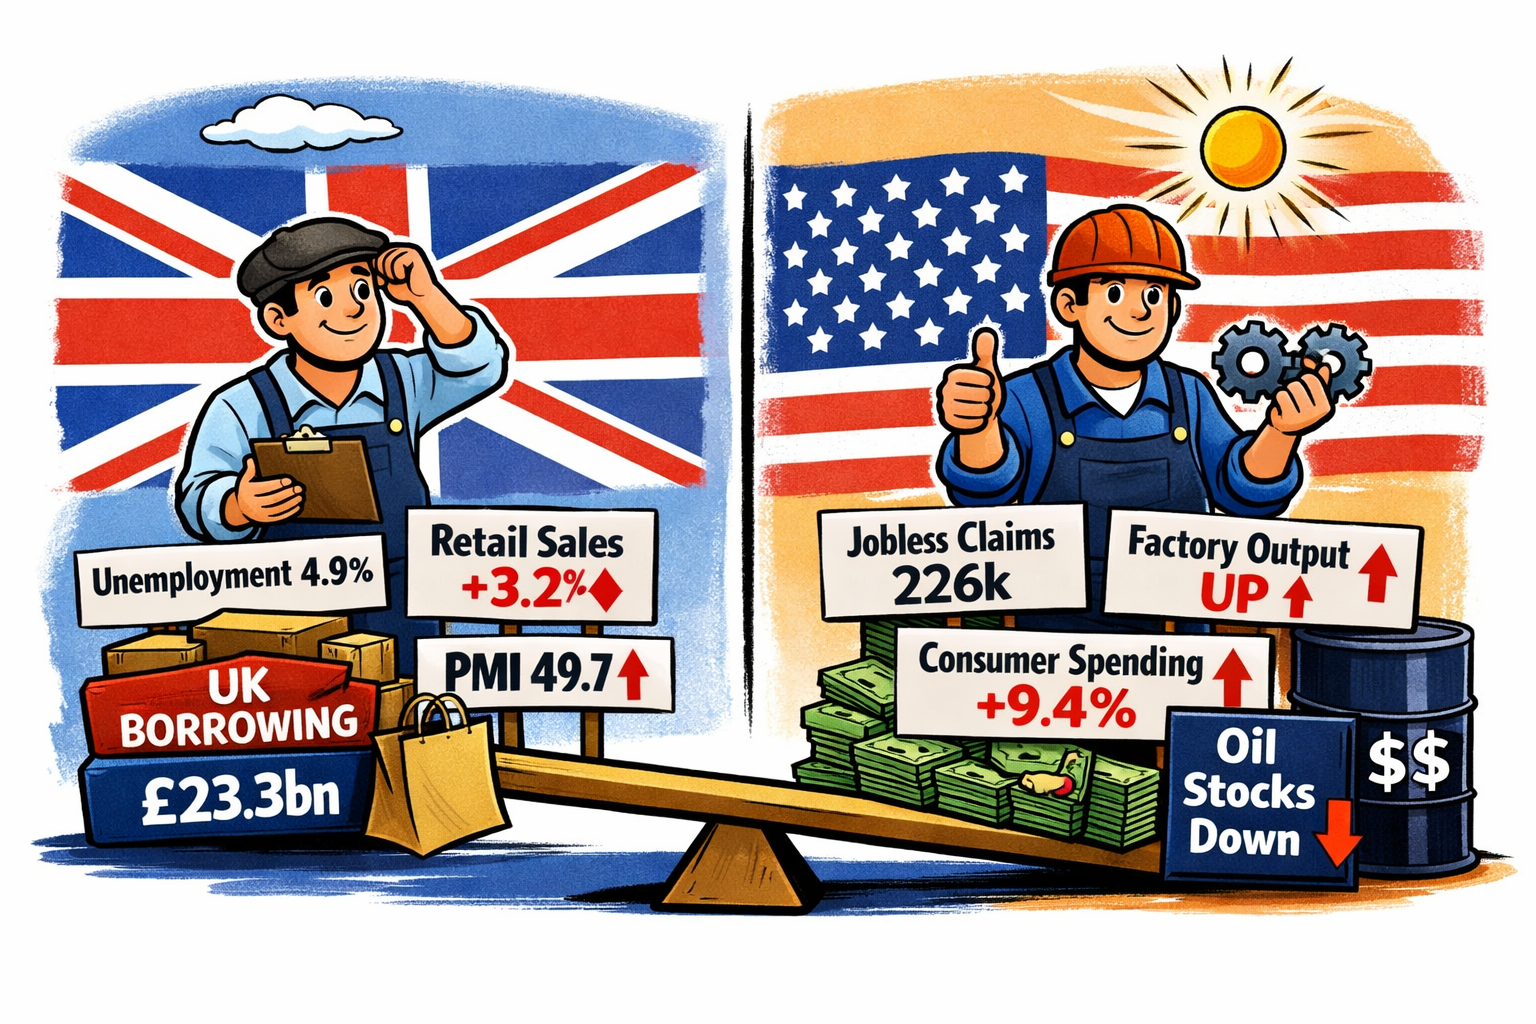
  • The UK unemployment rate for April 2026 held at 4.9%, slightly below the previous 5% reading. Average earnings including bonuses grew 4.4%, while earnings excluding bonuses rose 3.4%. Employment increased by 100,000 in April, although HMRC payrolls for May showed only a marginal +2,000 change.

Retail sales:

  • Retail sales rebounded strongly in May 2026, rising 1.2% month‑on‑month and 3.2% year‑on‑year, reversing April’s declines. Retail sales excluding fuel also rose 1.2% MoM and 4.6% YoY.

Public finances:

  • Public sector net borrowing (excluding banks) came in at £23.3bn in May, slightly worse than April’s revised figure.

Business activity:

  • Flash PMIs for June show mixed momentum:
    • Manufacturing PMI: 53.9 (expansion)
    • Services PMI: 49.3 (contraction)
    • Composite PMI: 49.7 (borderline contraction) These readings suggest the UK economy is losing some pace heading into summer.

United States – Latest Data This Week to 19th June 2026

Labour market:

  • Initial jobless claims for the week ending 13th June 2026 fell slightly to 226,000, broadly in line with expectations. Continuing claims rose to 1.81 million, indicating some softening in labour market conditions.

Manufacturing & business surveys:

  • The Philadelphia Fed Manufacturing Index jumped to 10.3 in June from –0.4, signalling a notable improvement in factory activity.
  • The S&P Global flash PMIs for June show:
    • Manufacturing: 55.1 (solid expansion)
    • Services: 50.7 (modest expansion)
    • Composite: 51.5 (steady growth) These point to a resilient US private‑sector backdrop.

Housing & consumer indicators:

  • Mortgage rates eased slightly, with the 30‑year rate dipping to 6.47%.
  • Redbook retail sales rose 9.4% YoY, suggesting firm consumer spending.

Capital flows & energy:

  • Net long‑term TIC flows for April registered $103.1bn, indicating strong foreign demand for US assets.
  • API data showed a sharp –8.33 million barrel draw in crude oil stocks, hinting at tighter near‑term supply.

Overall Pictures for UK and U.S.

  • UK: A mixed week — labour market steady but softening at the margins; retail sales surprisingly strong; PMIs signalling a mild loss of momentum; public borrowing still elevated.
  • US: Data broadly stronger — manufacturing rebounded, services steady, jobless claims stable, and consumer spending indicators show firm.

ECB Interest Rate Hike to 2.25% and UK GDP Contracts 0.1%

Slow UK Growth for April 2026

The European Central Bank jolted markets yesterday with its first interest‑rate increase since 2023, a move driven by renewed energy‑price pressures linked to the U.S./Iran conflict.

Policymakers signalled that the surge in wholesale gas and oil costs is feeding back into euro‑area inflation, forcing a return to tightening after more than two years of stability.

Investors had expected a cautious stance, but the ECB argued that delaying action risked inflation becoming embedded again, particularly in energy‑sensitive economies such as Germany and Italy.

The decision pushed bond yields higher across the bloc and strengthened the euro, reflecting expectations of a more hawkish path through the summer.

UK Lacklustre Growth

In the UK, fresh GDP data released by the ONS for April 2026 offered a more mixed picture. The economy expanded modestly, continuing the fragile recovery seen earlier in the year, but underlying momentum remains weak.

Services provided the bulk of the growth, while manufacturing and construction were broadly flat.

Economists warn that higher energy prices — the same shock driving the ECB’s decision — could weigh on UK output in the coming months, squeezing household budgets and raising costs for businesses.

Together, the ECB’s shift and the UK’s tentative growth figures underline how vulnerable Europe remains to global energy disruptions.

The Great Nutrition Food Label Lie – Fix this and you’ll help fix a Nation’s health

Food labelling needs fixing

Walk into any British or European supermarket and you’ll see the same reassuring fiction printed on every packet: neat percentages, confident numbers, a promise of scientific clarity and colour coded convenience.

It is theatre. The modern food label is not a health tool — it is a relic of the 1970s – 1990s, embalmed in regulation and defended by an industry that knows honesty would collapse half its product line.

These labelling standards have undergone updates in the 1990’s and early and mid 2000’s but still they fundamentally sit out of date and therefore remain misleading.

Defunct food labelling system

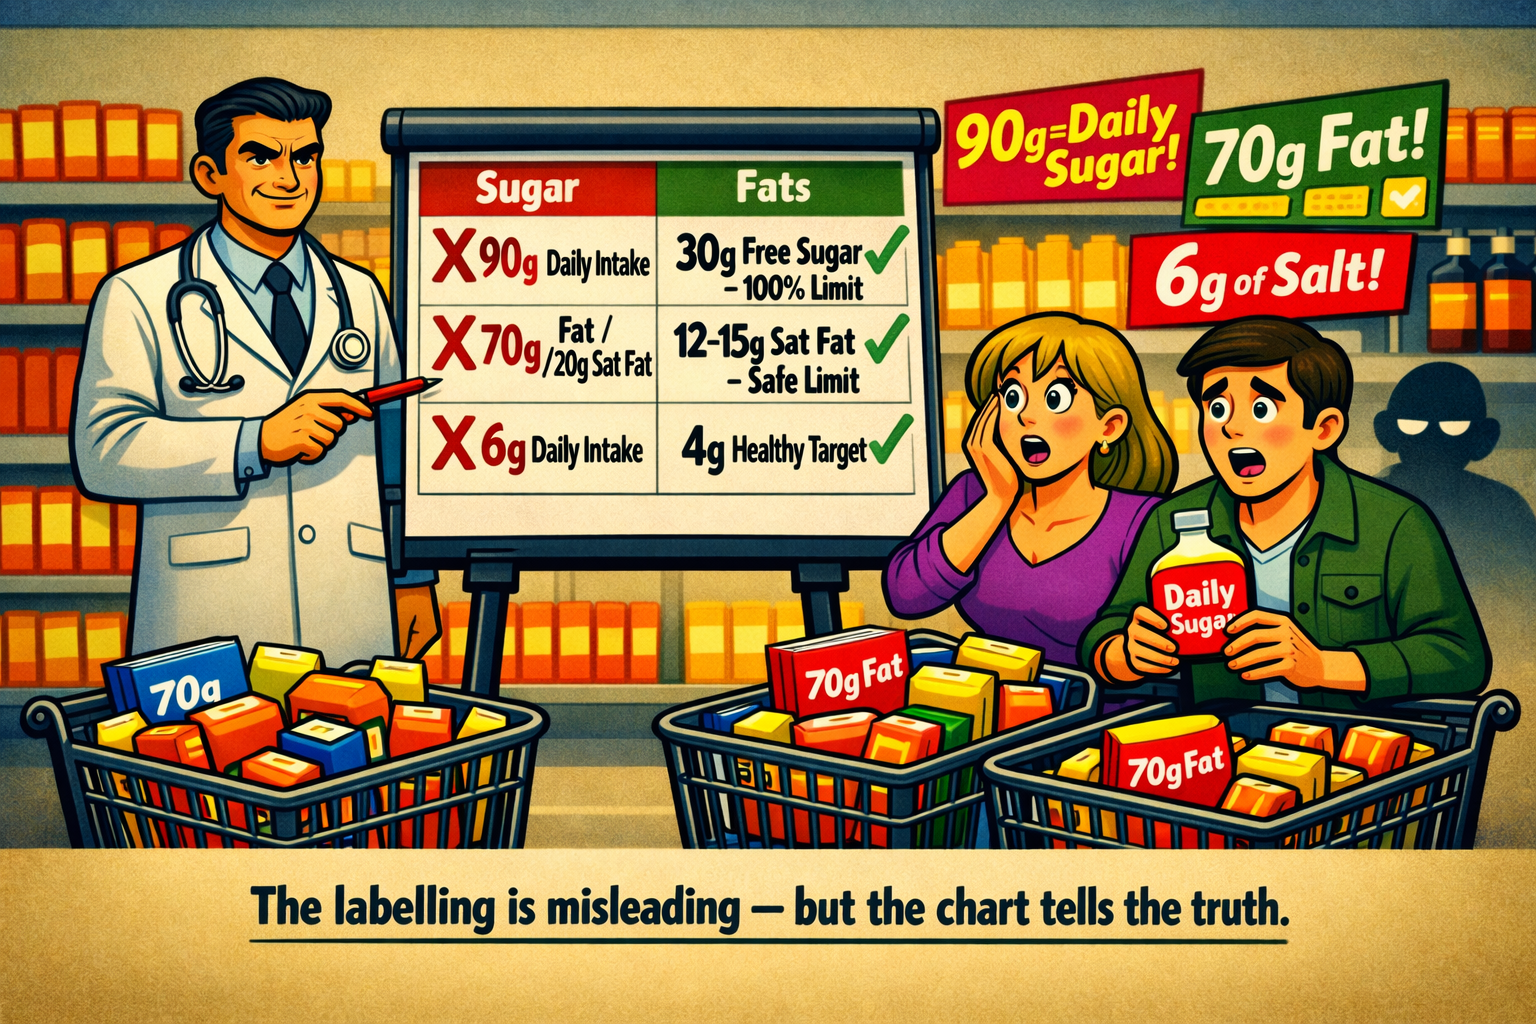
In the UK and EU, the entire labelling system still rests on a reference framework that includes 90 g of “sugars” per day, a number carried forward into EU Regulation 1169/2011 and still used in UK guidance after Brexit. That figure is not a modern health limit; it is a bureaucratic fossil.

Even though the label says “90 g total sugars”, it’s presented as if that number were a health benchmark.

In reality:

“Total sugars” mixes harmless natural sugars (lactose in milk, fructose in whole fruit) with harmful free sugars (added sugar, honey, syrups, juice).

The 90 g figure was never meant to represent a safe or recommended intake — it’s just a reference value for all sugars combined, created for packaging consistency.

Because the label doesn’t separate the types, it makes high‑sugar products look acceptable. A drink with 30 g of added sugar can appear to be only “⅓ of your daily intake,” when it’s actually 100 % of your real free‑sugar limit.

Even though it’s sold as ‘total’ sugar, the system labelling is misleading and outdated. It hides the distinction that matters most for health: free sugars vs natural sugars.

RI – reference intake, GDAs Guideline Daily Amounts, Fats, Saturated Fats, Sugars, Salt, and Calorific VALUES are relics of a by-gone age and desperately need updating to reflect our health standards now and not of the past.

30g of free sugars intake per day NOT 90g total

Today, the UK’s own scientific advisers recommend no more than 30 g of free sugars per day — one third of the value used on the label.

Yet the packaging continues to tell consumers that a drink containing 30 g of sugar represents “33% of your daily intake”. It is a mathematical truth wrapped around a public‑health deception.

Deception

This is not a rounding error. It is structural deception. A system that knowingly uses outdated reference values is not neutral — it is actively distorting consumer perception.

Informs parents that a cereal bowl full of sugar is “fine”.

Tells children that a bottle of fizzy drink is “OK” at these levels.

It makes adults think that they are staying “within their daily intake” while quietly pushing them into metabolic disease.

Lies

And sugar is only the most egregious example. The same legacy scaffolding props up the numbers for fat, saturated fat and salt. The 2,000 kcal baseline is generous for many adults.

The 70 g fat and 20 g saturated fat references are compromises from another era. The 6 g salt figure remains stubbornly high in a continent battling hypertension.

The label percentages are calculated against the 90 g total and not the 30 g limit. This is misleading. 90 g of total sugars is not 30 g of free sugars (added). The 90 g is far too high. It should be calculated on the 30 g figure as an added free sugar total.

Example: If you drink a can of cola, it contains approximately 35 g of added sugar. In terms of your daily ‘healthy’ allowance, you have consumed over 115% of your daily limit in just that one drink.

However, because regulations dictate that the label must be calculated against Total sugars of 90 g, the can of cola will read as on around 39% of your reference intake.

This allows for a higher sugar on a percentage basis, matching the misleading total sugar levels. Convenient for the food industry but shockingly bad for your health.

These numbers persist not because they are right, but because changing them would expose the truth: a vast proportion of the modern food supply is incompatible with modern health science.

Authorities know this but it has been calculated that approximately just 1% of the general population know

Governments know this. Industry knows this. Everyone involved understands that if labels were recalibrated to reflect current evidence — 30 g free sugars, lower salt, tighter saturated fat limits — supermarket shelves would light up like hazard boards.

Half the “family favourites” would show triple‑digit percentages. “Per portion” tricks would collapse. The quiet illusion of moderation would die overnight.

Broken

So the system stays broken. Regulators hide behind “reference intakes”. Manufacturers hide behind “portion sizes” no human actually eats.

Politicians hide behind the language of “consumer choice”. And the public — especially children — pay the price.

Rising obesity, fatty liver disease, overweight, type 2 diabetes and dental decay are not mysterious social trends. They are the predictable outcome of a labelling regime designed to soothe, not inform.

Scandal

This is a scandal. Not a dramatic one, but a slow, grinding, bureaucratic scandal — the kind that reshapes a population’s health without ever making the front page.

An honest labelling system would be simple: use current scientific limits, distinguish clearly between total and free sugars, and ban fictional portion sizes.

Until that happens, every label in the supermarket is a small act of misdirection — and we are raising a generation inside a nutritional hall of mirrors.

The health of a nation would be improved dramatically improved overnight by removing this disception.

We eat too much and these misleading labels encourage that problem.

It’s easily fixed.

Stop misleading the public and change the labelling to reflect our current deteriorating health in the UK and other countries too.

Eat less.

Fix the labels.

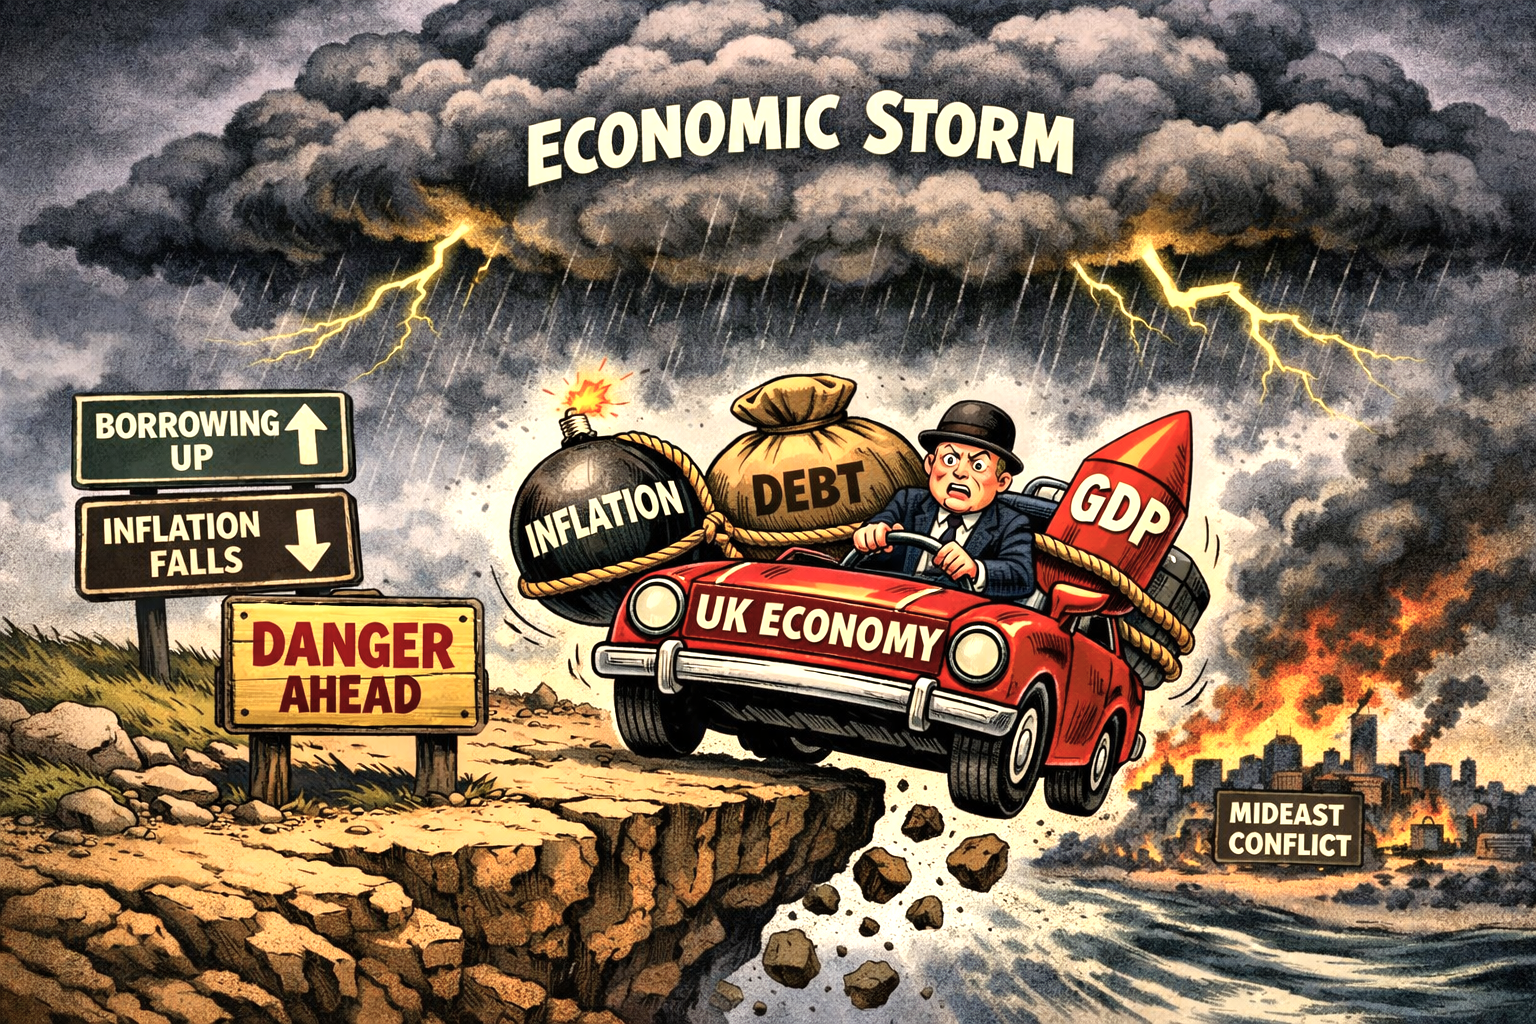
UK Data Trio Offers Mixed Signals on Prices, Public Finances and Growth – Storm Clouds Gather

UK Economic data April 2026

The UK’s latest run of economic data has delivered a contradictory picture: inflation easing sharply, borrowing surging, and growth outperforming expectations.

Together, the figures show an economy stabilising in some areas while coming under renewed strain in others.

Inflation (CPI)

April CPI fell to 2.8%, down from 3.3% in March, the lowest rate in nearly three years.

The drop was driven by Ofgem’s April energy price cap, which cut household gas and electricity bills, alongside softer rises in water charges, road tax and several food categories.

But economists warn the relief will be temporary. Wholesale energy prices have risen sharply since the U.S. / Iran conflict escalated, and inflation is expected to climb back above 4% later in the year.

The Bank of England is therefore likely to remain cautious about cutting rates.

Forecast out of sync

Government Borrowing (April 2026) The borrowing picture was far less encouraging. The government borrowed £24.3 billion in April — the highest April figure since 2020 and well above the £20.9 billion forecast by the OBR.

Borrowing was £4.9 billion higher than the same month last year, driven by inflation‑linked increases in benefits, the earnings‑linked rise in the state pension, and record April debt‑interest payments of £10.3 billion in 2026.

Analysts note that this deterioration comes before the full impact of the energy‑price shock is felt, raising concerns about the fiscal outlook for the rest of the year.

Growth

GDP Growth The bright spot came from growth: the economy expanded 0.3% in March 2026, beating expectations of a slight contraction, and delivered 0.6% growth for Q1 — the fastest among G7 countries reporting so far.

However, the ONS highlights that much of March’s strength reflected “front‑loading” of spending ahead of expected price rises linked to the Iran war, suggesting momentum may fade as higher energy and fuel costs feed through.

This data comes as the global economy waits for the full impact of the U.S. / Iran conflict to unravel.

Why is UK Politics in such a Shambles?

UK Political Shambles

Britain has ripped through five prime ministers in just over five years — Theresa May, Boris Johnson, Liz Truss, Rishi Sunak, and now the prospect of yet another change.

It is not simply bad luck or a run of flawed leaders. It is the visible symptom of a political system that has lost focus and direction.

Conservative infighting to Labour back biting!

The core problem is structural volatility. The UK’s unwritten constitution relies heavily on norms, restraint and party discipline. Over the past decade, those stabilising forces have collapsed.

Brexit

Brexit detonated the old Conservative coalition, splitting MPs into factions that no longer share a common project. Once a party becomes a collection of tribes, leadership becomes temporary management rather than authority.

Prime ministers are installed not to govern but to contain internal warfare — and they are removed the moment they fail to do so.

Exhaustion

The second driver is institutional exhaustion. Westminster has been running in crisis mode since 2016: Brexit negotiations, minority government, pandemic, inflation shock, energy crisis, geopolitical instability.

The machinery of state has been asked to deliver transformation while simultaneously firefighting. That combination breeds short-termism. Policies are launched for headlines, not outcomes.

Leaders are judged by weekly polling, not national strategy. The result is a political class that behaves like a boardroom under siege — reactive, brittle, and constantly reshuffling the chief executive.

Disillusioned

A third factor is public disillusionment. Trust in politics has fallen to historic lows. Voters now punish governments faster and more aggressively than at any point in modern British history.

The electoral cycle has shortened psychologically: every scandal becomes existential, every by‑election a referendum on the prime minister’s survival.

This creates a feedback loop where MPs panic, parties fracture, and leaders lose authority long before the public formally removes them.

Gap

Finally, the UK faces a governance gap. The country has major structural problems — weak productivity, regional inequality, an overstretched NHS, fragile public finances — but no long-term political consensus on how to fix them.

Without a shared national direction, governments drift, parties implode, and leadership churn becomes inevitable.

Britain’s political chaos is not random. It is the predictable outcome of a system that has lost coherence, a governing party that has lost unity, and a public that has lost patience. Until those three forces stabilise, the revolving door at No. 10 will keep spinning.

Just look at the calibre of politicians in the UK – or lack thereof.

I rest my case.

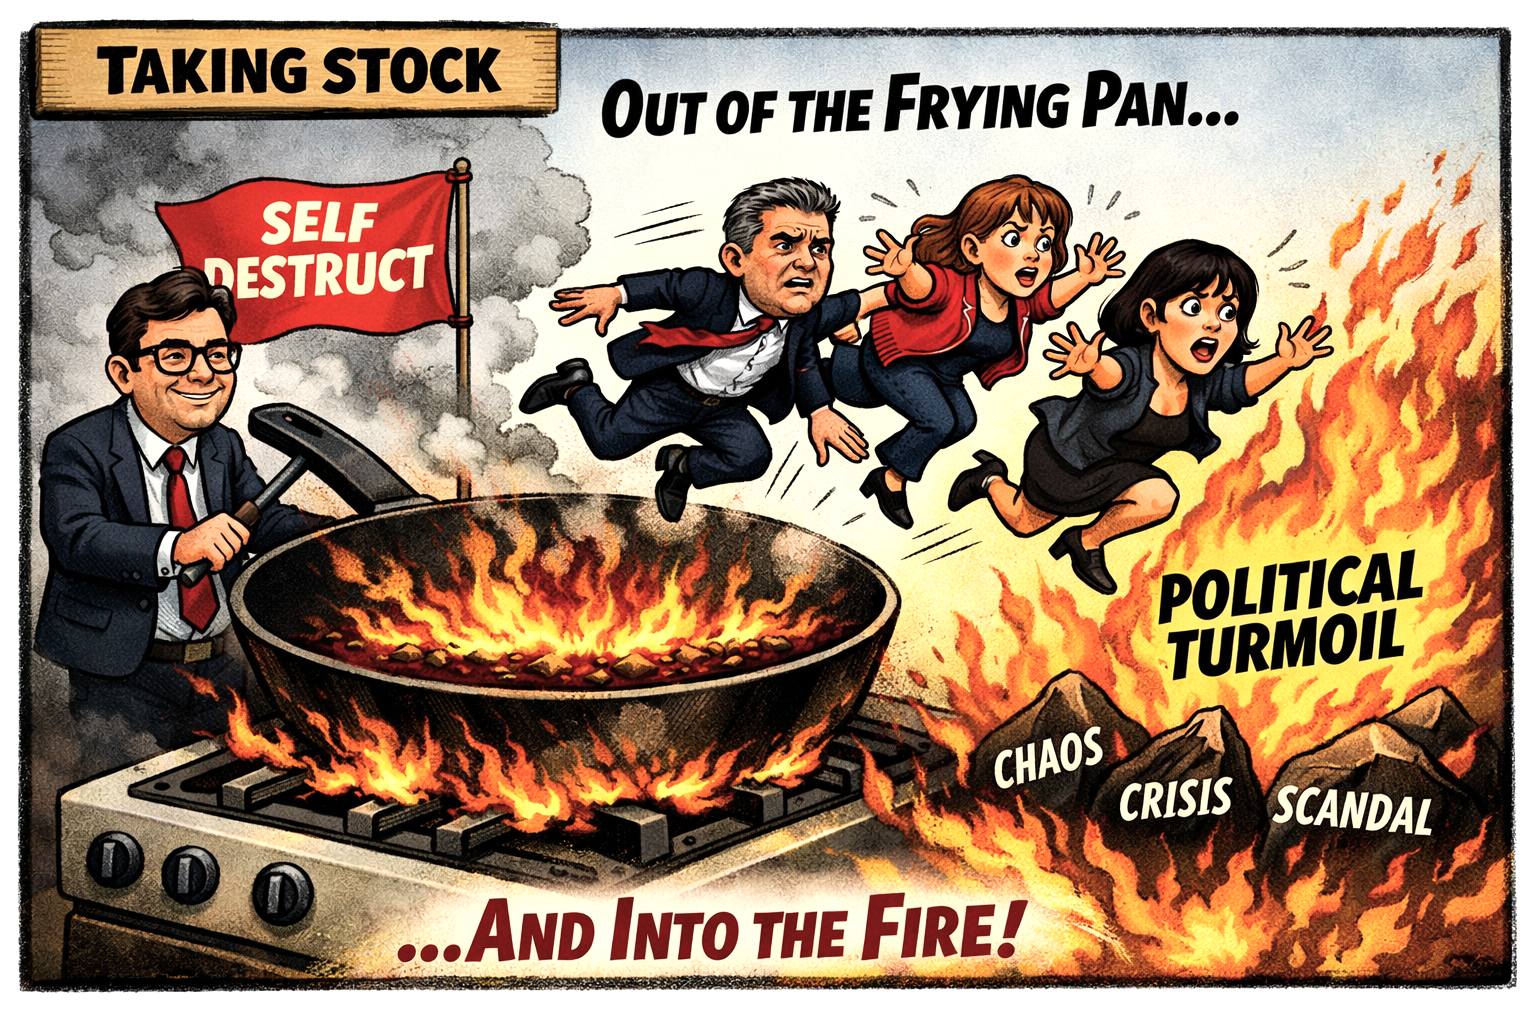
The self-destruct button is being pressed yet again…

UK politicians – it’s time to grow-up.

Definition of politician

A person who is professionally involved in politics, especially someone who holds or seeks public office in government.

More broadly, it refers to anyone who participates in governing, policy‑making, or political leadership at local, national, or international level.

Three words immediately jump out at me: professional, govern and leadership.

I see very little of any of these right now in our political ‘elite’.

Bank busting figures as profits pile up!

Banks' profits surge

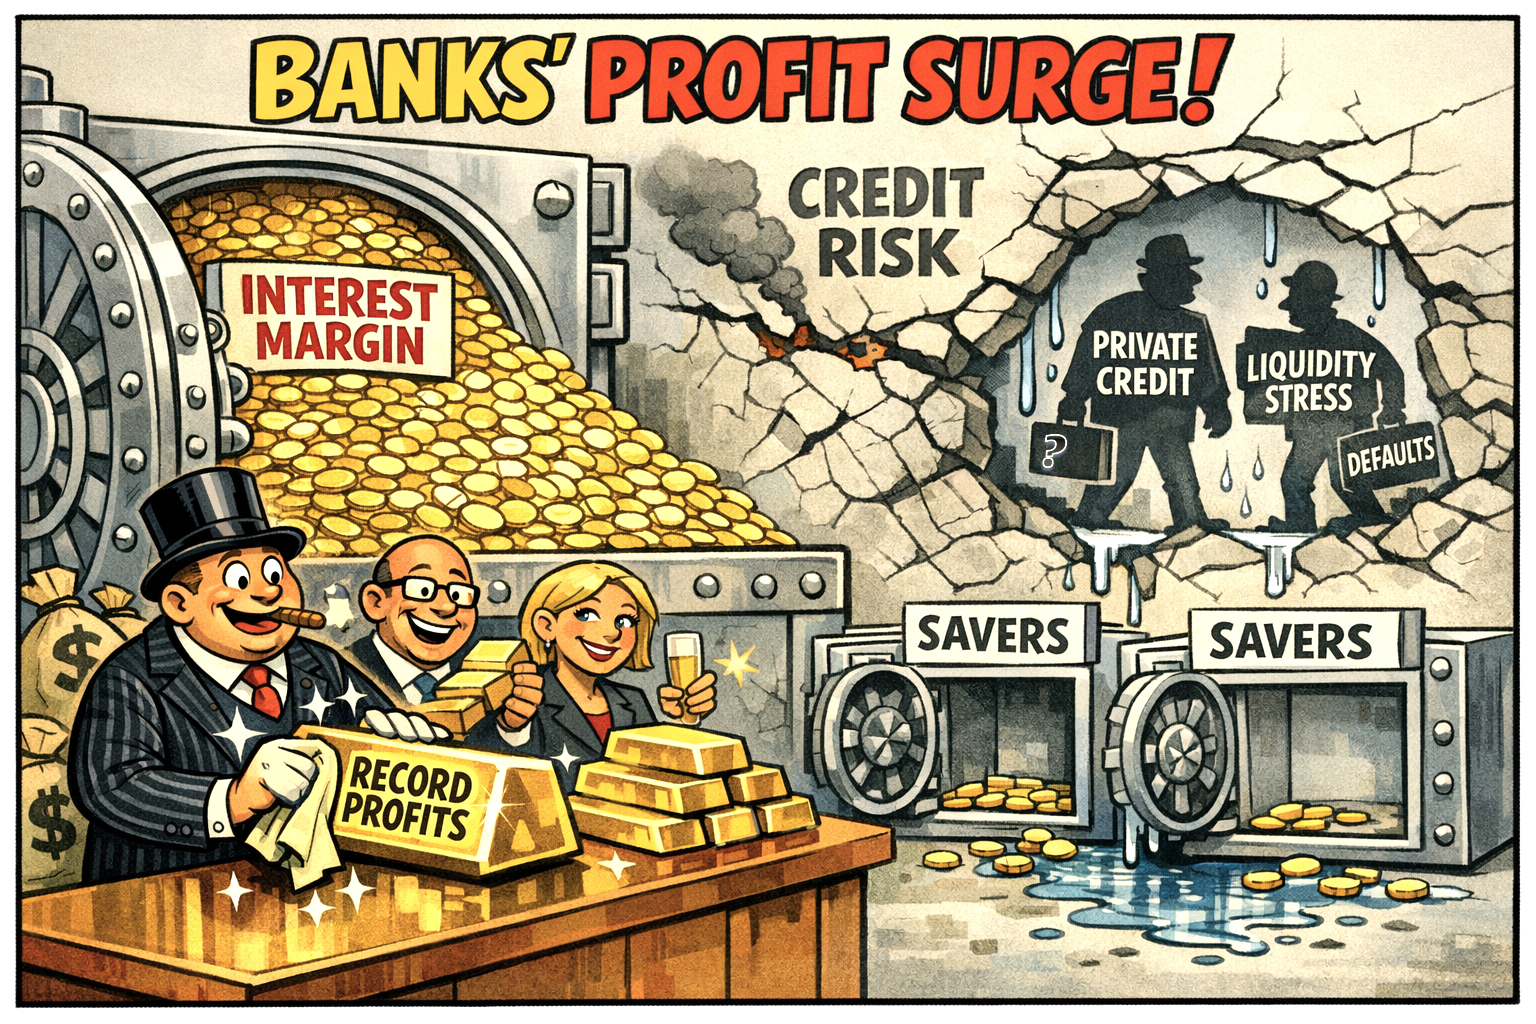
Banks are reporting unusually strong profits because higher interest rates have widened margins, while slow pass‑through to savers, cost‑cutting, and capital optimisation have amplified returns — even as credit risks begin to rise.

Why profits are so high

The latest figures show that UK banks are still benefiting from the long tail of the interest‑rate cycle.

Even though the Bank of England has not raised rates since August 2023, the base rate remains at 4.5%, allowing lenders to earn significantly more on mortgages and credit than they pay out on deposits.

This margin expansion has been the single biggest driver of profit growth. Research from recently highlighted from Positive Money shows that the UK’s four largest banks have generated £136.8 billion in pre‑tax profits since rate rises began in December 2021, and are on track to exceed their record £45.9 billion made in 2024 by around 14% in 2025.

A second factor is the government’s interest payments on central bank reserves. Because commercial banks are paid the base rate on their risk‑free deposits at the Bank of England, they stand to receive around £30 billion a year in transfers through to 2030 — effectively a public subsidy that boosts earnings without requiring additional lending.

Banks have also been aggressively returning capital to shareholders. Between 2022 and 2024, the big four spent £42 billion on dividends and £32 billion on share buybacks, reinforcing the perception that profits are being harvested rather than reinvested.

How banks are sustaining these profits

The profitability story is not just about rates. Structural shifts are helping banks defend margins even as the rate cycle turns.

1. Slow deposit repricing High Street banks have been reluctant to raise savings rates in line with market levels. As consumers move deposits to specialist lenders offering better returns, the big banks still retain a large, low‑cost funding base.

KPMG reportedly notes that high street banks’ share of deposits has only slipped from 84% in 2019 to 80% in 2024 — still dominant enough to preserve cheap funding.

2. Capital optimisation through securitisation Banks are increasingly using Significant Risk Transfer (SRT) securitisations to free up capital and improve return on equity. Securitised loan volumes have grown at a 4% CAGR between 2022 and 2025, allowing banks to recycle capital into higher‑yielding assets.

3. Cost discipline and digital transformation With margins expected to compress as rates eventually fall, banks are pushing cost‑cutting, automation, and AI‑driven process redesign.

KPMG reportedly forecasts sector‑wide returns on equity could fall from 18% in 2023 to 10% by 2027 without structural change — making efficiency programmes essential to sustaining profitability.

The emerging risk: impairments

Barclays’ latest results show rising credit impairment charges, including an £823 million provision linked to mortgage‑market stress and fraud‑related losses.

This raises the question of whether the credit cycle is turning. If impairments rise across the sector, the profit boom could fade.

The biggest emerging credit risks sit outside the banking system and that is private credit, leveraged borrowers, and liquidity mismatches that could spill back into banks.

Private credit is now large, interconnected, and showing signs of strain. Rising defaults, deteriorating loan quality, and withdrawal caps at major funds point to mounting stress. Defaults could climb sharply, with Morgan Stanley reportedly warning they may reach 8%, far above historical norms.

A second risk is liquidity pressure. Funds are restricting redemptions as investors rush for the exit, exposing the fragility of semi‑liquid structures.

Finally, contagion risk is growing because banks finance private‑credit funds and pipelines. As analysts note, deeper interconnections mean a downturn could transmit stress back into the regulated system.

Conclusion

Banks are reporting strong profits because the rate environment, public transfers, and capital strategies have created a uniquely favourable backdrop.

But the model is fragile: as impairments rise and rates eventually fall, the sector may be approaching the end of its profit‑supercycle.

UK Borrowing Falls, Offering Treasury Some Relief – March 2026

UK borrowing falls

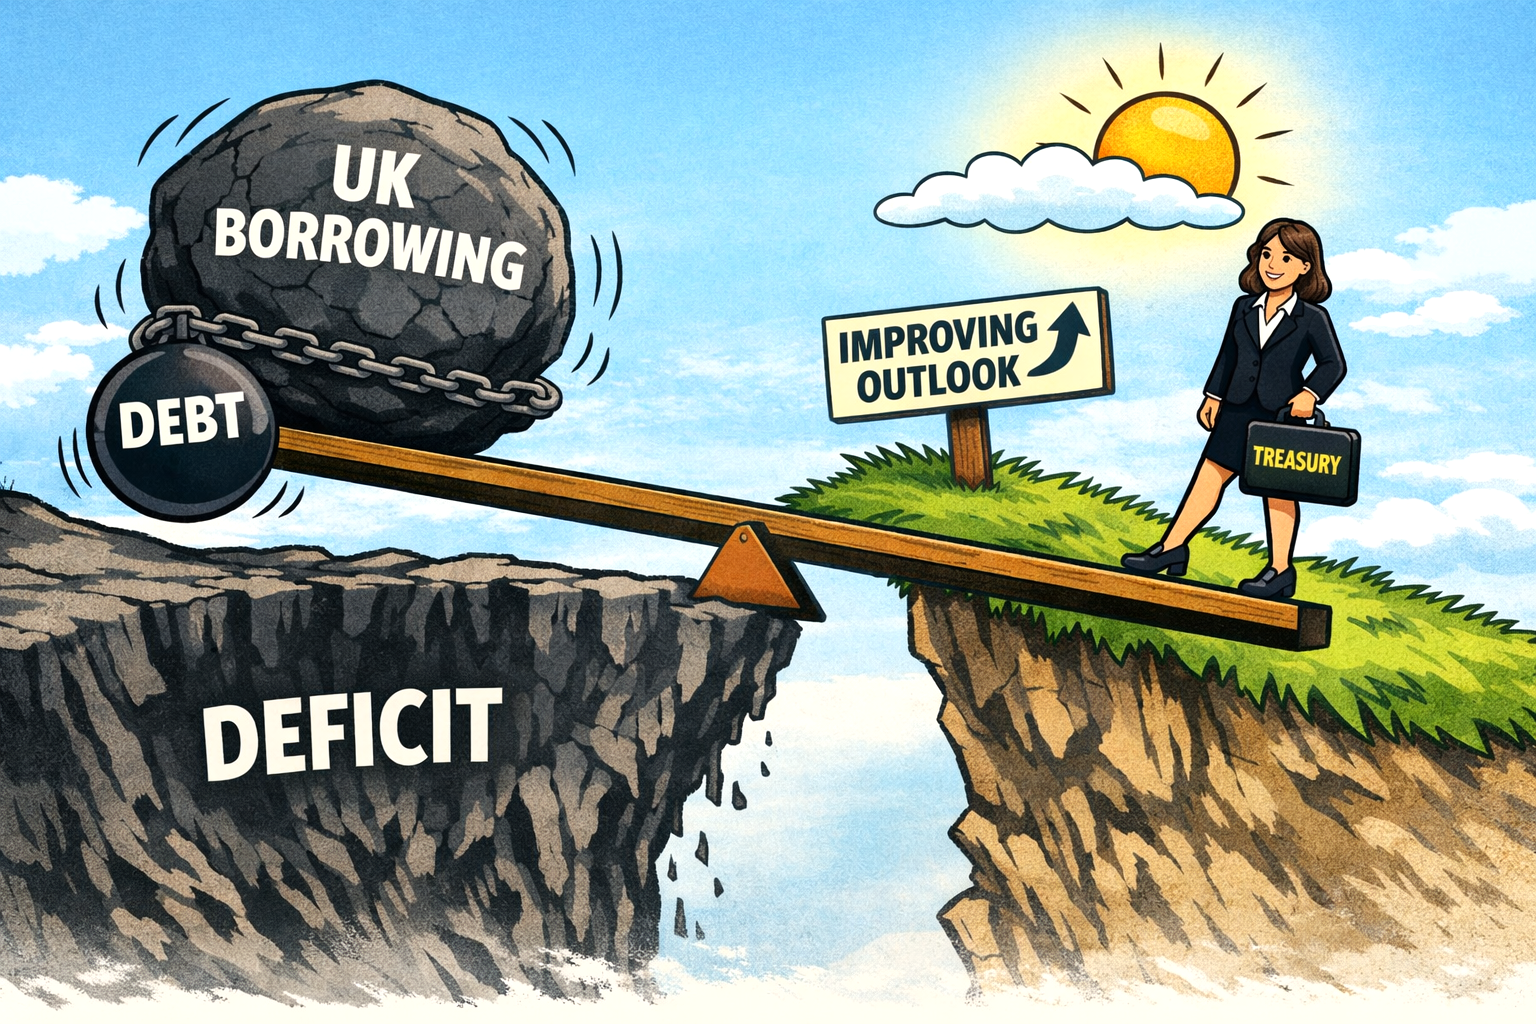
The latest public finance figures show that government borrowing has dropped to a lower‑than‑forecast level, helped by stronger tax receipts and easing inflationary pressures.

While the precise numbers will be scrutinised in the coming days, the headline outcome marks a modest but meaningful improvement in the UK’s fiscal position.

Softer inflation and lower interest rates

Analysts note that softer inflation has reduced the government’s debt‑interest bill, particularly on index‑linked gilts, which had surged during the inflation spike of the past two years.

The fall in borrowing also reflects a stabilising labour market and firmer wage growth, which have supported income‑tax and National Insurance receipts.

At the same time, lower market interest rates — driven by expectations of further Bank of England cuts after recent reductions to 3.75% — have eased short‑term financing costs for the Treasury.

High debt level

However, economists caution that the improvement should not be overstated. UK debt remains historically high, and pressures on public services, welfare spending, and capital investment persist.

Moreover, with growth still subdued and geopolitical risks keeping energy markets volatile, the fiscal outlook remains vulnerable to external shocks.

Even so, today’s figures provide the Chancellor with a welcome narrative shift: after years of deteriorating public finances, the government can point to early signs of stabilisation — albeit from a challenging starting point.

What the real data shows (ONS, published 23rd April 2026)

The latest ONS release confirms that UK government borrowing has indeed come in lower than expected, and the scale of the improvement is now clear:

  • Annual borrowing: £132.0 billion in the year to March 2026 — £19.8 billion lower than the previous year — £0.7 billion below the OBR forecast — Lowest level since 2022–23
  • March borrowing: £12.6 billion — £1.4 billion lower than March 2025 — Lowest March figure since 2022
  • Borrowing as % of GDP:4.3%, the lowest since 2019–20

The U.S./ Iran / Israel conflict with undoubtably hold the economy back as the effect has yet to fully filter through.

UK inflation rose to 3.3% in March 2026 as fuel prices spiked due to the ongoing U.S. Iran war

UK March inflation up to 3.3%

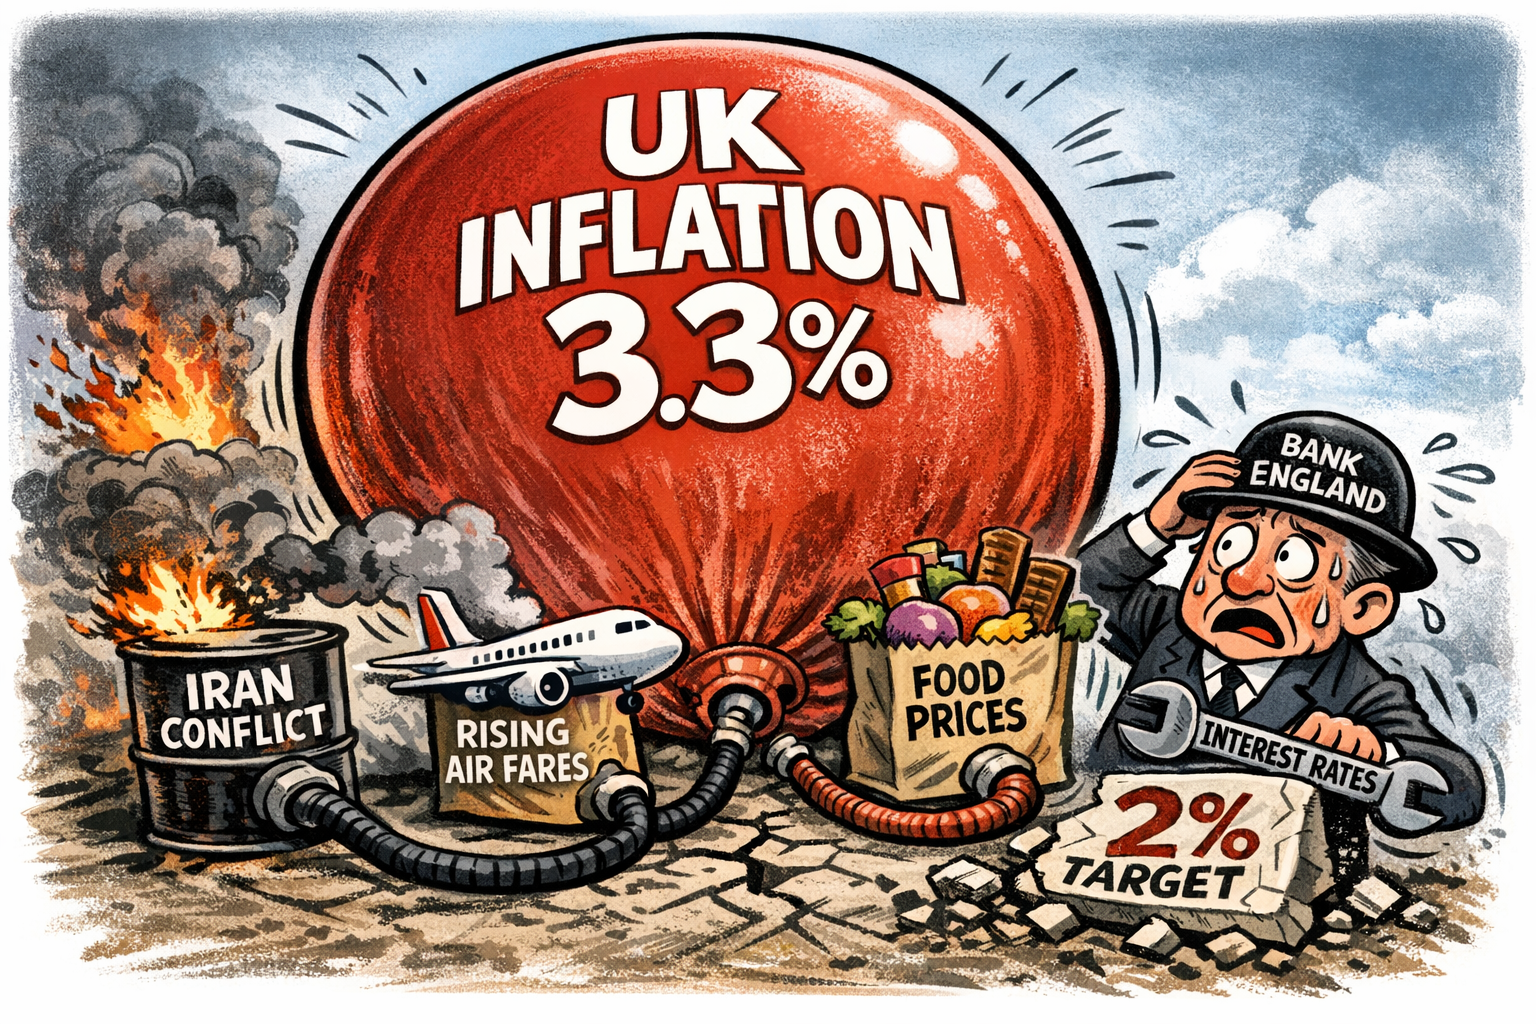
UK inflation jumped to 3.3% in March 2026, driven primarily by a sharp surge in fuel prices linked to the Iran conflict.

UK inflation accelerated to 3.3% in March 2026, up from 3% in February 2026, marking the first clear evidence of the Iran‑U.S. conflict feeding through to consumer prices.

Fuel costs

Official ONS data shows that motor fuel costs were the dominant driver, with petrol and diesel prices rising at their fastest pace in more than three years as global energy markets reacted to the disruption in the Strait of Hormuz.

Air fares

Air fares also rose sharply, partly due to the early Easter holidays, while food inflation picked up again, including notable increases in sweets and chocolate.

Clothing discounted

Clothing provided the only meaningful offset, with retailers discounting more heavily than last year.

The rise pushes inflation further from the Bank of England’s 2% target and complicates the policy outlook.

While economists expect UK inflation to ease slightly in April 2026, the broader risk is that sustained energy pressures could keep price growth elevated for longer.

UK Unemployment Rate Falls to 4.9% in Latest ONS Release

UK unemployment data

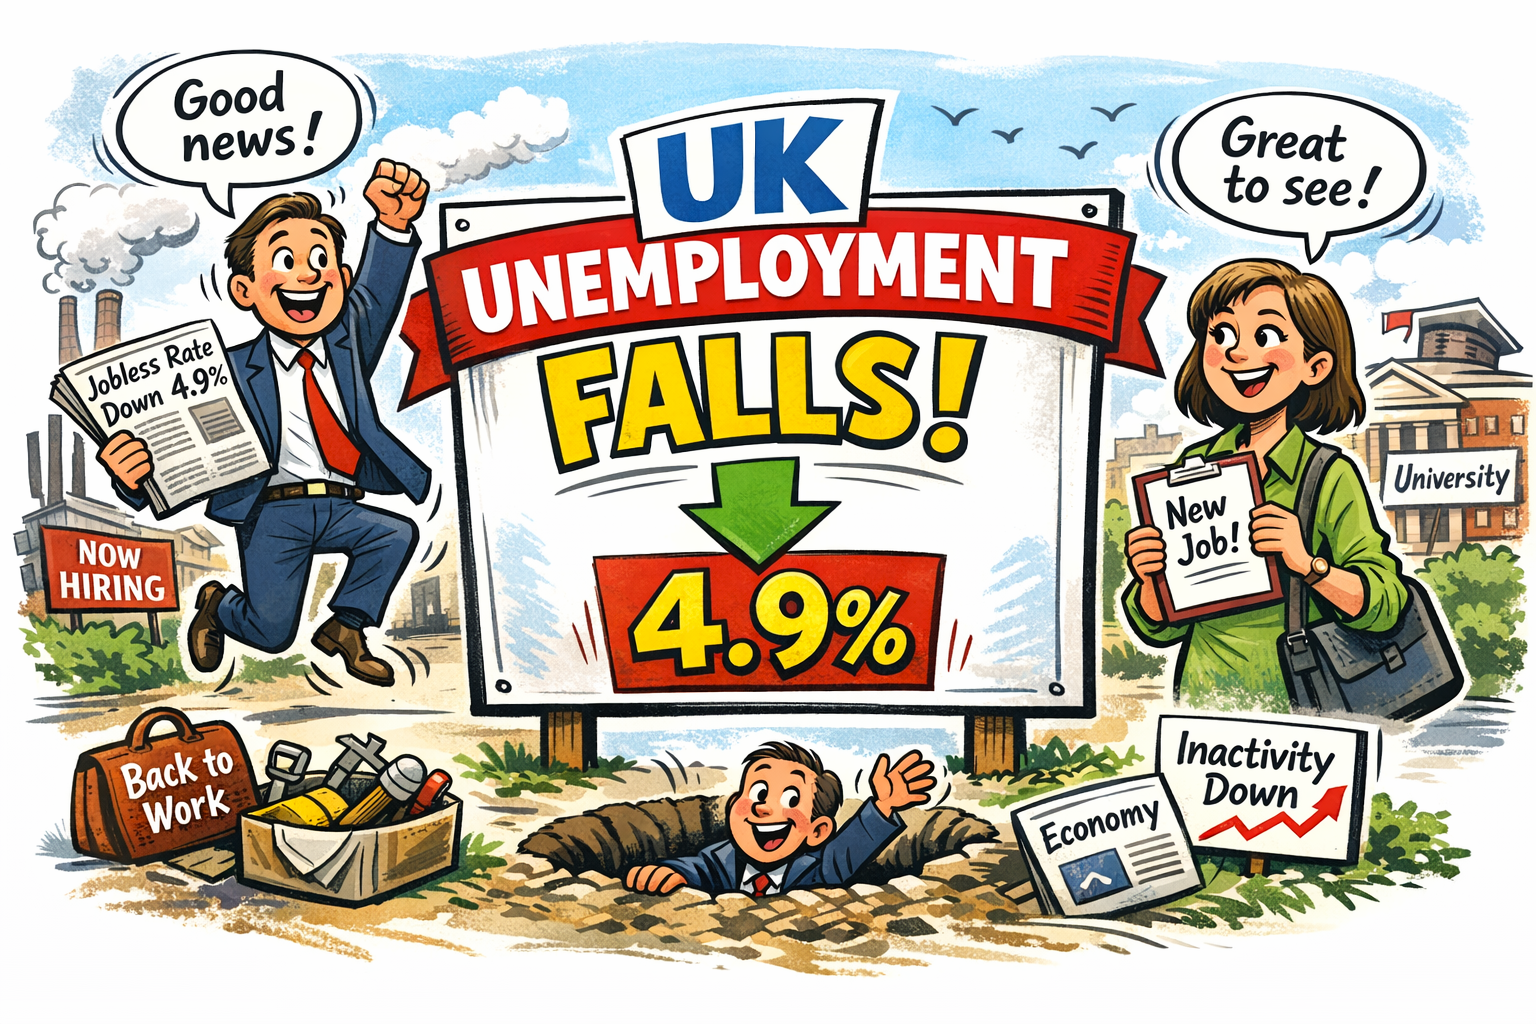
The UK unemployment rate has fallen to 4.9%, according to the latest figures from the Office for National Statistics (ONS), offering a rare moment of optimism in an otherwise unsettled economic landscape.

The data, covering the period from December 2025 to February 2026, shows a drop from 5.2% in the previous rolling quarter, marking the lowest level since mid‑2025.

Steady

Economists had broadly expected the rate to hold steady, making the improvement a mild but welcome surprise. The fall reflects a combination of rising employment in several service‑sector industries and a shift in the composition of the labour force.

Part of the decline, however, stems from an increase in economic inactivity, particularly among students and those temporarily stepping away from the workforce.

This means the headline figure flatters the underlying picture slightly, even if the direction of travel remains encouraging.

Easing wag growth

Wage growth continues to ease, and vacancies remain well below their post‑pandemic peak, suggesting the labour market is still cooling overall.

Yet the drop in unemployment provides the government with a positive data point to cling to at a time when households are grappling with high living costs and businesses are navigating weak demand.

For now, the labour market appears to be stabilising rather than sliding.

Note: this data was produced pre the U.S./Israel/Iran conflict.

The UK economy experienced faster-than-expected growth in the period leading up to the Iran war – February 2026

UK Growth of 0.5% in February 2026

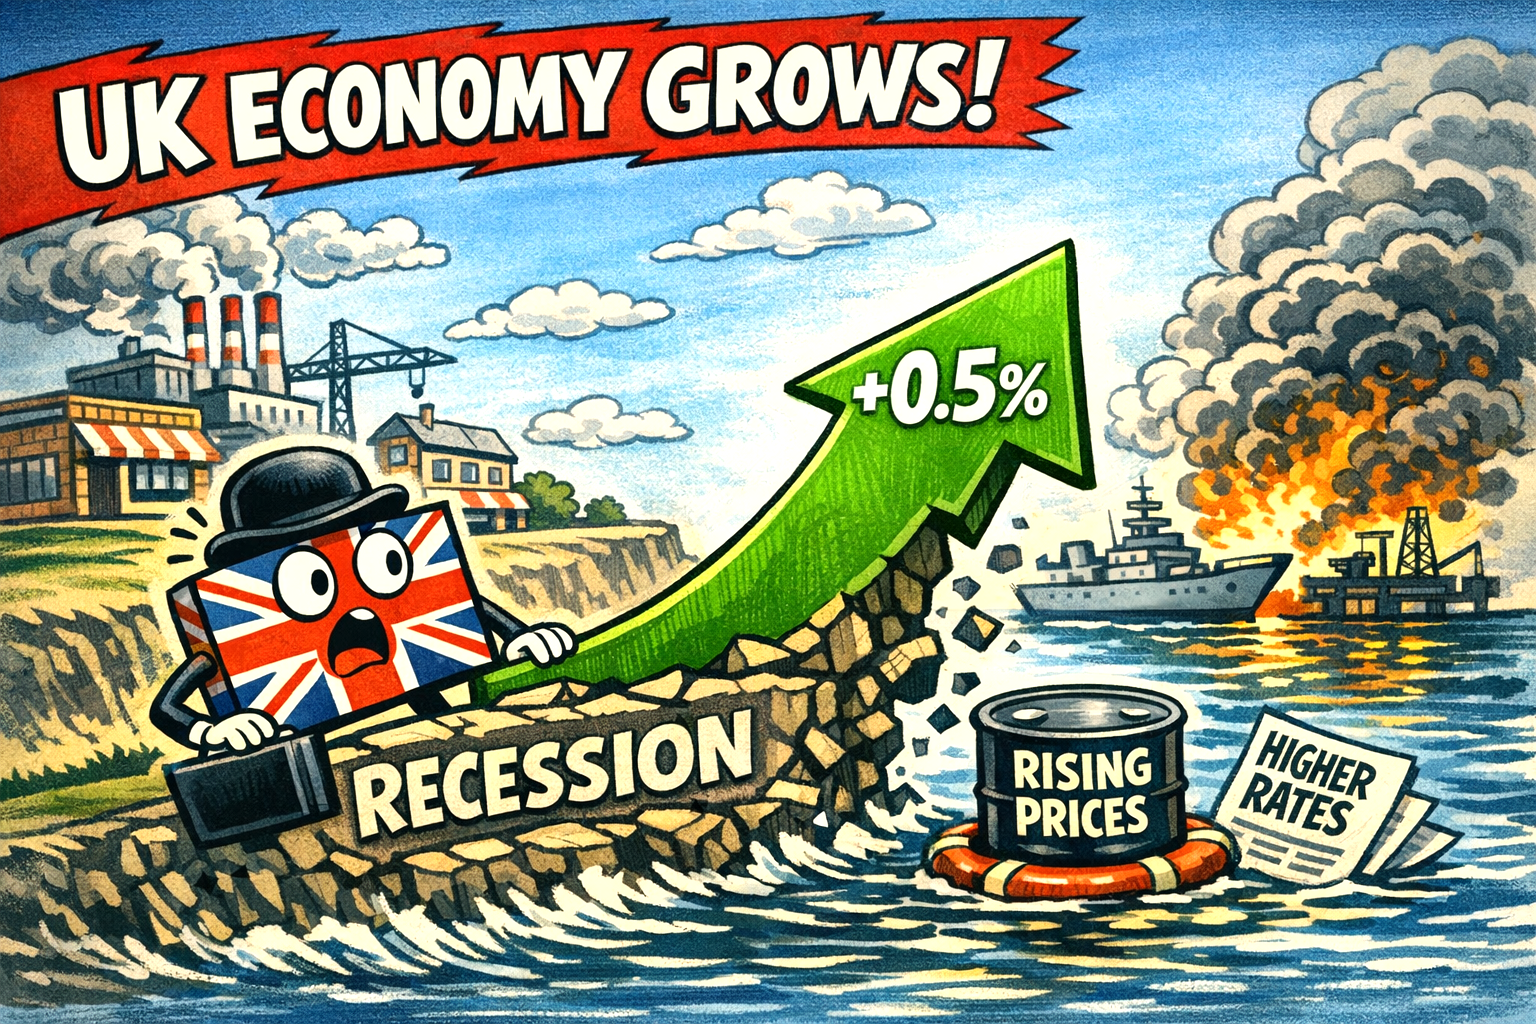
The ONS’s February 2026 figures delivered a rare upside surprise: UK GDP rose 0.5% month‑on‑month, the strongest expansion in more than two years and five times the consensus forecast of 0.1%.

How can forecasts be so wrong?

January2026 was also revised up to 0.1%, overturning the earlier flat reading. On the surface, this looks like the economy finally pulling out of its shallow recession.

In reality, it is a snapshot of momentum that has already been overtaken by events.

Services mani

The growth was broad‑based. Services, which make up over three‑quarters of the economy, expanded 0.5%, marking a fourth consecutive monthly rise.

Production also grew 0.5%, and construction jumped 1.0%. Even the three‑month measure—less noisy than monthly data—showed UK GDP up 0.5%, compared with 0.3% previously. This is the kind of balanced improvement policymakers have been waiting for.

But the timing matters. These numbers capture the economy before the U.S.-Israel-Iran conflict triggered a fresh energy shock at the end of February.

IMF downgrade

Since then, petrol, diesel and heating oil prices have surged, mortgage rates have ticked higher as markets price out rate cuts, and the IMF has downgraded the UK’s 2026 growth outlook to 0.8%.

So February’s strength is real—but it is also backward‑looking. The challenge now is whether any of that momentum survives the shock hitting households and firms this spring.

Why does the UK have a serious issue with jet fuel supply

UK jet fuel low

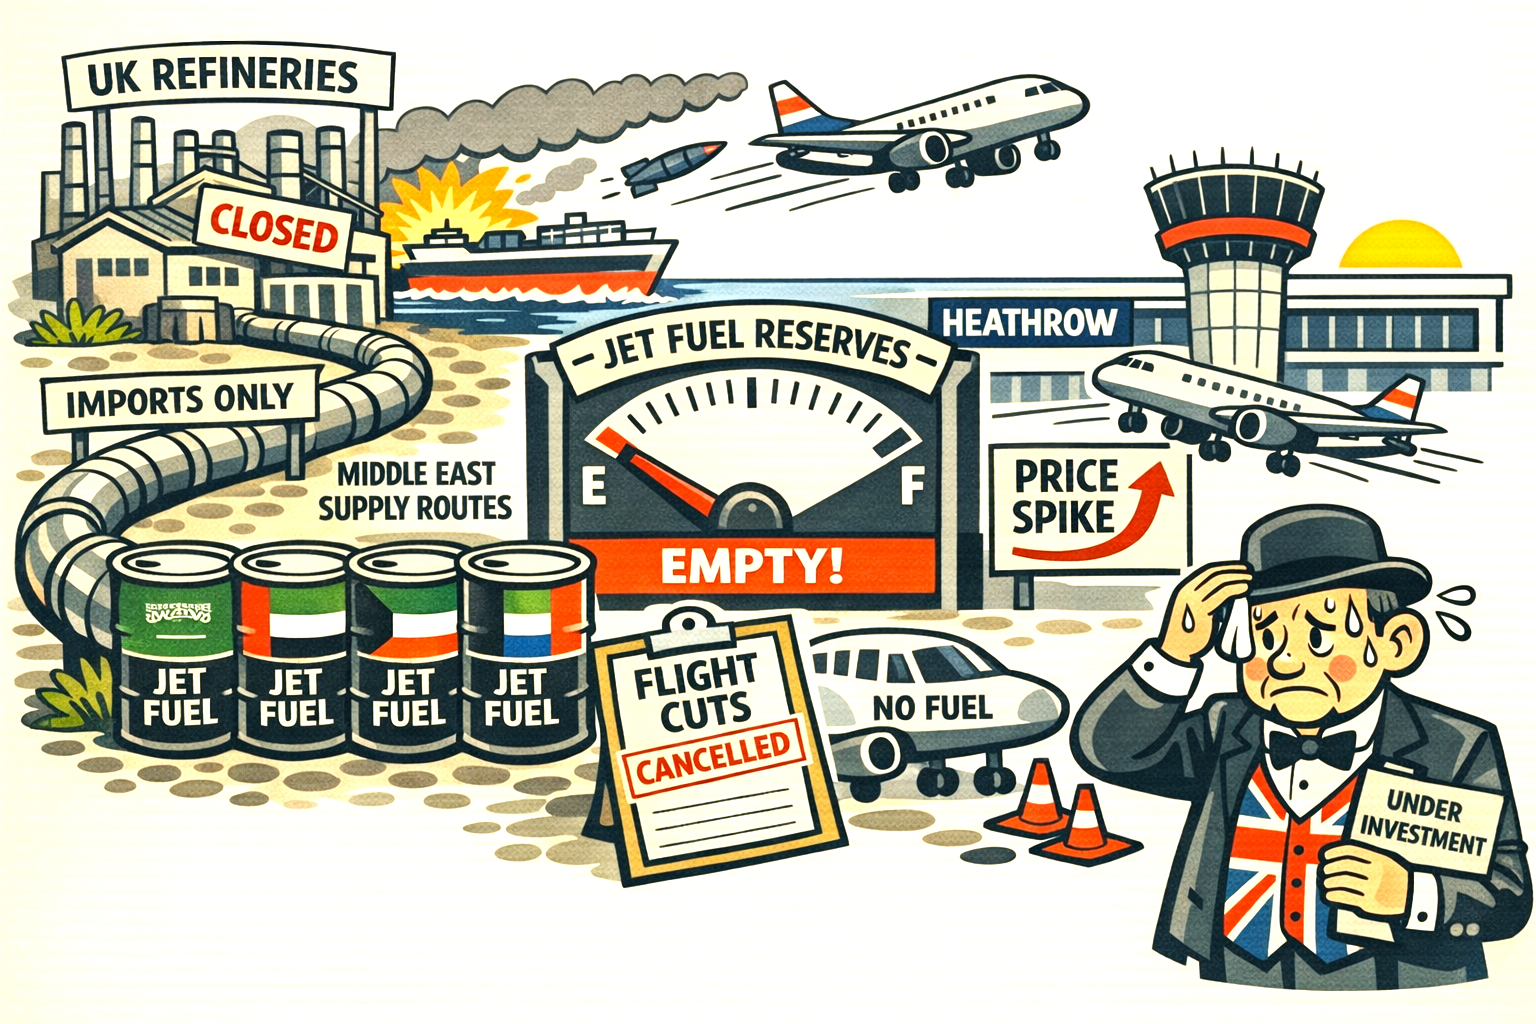
Britain’s jet fuel problem is the predictable result of a long, quiet erosion of refining capacity colliding with a geopolitical shock and decades of under investment.

The country now imports three times more kerosene than it produces, and the Middle East crisis has exposed just how thin those supply lines have become.

A system built on shrinking refineries

The UK once had 18 refineries; today it has just four. Closures at Lindsey and Grangemouth last year removed two critical plants, including Scotland’s only kerosene supplier.

The remaining refineries — Fawley, Humber, Pembroke and Stanlow — supply most domestic needs but cannot meet jet fuel demand.

Output has fallen 41% since 2000, driven by poor investment returns, high carbon costs, and the government’s push toward electrification reducing demand for other fuels.

This leaves Britain structurally dependent on imports for diesel and, crucially, kerosene.

The kerosene dependency

Jet fuel demand is unusually high because of Heathrow’s role as a global hub. In 2024, the UK was the second‑largest jet fuel consumer in the OECD, behind only the U.S.

Yet domestic production covers only a fraction of that. Britain reportedly imported around 3.1 times more kerosene than it produced in 2024.

And the sources of those imports are concentrated: 60% come from Saudi Arabia, the UAE and Kuwait, making the UK acutely exposed to any disruption in the Strait of Hormuz.

The real vulnerability: almost no stockpiles

Britain holds just one month’s worth of jet fuel reserves, far lower than most advanced economies. When Middle Eastern supply is threatened, the UK has no buffer.

European alternatives exist — notably the Netherlands and Antwerp — but prices have already doubled, and airlines are preparing to cut capacity.

The bigger picture

This is not a sudden crisis but the culmination of two decades of under‑investment, policy drift and over‑reliance on global markets.

Jet fuel is simply the first commodity where the structural weakness has become impossible to ignore.

The UK needs to get a grip!

A ‘systemic’ jet fuel shortage is brewing in Europe if the U.S. led Iran war crisis isn’t resolved soon.

UK economy will be hit hardest by the U.S.-Israel Iran war warns the IMF

UK Economy damaged by U.S. Iran War

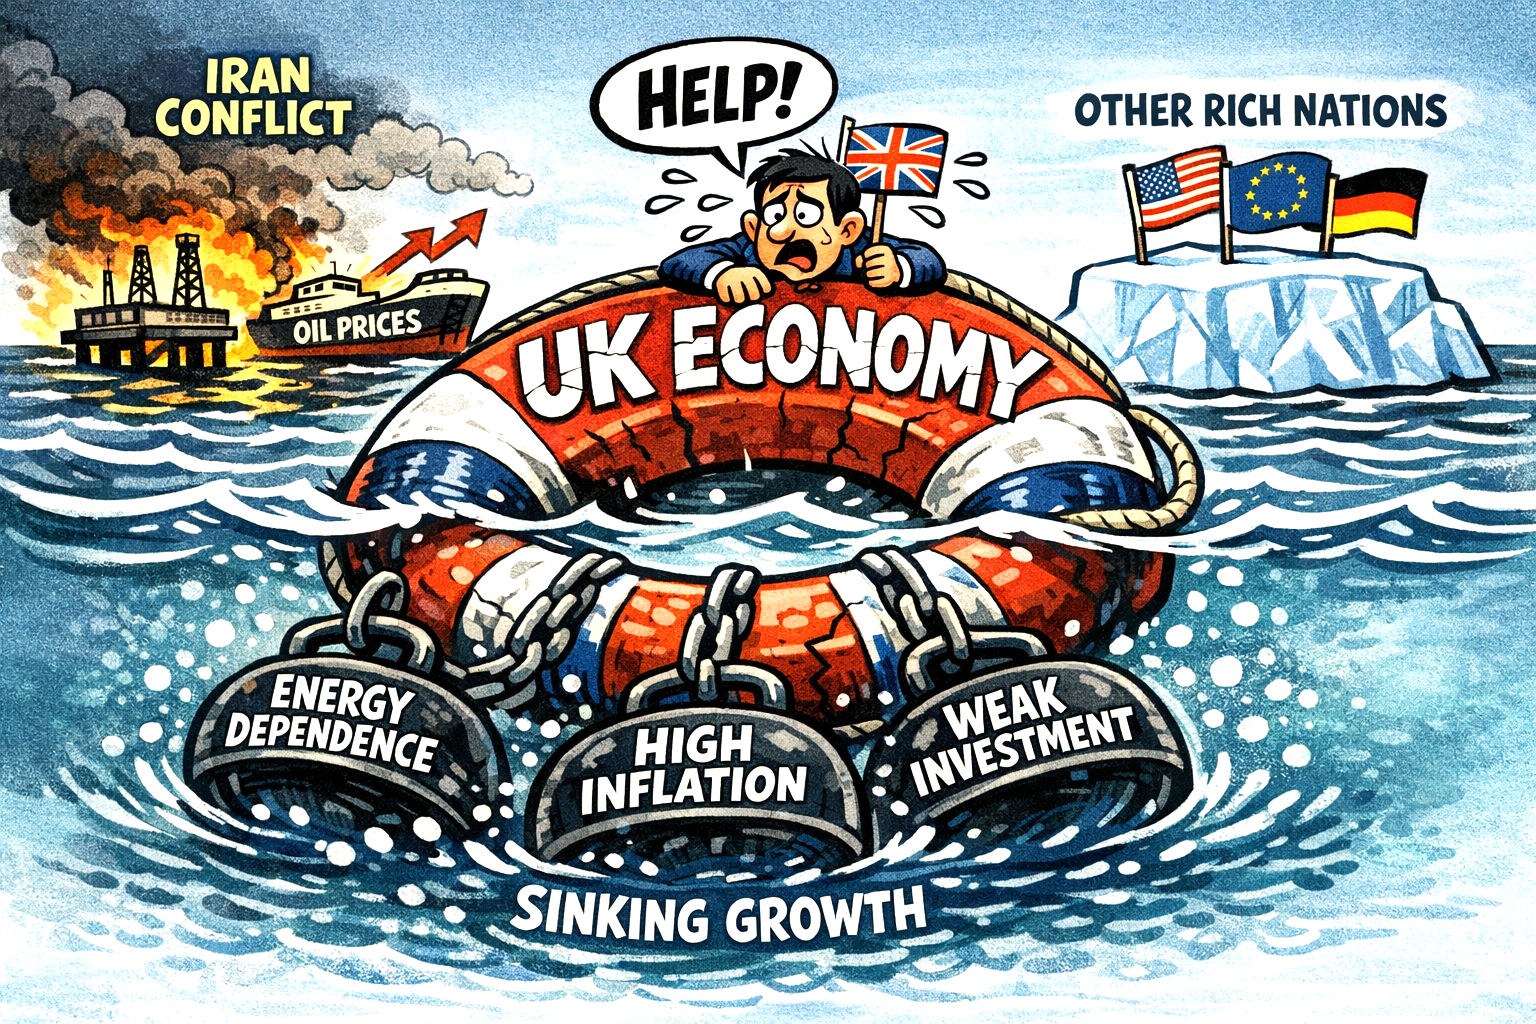
The IMF’s warning that the UK would suffer the sharpest growth hit among rich economies from an Iran‑related war is rooted in a simple structural reality.

Britain is unusually exposed to energy‑price shocks, yet unusually weak in the buffers that normally absorb them according to the IMF.

Why the UK will be hit harder than its peers

The UK enters this crisis with three vulnerabilities

  • High dependence on imported energy. North Sea output has declined for years, leaving Britain reliant on global LNG markets. When Middle Eastern supply is disrupted, LNG prices spike first and hardest. The U.S. and eurozone have deeper domestic energy bases or cheaper pipeline access.
  • A structurally fragile inflation profile. The UK’s inflation has been stickier than that of other G7 economies, driven by food, energy and services. A renewed oil shock feeds directly into household bills and transport costs, forcing the Bank of England to keep rates higher for longer.
  • Weak productivity and stagnant investment. Britain has less momentum to absorb an external shock. When energy prices rise, UK firms cut back faster, and consumers retrench more sharply.
  • UK Government policy. Ed Miliband and his ‘likely’ misguided staunch defence of Net Zero policies and expensive energy costs have left the UK seriously exposed to shocks – such as this.

The IMF’s logic

The Fund argues that a prolonged disruption in the Strait of Hormuz would push global oil prices sharply higher.

For the UK, this translates into

  • Higher wholesale gas costs, because LNG markets reprice off oil‑linked benchmarks.
  • A renewed inflation surge, delaying rate cuts and tightening financial conditions.
  • A squeeze on real incomes, hitting consumption—the UK’s main growth engine.
  • A fall in business investment, already one of the weakest in the OECD.

The IMF’s modelling suggests that the UK’s growth rate could fall more steeply than that of the U.S., Germany or France because those economies either have stronger industrial bases, more resilient energy systems or more fiscal space to cushion the blow.

The broader picture

This is less about geopolitics and more about structural brittleness. A global energy shock exposes the UK’s unresolved weaknesses: high import dependence, fragile inflation dynamics and a decade of under‑investment.

Iran’s 2026 Energy Crises: Echoes of the 1970s in a New Era of Risk

U.S. Israel Iran War 2026

The 1970s crises were triggered by political embargoes and revolution, causing sharp but smaller supply cuts and extreme price spikes.

Today’s crisis is driven by war, infrastructure attacks, and the near‑closure of the Strait of Hormuz, producing a larger supply disruption, though price rises so far have been less extreme.

Energy shock

The energy shocks of the 1970s remain some of the most disruptive economic events of the modern age. Triggered first by an embargo and later by revolution, they exposed how deeply the global economy depended on Middle Eastern oil.

Half a century later, Iran still sits at the centre of global energy anxiety — but the nature of the threat has shifted.

The world is no longer facing an outright supply collapse, yet the structural vulnerabilities that defined the 1970s have not disappeared. They have simply evolved.

Yom Kippur War

The first major shock came in 1973, when Arab oil producers cut exports to countries supporting Israel during the Yom Kippur War.

The result was a sudden loss of roughly seven per cent of global supply. Prices quadrupled, queues formed at petrol stations, and governments imposed rationing, car‑free days, and speed‑limit reductions.

The economic fallout was severe: inflation surged while growth stalled, creating the era‑defining condition of stagflation.

A second blow followed in 1979, when the Iranian Revolution removed millions of barrels per day from the market. Prices tripled once again, and the world was forced to confront the fragility of its energy systems.

IEA

The International Energy Agency was created in direct response, tasked with coordinating emergency measures and strategic reserves.

These two crises set the benchmark for what an energy shock looks like — sudden, sharp, and globally destabilising.

Today’s risks are different. The world is not experiencing a supply loss on the scale of the 1970s, but the potential for disruption remains high.

Strait of Hormuz

The Strait of Hormuz, through which around a fifth of global oil flows, is a strategic chokepoint vulnerable to conflict, tanker seizures, and infrastructure attacks.

Iran has repeatedly threatened to close or disrupt the strait during periods of tension, and even limited incidents in recent years have pushed prices higher.

Markets remain acutely sensitive to any sign that the corridor could be compromised.

Diverse energy

Unlike the 1970s, modern economies have more diversified energy systems, larger strategic reserves, and a growing share of renewables.

Yet these advantages do not eliminate risk; they merely soften it. A serious disruption in the Gulf would still send shockwaves through global markets.

The comparison between then and now is not one of scale but of structure. The 1970s showed how quickly energy can become a lever of geopolitical power.

Today’s world is more resilient, but no less exposed. The lesson endures: when a single region holds the key to global supply, the world remains only one crisis away from another shock.

We also need to ask – how and why this happened again!

What’s your answer?

How the crises affected the UK in the 1970s

The 1970s energy crisis had a profound and lasting impact on the United Kingdom, reshaping its economy, politics, and industrial relations.

When global oil prices quadrupled after the 1973 OPEC embargo, Britain was already struggling with domestic energy tensions.

Coal remained the backbone of electricity generation, and the miners’ dispute with Edward Heath’s government over pay and working conditions collided with the global fuel shock.

As coal output fell and oil costs soared, the government-imposed emergency measures — most famously the Three‑Day Week in early 1974, limiting commercial electricity use to conserve power. It led to the Winter of Discontent.

Power Cuts

Factories shut down, television broadcasts ended early, and households faced rolling power cuts. Inflation surged, unemployment rose, and the economy slowed sharply.

The crisis deepened public frustration with the Conservative government, contributing to Heath’s defeat in the February 1974 general election.

Trade Union Turmoil

The turmoil also strengthened trade unions, whose strikes became a defining feature of the decade.

By the late 1970s, another oil shock — triggered by the Iranian Revolution — compounded Britain’s economic malaise, leading to the “Winter of Discontent” and paving the way for Margaret Thatcher’s election in 1979.

In short, the 1970s energy crisis exposed Britain’s dependence on imported fuel and unstable domestic supply, ushering in years of inflation, industrial unrest, and political upheaval that reshaped the country’s economic direction for decades.

Arm’s Bold Pivot: The AGI CPU Signals a New Era for British Chipmaking

ARM Agentic AI CPU

ARM has triggered one of the most dramatic shifts in its 35‑year history with the launch of its first in‑house data‑centre processor, the AGI CPU — a move that sent its shares surging 16% and reshaped expectations for the company’s future.

Long known for licensing energy‑efficient chip designs to the world’s biggest tech firms, ARM is now stepping directly into the silicon market, competing with the very customers that built its empire.

Major Tech Firms Using Arm Designs (AI & Mobile)

CompanyPrimary Use CaseArm-Based Technology
AppleMobile & on‑device AIA‑series (iPhone/iPad) and M‑series (Mac) chips
SamsungMobile, AI, IoTExynos processors
QualcommMobile & automotive AISnapdragon SoCs
GoogleAndroid ecosystem & edge AIPixel phones (Arm cores inside Tensor chips)
Amazon (AWS)Cloud compute & AI inferenceGraviton & Trainium/Inferentia (Arm Neoverse)
MetaAI infrastructureDeploying Arm-based AGI CPU
OpenAIAI inference & orchestrationEarly adopter of Arm AGI CPU
NvidiaAI data‑centre CPUsGrace CPU (Arm architecture)
OPPOMobile AIArm-based SoCs in Find series
vivoMobile AIArm-based SoCs in X‑series

Strong demand

The new AGI CPU is engineered for the rapidly expanding world of AI inference and agentic AI — workloads that demand vast CPU coordination rather than pure GPU horsepower.

Early demand appears strong. Meta has signed on as the first major customer, with OpenAI, Cloudflare and SAP also adopting the chip as they race to expand their AI infrastructure.

The financial implications are striking. ARM expects the AGI CPU alone to generate $15 billion in annual revenue by 2031, a figure that dwarfs the company’s 2025 revenue of $4 billion.

Significant shift

Analysts have described the announcement as the most significant strategic shift ARM has ever undertaken, noting that the revenue projections exceed even the most optimistic market estimates.

By moving into full chip production, ARM is broadening its market to include companies that previously had no interest in its traditional IP‑licensing model.

Executives say the chip will be competitively priced, offering an alternative for firms unable to build their own custom silicon.

For the UK, the launch marks a rare moment of industrial ambition in a sector dominated by American and Asian giants.

If ARM’s forecasts hold, the AGI CPU could become one of the most commercially successful chips ever produced by a British company — and a defining pillar of the AI age.

See more here about the new ARM AGI CPU

Steady February 2026 UK Inflation Masks Rising Risks from Iran Conflict

UK inflation before war shock filters through

The UK’s inflation rate remained unchanged at 3% in February, according to the latest figures from the Office for National Statistics.

After months of gradual easing, the pause reflects a delicate moment for the UK economy, with price pressures beginning to shift beneath the surface.

Clothing was the biggest upward driver, with prices rising this year after falling during the same period in 2025.

This was offset by cheaper petrol, though those figures were captured before the recent surge in global oil prices triggered by the outbreak of war involving Iran.

While inflation is far below the peaks seen a few years ago, households are still contending with the reality that prices continue to rise—just more slowly.

ONS data

The ONS also introduced supermarket scanner data for the first time, offering a more accurate picture of food costs.

Economists warn that the conflict‑driven spike in oil and gas prices could push inflation higher again later in the year, with some forecasts suggesting a potential rise towards 4.6%.

Businesses already reliant on fuel, such as regional bus operators, report steep cost increases that may soon feed through to consumers.

The government insists it is working to ease cost‑of‑living pressures, though global events may limit its room for manoeuvre.

Bank of England Holds Rates at 3.75% as Gulf Tensions Cloud the Outlook

BoE Interest Rate

The Bank of England has held interest rates at 3.75%, opting for caution as the economic shock from the escalating conflict involving Iran ripples through global energy markets.

The Monetary Policy Committee delivered a unanimous vote to pause, a notable shift from earlier in the year when a spring rate cut had seemed almost inevitable.

The Bank now expects inflation to rise again in the coming months, potentially reaching 3.5% as higher oil and gas prices feed through to fuel, household energy bills, and business costs.

Governor Andrew Bailey reportedly stressed that monetary policy cannot counteract a supply‑side shock of this nature, warning that the path of inflation will depend heavily on how quickly safe shipping routes through the Strait of Hormuz can be restored.

For households, the hold means no immediate relief on borrowing costs. Fixed‑rate mortgage deals have already been drifting higher as lenders price in the possibility of prolonged instability.

Some brokers report a surge in “panic buying” of mortgages as borrowers rush to lock in rates before they climb further. Savers, meanwhile, may see modestly improved offers, though competition remains muted.

Up or down?

The key question now is whether the next move is up or down. Before the conflict, markets had pencilled in two rate cuts for 2026.

That expectation has evaporated. Traders now see a non‑trivial chance of a rise to 4% later in the year, though economists caution that weak growth and a softening labour market could still restrain the Bank from tightening unless inflation accelerates sharply.

Over the next six weeks, policymakers will be watching energy prices, shipping conditions, and wage data closely.

For now, the Bank has chosen to wait, watch, and hope the shock proves temporary — but the margin for error is narrowing.

The Market’s Coiled Spring: Why Ultra‑Tight Ranges Rarely End Quietly

Coiled spring - pure stock market energy

Markets rarely sit still without reason. When they do — as they have in recent sessions, grinding sideways in an ultra‑tight range — it signals not calm but compression.

Price action becomes like a coiled spring: energy building, tension rising, and traders waiting for the moment when restraint snaps into motion.

This week’s narrow trading bands reflect a market holding its breath. Geopolitical tension in the Middle East, oil volatility, and a Federal Reserve decision all loom over investors, yet equities have refused to break down.

Futures are edging higher, European indices are opening firmer, and even the tech wobble — with Nvidia’s muted reaction to its latest showcase — hasn’t derailed broader sentiment

Tight range – a waiting game.

Historically, such tight ranges rarely resolve with a whimper. When volatility is suppressed for too long, the eventual breakout tends to be sharp and directional. The question, of course, is which way.

Right now, the evidence suggests upward. Markets have absorbed war‑driven oil swings, shrugged off hedge‑fund losses, and continued to find buyers on dips.

Breadth is stabilising, and risk appetite — surprisingly resilient given the backdrop — is creeping back into European and Asian sessions.

That doesn’t guarantee a bullish surge, but it does suggest the path of least resistance is higher.

Fed tone

If the Fed avoids surprising investors and signals comfort with the current trajectory, the spring is more likely to uncoil to the upside.

A dovish‑leaning tone could ignite a breakout as sidelined capital rushes back into equities. Conversely, a hawkish shock would release the same stored energy — but violently downward.

The market is coiled. The catalyst is imminent. And when the range finally breaks, it won’t be subtle.

You know, it almost doesn’t matter what disasters are ongoing in the world – the stock market just wants to win and go up!

Just how bad does it have to be before the stock market corrects? And what will be the catalyst to make that happen?

Debt, credit concerns, geopolitical tension, political scandal, Epstein, a rogue nuclear attack, AI failure, war or just another Trump tariff scenario?

Who knows? And does anybody really care as long as ‘making money’ isn’t interrupted.

UK growth grinds to a halt – January GDP stagnates

UK economy GDP almost at a standstill

The latest batch of UK data landed on Friday 13th 2026 and painted a picture of an economy still struggling to regain momentum. January 2026 GDP came in flat, with the ONS reporting 0.0% growth for the month.

After slipping into a shallow recession at the end of last year, the economy has yet to show convincing signs of recovery.

The stagnation was driven in part by weaker discretionary spending, particularly on eating out, as households continued to rein in non‑essential purchases.

Oil price volatility

While not a formal data release, global energy volatility remains a defining backdrop. Oil markets swung sharply as tensions surrounding the Iran conflict intensified, feeding directly into UK inflation expectations.

Higher wholesale energy prices continue to complicate the Bank of England’s path toward easing, and markets remain sensitive to any sign that geopolitical risk may spill over into domestic costs.

The ONS also confirmed its annual update to the inflation basket, a technical change that nonetheless shapes how price pressures are measured.

New additions such as alcohol‑free beer and pet grooming services reflect shifting consumer behaviour, while other items have been removed or reweighted.

These adjustments won’t move the headline rate dramatically, but they do offer a useful snapshot of how UK households are spending in 2026.

Prediction markets challenged and new UK bank note design

Beyond the data, regulatory and policy stories added texture to the week. A debate over prediction market oversight intensified after reports of increasingly “gruesome” war‑related bets, raising questions about the boundaries of financial speculation.

Meanwhile, the ongoing redesign of UK banknotes continued to attract public interest, underscoring the symbolic weight of currency at a time of economic uncertainty.

Taken together, Friday 13th’s updates reinforce a familiar theme: the UK economy is edging forward, but with little momentum and plenty of external headwinds.

THE WIDER FALLOUT: How a Prolonged U.S.–Iran War Radiates Through the Global Economy

War in Iran Global Fallout Effects

If the U.S.–Iran conflict drags on for weeks or months, the global impact will extend far beyond oil markets. Energy prices are only the first domino.

The deeper, more destabilising effects emerge through shipping disruption, fertiliser shortages, food‑price inflation, financial volatility, cyber escalation, and regional political instability.

For the UK — already wrestling with structural food‑system fragility — the conflict becomes a real‑world stress test.

This report outlines 15 potential major knock‑on effects that would shape the global economy if the conflict becomes protracted.

1. Global Shipping Disruption

The Strait of Hormuz is not just an oil artery; it is a global shipping chokepoint. As vessels reroute or halt operations:

  • Container shipping delays spread across Asia, Europe and the Gulf.
  • War‑risk insurance premiums spike for all vessels.
  • Freight costs rise, feeding into non‑energy inflation.

This is the mechanism by which a regional conflict becomes a global economic event.

2. Aviation and Travel Disruption

Iranian retaliation has already included strikes on Gulf airports and hotels. If this continues:

  • Airlines reroute or cancel flights across the Gulf, South Asia and East Africa.
  • Longer flight paths increase fuel burn and fares.
  • Tourism in the UAE, Oman, Bahrain and potentially Turkey contracts sharply.

Aviation is one of the fastest channels through which geopolitical instability hits consumers.

3. Financial Market Volatility

Markets dislike uncertainty, and this conflict delivers it in abundance.

  • Investors flee to gold, the dollar and U.S. Treasuries.
  • Emerging markets face capital outflows.
  • Equity volatility rises in shipping, aviation and manufacturing sectors.

The longer the conflict persists, the more entrenched this volatility becomes.

4. Fertiliser Disruption: The Hidden Trigger

Over one‑third of global fertiliser trade moves through the Strait of Hormuz. With shipments stranded:

  • Urea, ammonia, phosphates and sulphur prices surge.
  • Farmers worldwide face higher input costs.
  • Lower fertiliser availability leads to reduced crop yields.

This is the beginning of a food‑system shock that unfolds over months, not days.

5. Global Food‑Price Inflation

As fertiliser shortages ripple through agriculture:

  • Wheat, rice, maize and oilseed yields fall.
  • Livestock feed becomes more expensive, pushing up meat, dairy and egg prices.
  • Food‑importing regions face acute pressure.
  • Grain futures markets become more volatile.

This is how a conflict becomes a global cost‑of‑living crisis.

UK Exposure

The UK is particularly vulnerable because:

  • It imports a large share of its fertiliser and food.
  • Its agricultural sector is energy‑intensive.
  • Supermarket supply chains are sensitive to freight and insurance costs.

Bread, cereals, dairy and meat are the first categories to feel the squeeze.

6. Supply Chain Strain Beyond Food and Energy

A prolonged conflict disrupts:

  • Petrochemicals
  • Plastics
  • Fertilisers
  • Industrial metals
  • Gulf‑based manufacturing and logistics

This feeds into higher costs for everything from packaging to electronics.

7. Corporate Investment Freezes

Businesses hate uncertainty. Expect:

  • Delays or cancellations of Gulf megaprojects.
  • Slower investment in petrochemicals, logistics and tech hubs.
  • Reduced appetite for Gulf‑exposed assets.

This undermines diversification efforts like Saudi Vision 2030.

8. Cyber Escalation

Iran has a long history of cyber retaliation. Likely developments include:

  • Attacks on Western banks, utilities and government systems.
  • Disruptions to Gulf infrastructure, including airports and desalination plants.
  • Rising cybersecurity costs for businesses globally.

Cyber conflict is asymmetric, deniable and cheap — making it a likely pressure valve.

9. Regional Political Destabilisation

The killing of senior Iranian leadership has already shaken the region.

Possible outcomes include:

  • Internal instability within Iran.
  • Escalation involving Hezbollah, Iraqi militias, Syrian factions and the Houthis.
  • Pressure on Gulf monarchies if civilian infrastructure continues to be targeted.

This is where the conflict risks widening beyond its initial theatre.

10. Migration and Humanitarian Pressures

If the conflict intensifies:

  • Refugee flows from Iran, Iraq and Syria could rise.
  • Europe — especially Greece, Turkey and the Balkans — faces renewed border pressure.
  • Humanitarian budgets shrink as Western states divert funds to defence.

This adds a political dimension to the economic fallout.

11. Insurance Market Stress

War‑risk insurance is already spiking.

Expect:

  • Higher premiums for shipping, aviation and energy infrastructure.
  • Reduced insurer appetite for Gulf‑exposed assets.
  • Knock‑on effects on global trade costs and consumer prices.

Insurance is a silent amplifier of geopolitical risk.

12. Higher Global Borrowing Costs

Sustained conflict spending creates:

  • Budgetary strain for the U.S., UK, EU and Gulf states.
  • Reduced fiscal space for domestic programmes.
  • Higher global borrowing costs as markets price in sustained uncertainty.

This tightens financial conditions worldwide.

13. Pressure on Emerging Markets

Countries heavily reliant on imported energy or food face:

  • Worsening trade balances
  • Currency depreciation
  • Higher inflation
  • Greater risk of sovereign stress

This is especially acute in South Asia, North Africa and parts of Latin America.

14. Strain on Multilateral Institutions

A prolonged conflict diverts attention and resources from:

  • Climate finance
  • Development aid
  • Humanitarian relief
  • Global health programmes

Institutions already stretched by Ukraine, Gaza and climate disasters face further overload.

15. The Strategic Reordering of Alliances

A drawn‑out conflict may accelerate geopolitical realignment:

  • Gulf states hedge between Washington and Beijing.
  • India and Turkey pursue more independent foreign policies.
  • Europe faces renewed pressure to define its own security posture.
  • Russia benefits from higher energy prices and Western distraction.

This is the long‑term consequence: a shift in the global balance of power.

Conclusion: A Conflict That Radiates Far Beyond Oil

If the U.S.–Iran war limps on, the world will feel it in supermarket aisles, shipping lanes, financial markets and political systems.

The most consequential knock‑on effect is not oil — it is fertiliser. That is the hinge on which global food security turns.

For the UK, the conflict exposes the fragility of a food system dependent on imports, long supply chains and energy‑intensive agriculture.

This is not just a Middle Eastern conflict. It is a global economic event in slow motion.

And who says we don’t need oil still!

FTSE 100 closes in on 11000 as it hists new record high!

FTSE 100 hits new high!

The FTSE 100 closed out last week by breaking through to a fresh all‑time high, underscoring a renewed wave of confidence in UK blue‑chip stocks.

The index ended Friday at 10,910.55, marking a record close after also touching an intra‑day peak of 10,934.94 earlier in the session.

This milestone capped a strong run in which the FTSE 100 repeatedly outperformed its U.S. and European counterparts, buoyed by resilient earnings, firmer commodity prices, and a rotation by investors seeking comparatively lower valuations in London’s market.

Several factors helped propel the index higher. Rising oil and precious‑metal prices supported heavyweight energy and mining constituents, while financials such as HSBC also contributed to the rally with upbeat results and improved outlooks.

FTSE 100 one-year chart

Sector mix

Analysts noted that the FTSE’s sector mix—rich in defensives and less exposed to the more volatile AI‑driven tech trade—has offered investors a measure of stability during a period of global uncertainty.

The latest surge leaves the index within striking distance of the 11,000 mark, a level that would have seemed ambitious only months ago.

With the FTSE 100 already up nearly 10% for the year to date, attention now turns to whether this momentum can be sustained as markets digest geopolitical tensions, shifting tariff policies, and the next round of corporate earnings.

UK Chancellor Rachel Reeves’ £100 Billion Tax Haul: What Does Britain Have to Show for It?

UK Tax Haul - where has it gone?

The Treasury’s latest figures reveal that the UK government collected more than £100 billion in taxes in a single month — a staggering sum that ought to signal a nation investing confidently in its future.

Yet the public mood tells a different story. For many households and businesses, the question is simple: if the money is flowing in at record levels, why does so little feel improved?

High Tax = Stable Economy?

Chancellor Rachel Reeves has repeatedly argued that high tax receipts reflect a stabilising economy and the early impact of Labour’s ‘growth-first’ strategy.

(It could be argued that her first budget didn’t exactly help growth – remember higher employer N.I. changes)?

Income tax, corporation tax and VAT all contributed to the surge, boosted by wage inflation, fiscal drag, and stronger-than-expected corporate profits.

On paper, the numbers look impressive. In practice, the lived experience across the country is far less reassuring.

Public Services Stretched

Public services remain stretched to breaking point. NHS waiting lists have barely shifted, local councils warn of insolvency, and the school estate continues to creak under decades of underinvestment.

Commuters still face unreliable rail services, potholes remain a national embarrassment, and the promised acceleration of green infrastructure has yet to materialise in any visible way. For a government that insists it is rebuilding Britain, the early evidence is thin.

Reeves’ defenders argue that structural repair takes time. After years of fiscal instability, they say, the priority is stabilisation: paying down expensive debt, restoring credibility with markets, and creating the conditions for long-term investment.

More to Come

The UK Chancellor has also signalled that major spending commitments — particularly on housing, energy and industrial strategy — will ramp up later in the Parliament.

But this patience is wearing thin. Voters were promised renewal, not a holding pattern. When tax levels are at a post-war high, the public expects tangible returns: shorter hospital queues, safer streets, better transport, and a sense that the country is moving forward rather than treading water. Instead, many feel they are paying more for the same — or, in some cases, less.

The political risk for Reeves is clear. A £100 billion monthly tax take is a powerful headline, but it becomes a liability if people cannot see where the money is going.

Frustration?

Unless the government can convert revenue into visible progress — quickly and convincingly — the Chancellor may find that record receipts only fuel record frustration.

It’s a striking contradiction: a nation pulling in more than £100 billion in tax in a single month yet seeing almost none of the visible improvements such a windfall ought to deliver.

The reality is that much of this revenue is immediately swallowed by structural pressures — servicing an enormous debt pile, propping up struggling local authorities, covering inflation‑driven public‑sector pay settlements, and patching holes left by years of underinvestment.

What remains is too thinly spread to transform services that are already operating in crisis mode.

Slow Pace

High receipts don’t automatically translate into better outcomes when the state is effectively running just to stand still, and until the government can shift from firefighting to genuine renewal, even record‑breaking tax months will feel like money disappearing into a system that can no longer convert revenue into results.

First, it’s important to understand that a £100+ billion month (largely January, when self-assessment and corporation tax payments fall due) does not mean the government suddenly has £100 billion spare to spend. Most of it is absorbed by existing commitments.

Here’s broadly where UK tax revenue goes:

So, just how has the £100 billion tax haul likely been apportioned?

1. Health – The NHS

The National Health Service is the single largest area of public spending.
Funding covers:

  • Hospitals and GP services
  • Staff wages (doctors, nurses, support staff)
  • Medicines and equipment
  • Reducing waiting lists

Health alone consumes well over £180 billion annually.

2. Welfare & Pensions

The biggest slice of all is often social protection:

  • State pensions
  • Universal Credit
  • Disability benefits
  • Housing support

An ageing population means pension spending continues to rise.

3. Debt Interest

Servicing national debt is expensive.
With higher interest rates over the past two years, billions go purely on interest payments, not new services.

4. Education

Funding for:

  • Schools
  • Colleges
  • Universities
  • Early years provision

Teacher pay settlements and school building repairs are major costs.

5. Defence & Security

Including:

  • Armed forces
  • Intelligence services
  • Support for Ukraine
  • Nuclear deterrent maintenance

6. Transport & Infrastructure

Rail subsidies, road maintenance, major capital projects, and support during strikes or restructuring.

7. Local Government

Councils rely heavily on central funding for:

  • Social care
  • Waste collection
  • Housing services

So Why Doesn’t It Feel Like £100 Billion?

Because….

  • January is a seasonal spike, not a monthly average.
  • The UK still runs a large annual deficit.
  • Public debt is above £2.6 trillion.
  • Much of the revenue replaces borrowing rather than funds new projects.

In short, the money hasn’t vanished — it is largely sustaining an already over stretched ‘FAT’ state, servicing debt, and maintaining core services rather than delivering visible ‘new’ benefits.

As of January 2026, the Office for National Statistics (ONS) reported that public sector net debt excluding public sector banks stood at £2.65 trillion, which is approximately 96.5% of GDP.

While January 2026 saw a record monthly surplus of £30.4 billion — driven by strong self-assessed tax receipts — the overall debt burden remains historically high.

This level of debt reflects years of accumulated borrowing, pandemic-era spending, inflation-linked interest payments, and structural deficits.

Even with strong tax intake, the scale of the debt means that progress on reducing it is slow and incremental.

UK inflation’s latest fall sharpens focus on Bank of England rate cuts

UK inflation at 3%

The UK’s inflation rate has dropped to 3%, its lowest level since March last year, renewing expectations that the Bank of England (BoE) may soon begin cutting interest rates.

The fall, recorded in January, marks a clear reversal from December’s unexpected uptick to 3.4% and reinforces the broader downward trend seen in late 2025.

Economists note that easing petrol, food, and airfare prices have been key contributors to the decline, helping inflation move closer to the government’s 2% target.

Bank of England easier decision

The BoE has held Bank Rate at 3.75% in recent meetings, emphasising the need for confidence that inflation will not only reach 2% but remain there sustainably.

However, with inflation now falling faster than previously forecast, policymakers appear to have greater room to consider loosening monetary policy later this spring.

The Bank itself has acknowledged that inflation is likely to return to target ‘a bit quicker than previously forecast’, suggesting scope for cuts if economic conditions evolve as expected.

Rate reduction likely in March or April 2026

Market analysts increasingly anticipate a rate reduction as early as March or April, particularly as wage growth cools and unemployment edges higher—factors that reduce domestic inflationary pressure.

For households and businesses, a cut would offer welcome relief after two years of elevated borrowing costs, potentially lowering mortgage rates and improving credit conditions.

While the BoE remains cautious, the latest inflation figures strengthen the case for a shift towards easing—signalling that the long, difficult climb down from the inflation peak may finally be nearing its conclusion.

As expected

Most economists and market analysts expected UK inflation to fall back to around 3% in the January release, down from 3.4% in December 2025.

UK inflation falls to 3%

This means the actual figure—3%—came in exactly in line with forecasts, rather than surprising to the downside or upside.

That alignment matters for the Bank of England because it reinforces the sense that inflation is easing broadly as expected, rather than stalling or re‑accelerating.

Employment data

Alongside falling inflation, the Bank of England is closely watching UK labour market data, which remains a key factor in its interest rate decisions.

Recent figures show wage growth is easing, with average earnings excluding bonuses rising at a slower pace—now below 6%—while job vacancies continue to decline.

This softening suggests that domestic inflationary pressure from pay settlements may be waning, giving the Bank more confidence that inflation can return to target sustainably.

However, unemployment remains low, and services inflation is still sticky, meaning policymakers are likely to weigh jobs data carefully before committing to rate cuts.

If wage growth continues to moderate and employment weakens further, the case for easing monetary policy will strengthen.

Office for National Statistics

Alphabet’s 100‑Year Bond: Ambition, Appetite and Anxiety in the AI Debt Boom

Alphabet's 100-year Sterling Bond for pensions

Alphabet’s decision to issue a 100-year sterling bond has captured the attention of global markets, not only because of its rarity but also because of what it signals about the escalating competition in artificial intelligence.

100 year sterling bond

A century-long bond denominated in pounds is an extraordinary financing move, particularly for a technology company.

It reflects both investor confidence in Alphabet’s long-term prospects and the scale of capital now required to compete in the AI era.

On the surface, the benefits are clear. Locking in funding for 100 years at today’s rates provides financial certainty. Alphabet can secure vast sums of capital without facing refinancing risk for generations.

In an industry defined by rapid change and enormous upfront costs — from data centres and semiconductor procurement to specialised AI chips and energy infrastructure — patient capital is invaluable.

Sterling

The sterling denomination also diversifies Alphabet’s funding base beyond U.S. dollar markets, potentially appealing to European institutional investors seeking stable, long-duration assets.

The bond may also be interpreted as a strategic signal. By committing to long-term financing, Alphabet demonstrates confidence in its ability to generate cash flows well into the next century.

It reinforces the company’s image as a durable, infrastructure-like enterprise rather than a volatile technology stock.

For investors such as pension funds and insurers, a 100-year instrument from a highly rated issuer can offer predictable returns in a world where long-term yield is scarce.

Cyclical

However, the move is not without shortcomings. Committing to fixed debt obligations over such an extended horizon reduces flexibility. While Alphabet currently enjoys strong balance sheet metrics, the technology sector is notoriously cyclical.

A century is an eternity in innovation terms. Business models, regulatory frameworks and geopolitical dynamics may shift dramatically.

Future generations of management will inherit the obligation, regardless of whether today’s AI investments deliver the expected returns.

More broadly, the bond feeds concern about a debt-fuelled AI arms race. As technology giants pour tens of billions into AI research, chip design and cloud infrastructure, borrowing is becoming an increasingly prominent tool.

If rivals respond with similar long-dated issuance, the sector’s leverage could rise meaningfully. In a downturn or if AI monetisation disappoints; heavy debt burdens could amplify financial strain.

Ultimately, Alphabet’s 100-year sterling bond embodies both ambition and risk. It underlines the immense capital demands of the AI revolution while raising questions about whether today’s competitive fervour is encouraging companies to stretch their balance sheets too far in pursuit of technological dominance.

Systemic anxiety

The deeper anxiety is systemic. With Oracle, Amazon, Microsoft and others also scaling up borrowing, total tech‑sector issuance is projected to hit $3 trillion over five years.

Some analysts warn this resembles a late‑cycle credit boom, where investors chase thematic excitement rather than sober fundamentals.

Alphabet’s century bond may be a masterstroke of timing — or a marker of excess.

Either way, it crystallises the tension at the heart of the AI revolution: extraordinary promise, financed by extraordinary debt.

Why a Sterling Bond?

Alphabet issued its 100‑year sterling bond to tap deep UK demand for ultra‑long‑dated assets, especially from pension funds seeking to match long‑term liabilities.

The sterling market offered strong appetite, with orders reportedly reaching nearly ten times the £1 billion on offer.

It also formed part of Alphabet’s broader multi‑currency fundraising drive to finance massive AI‑related capital spending, including data‑centre expansion.

Issuing in sterling diversified its investor base, reduced reliance on U.S. dollar markets, and signalled confidence in its long‑term stability as a quasi‑infrastructure‑scale business.

It’s all debt; however you look at it!

UK ekes out lacklustre 0.1% growth in Q4 2025

UK lacklustre growth in Q4

The UK economy managed to expand by just 0.1% in the final quarter of 2025, underscoring the fragility of Britain’s post‑pandemic recovery and reportedly falling short of economists’ expectations for a slightly stronger finish to the year.

Preliminary figures from the Office for National Statistics show a picture of uneven momentum, with manufacturing providing the only meaningful lift as the dominant services sector stalled entirely.

The Office for National Statistics (ONS) said the services sector showed no growth over the quarter – the first time this has happened in two years – with the main boost coming from manufacturing.

Meanwhile the construction sector registered its worst performance in four years, the ONS said.

Lacklustre growth for 2025

The UK economy is estimated to have grown by 1.3% for the whole of 2025, a slight uptick from 1.1% growth a year earlier, but lower than the 1.4% expected by the Bank of England.

Construction fared even worse, recording its weakest performance in more than four years, while monthly data for December 2025 revealed only a marginal 0.1% uptick.

Sterling was largely unmoved, reflecting markets’ view that the figures change little about the broader economic trajectory.

The Bank of England, which narrowly voted to hold interest rates at 3.75% earlier this month, now faces renewed pressure to begin easing policy in the spring.

Inflation remains stubborn, but analysts reportedly argue that a modest rate cut could help revive activity in the first half of 2026.

Despite the sluggish end to the year, the economy still grew 1.3% across 2025.

Economists remain cautiously optimistic that improving manufacturing output and early signs of renewed demand in services could support a gradual recovery through 2026.