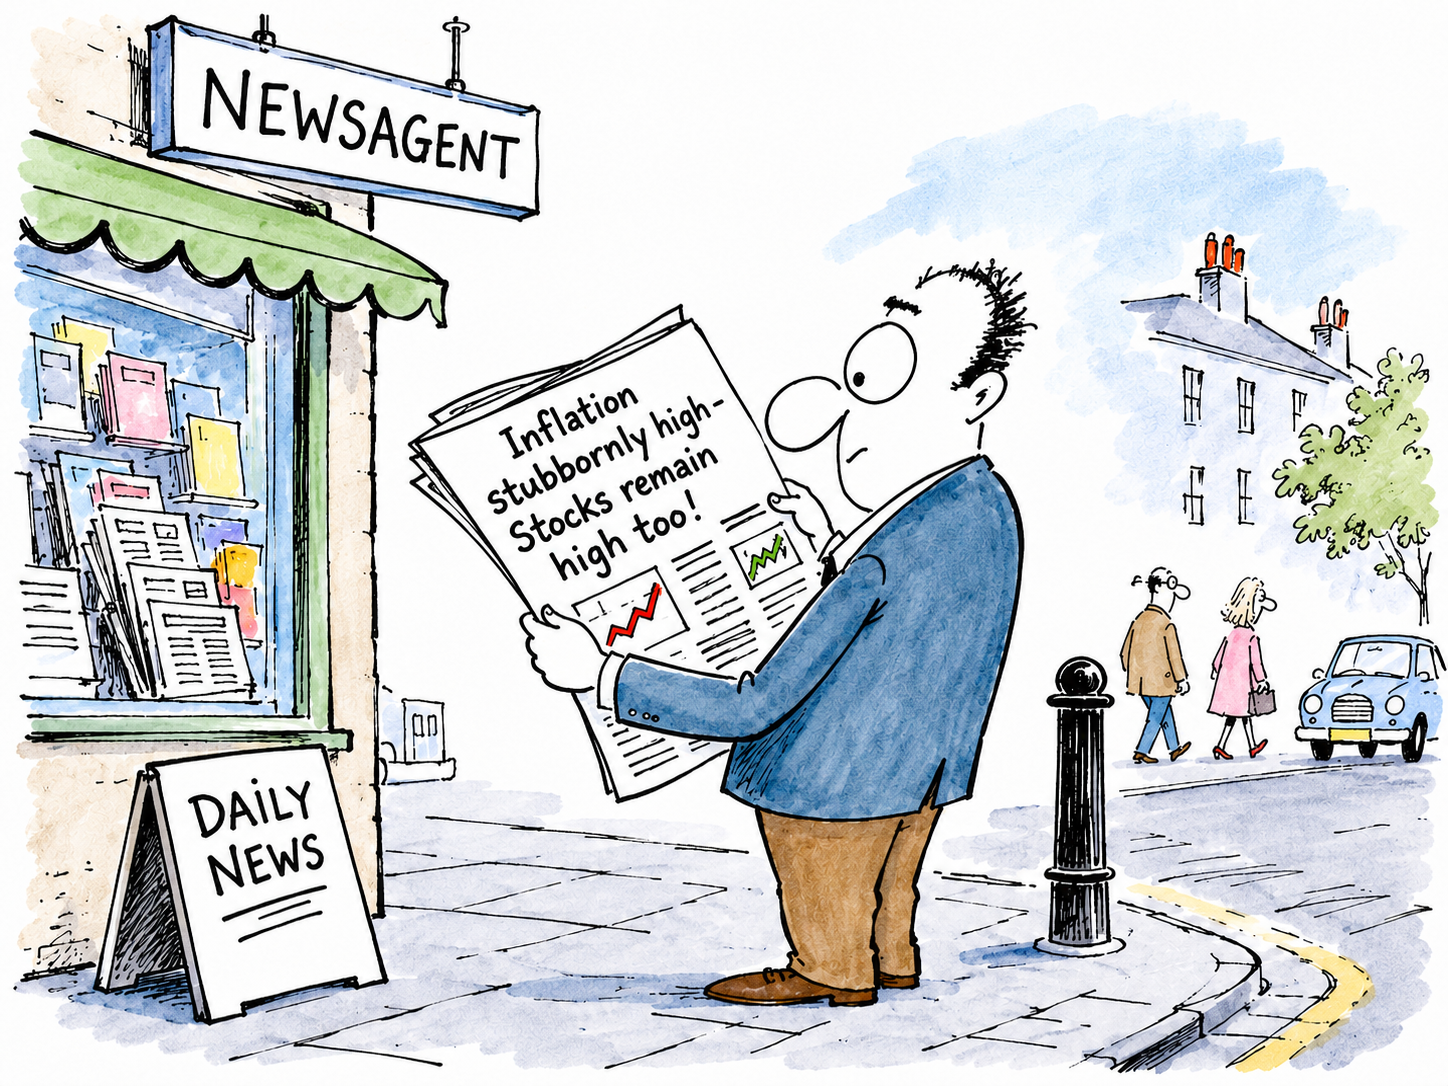
U.S. inflation accelerated in September 2026, raising fresh concerns that the Federal Reserve may struggle to bring price increases under control without keeping interest rates higher for longer.
CPI
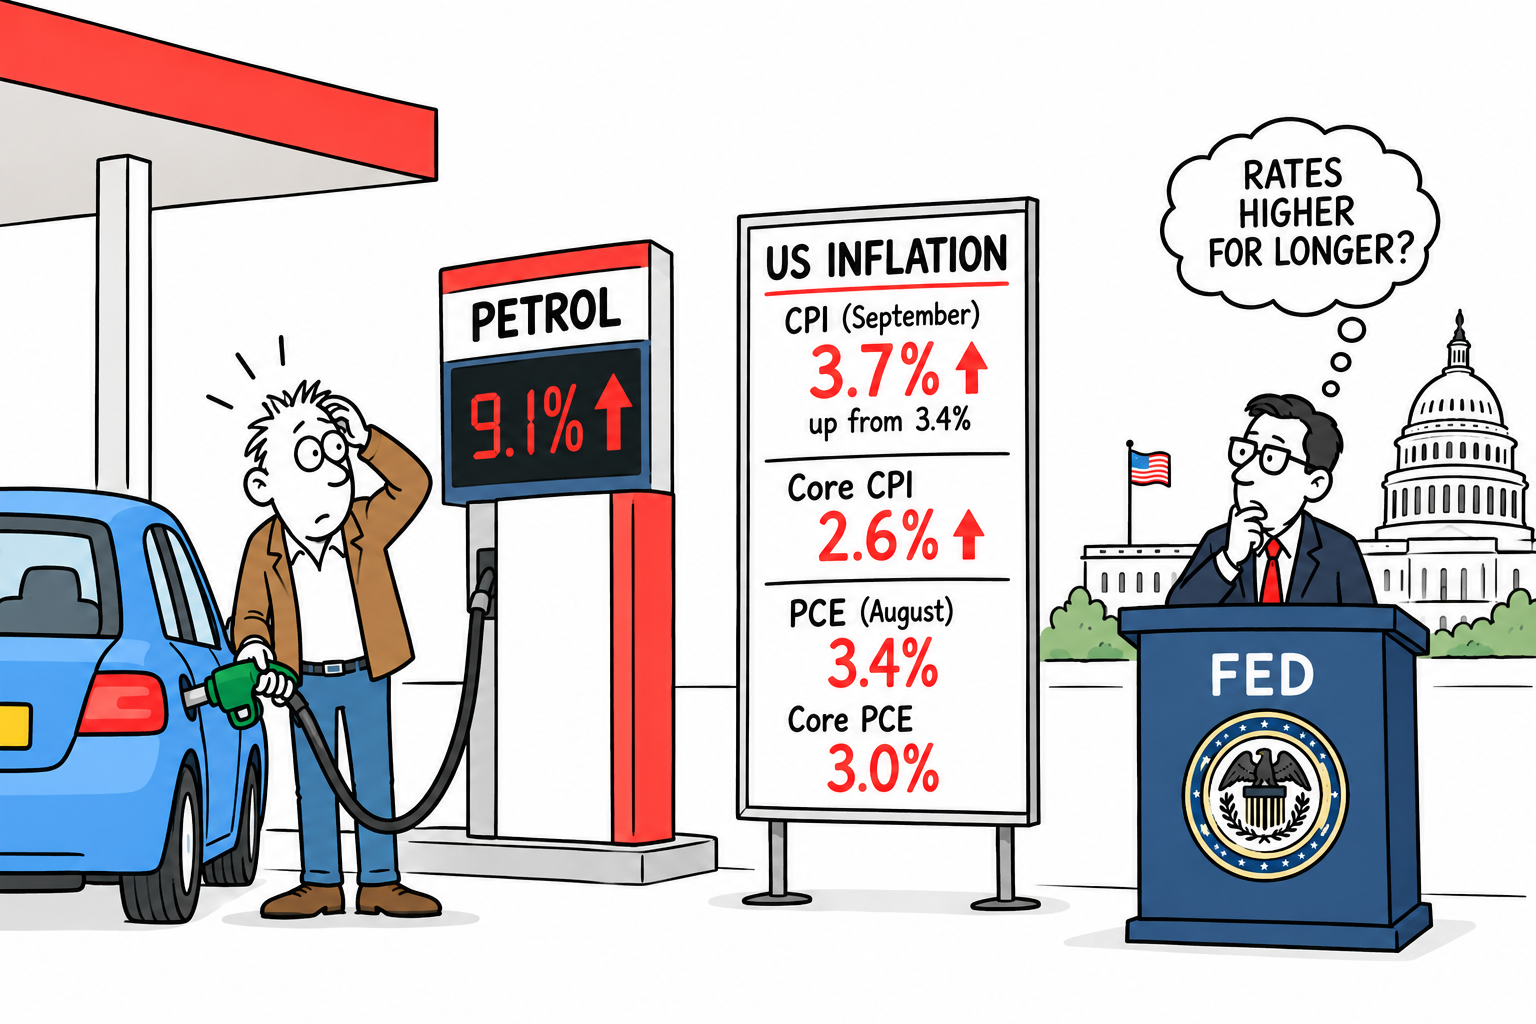
The Consumer Price Index (CPI) rose by 3.7% over the year to September, up from 3.4% in August. Monthly inflation reached 0.6%, driven largely by a sharp 9.1% increase in petrol prices. Core CPI, which excludes food and energy, rose by 2.6% annually.
The figures highlight the growing threat from rising energy costs, which can feed through into transport, manufacturing and household bills, putting further pressure on consumers.
Core PCE, excluding food and energy, stood at 3.0%. Monthly increases were 0.3% and 0.2%, respectively.
Both measures remain above the Fed’s 2% inflation target, complicating decisions over interest rates. Renewed inflationary pressure could delay rate cuts or increase the prospect of further tightening.
For financial markets, the combination of stubborn inflation, rising energy prices and elevated borrowing costs presents a challenging outlook.
Investors will be watching the next PCE figures, due on 29th October 2026, for clues about the direction of U.S. monetary policy.
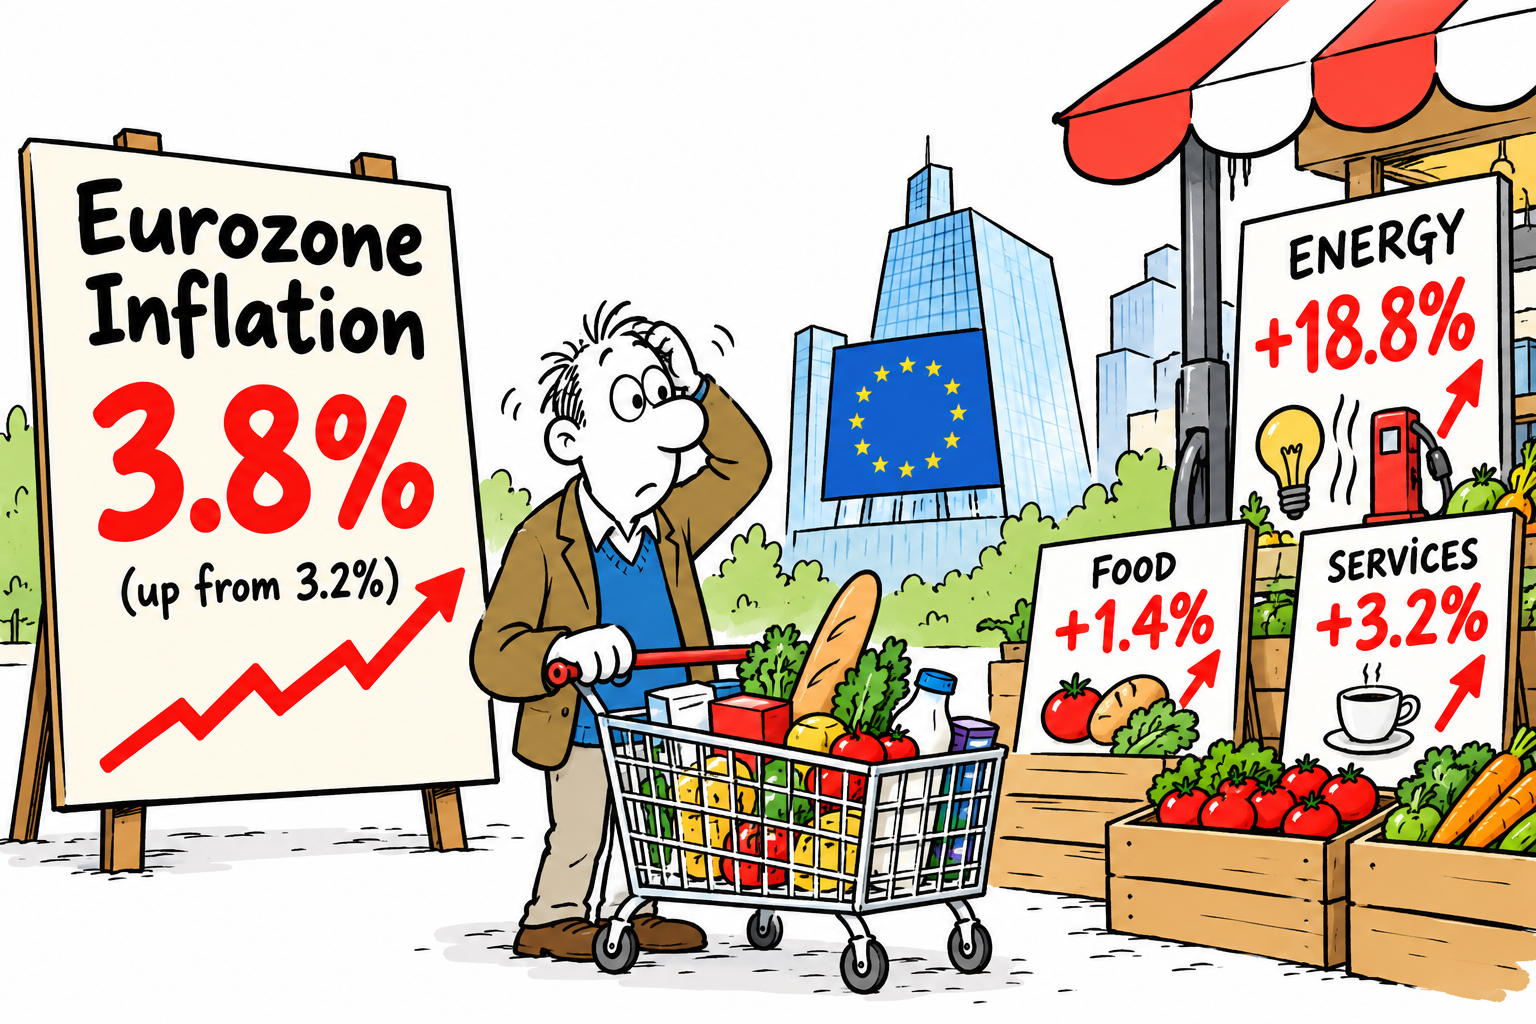
Eurozone inflation delivered another unwelcome surprise today, accelerating sharply to 3.8% in September2026, up from 3.2% in August 2026 and significantly above economists’ expectations of around 3.6%.
The main culprit was energy. Energy prices were 18.8% higher than a year earlier, compared with a 14.3% increase in August. Services inflation also accelerated to 3.2%, while food, alcohol and tobacco prices rose 1.4%.
More encouragingly, underlying EU inflation remained considerably more contained. Core inflation, which strips out volatile food and energy prices, edged up from 2.4% to 2.5%. This suggests that, so far, the energy shock has not fully translated into broader price pressures.
ECB headache
Nevertheless, today’s figures create another headache for the ECB. Higher energy costs risk feeding through into wages and other prices, while already elevated borrowing costs are putting pressure on businesses, governments and households.
The ECB now faces a difficult balancing act: raising interest rates could help contain secondary inflationary pressures, but could also weaken an economy already facing higher energy costs and financial uncertainty.
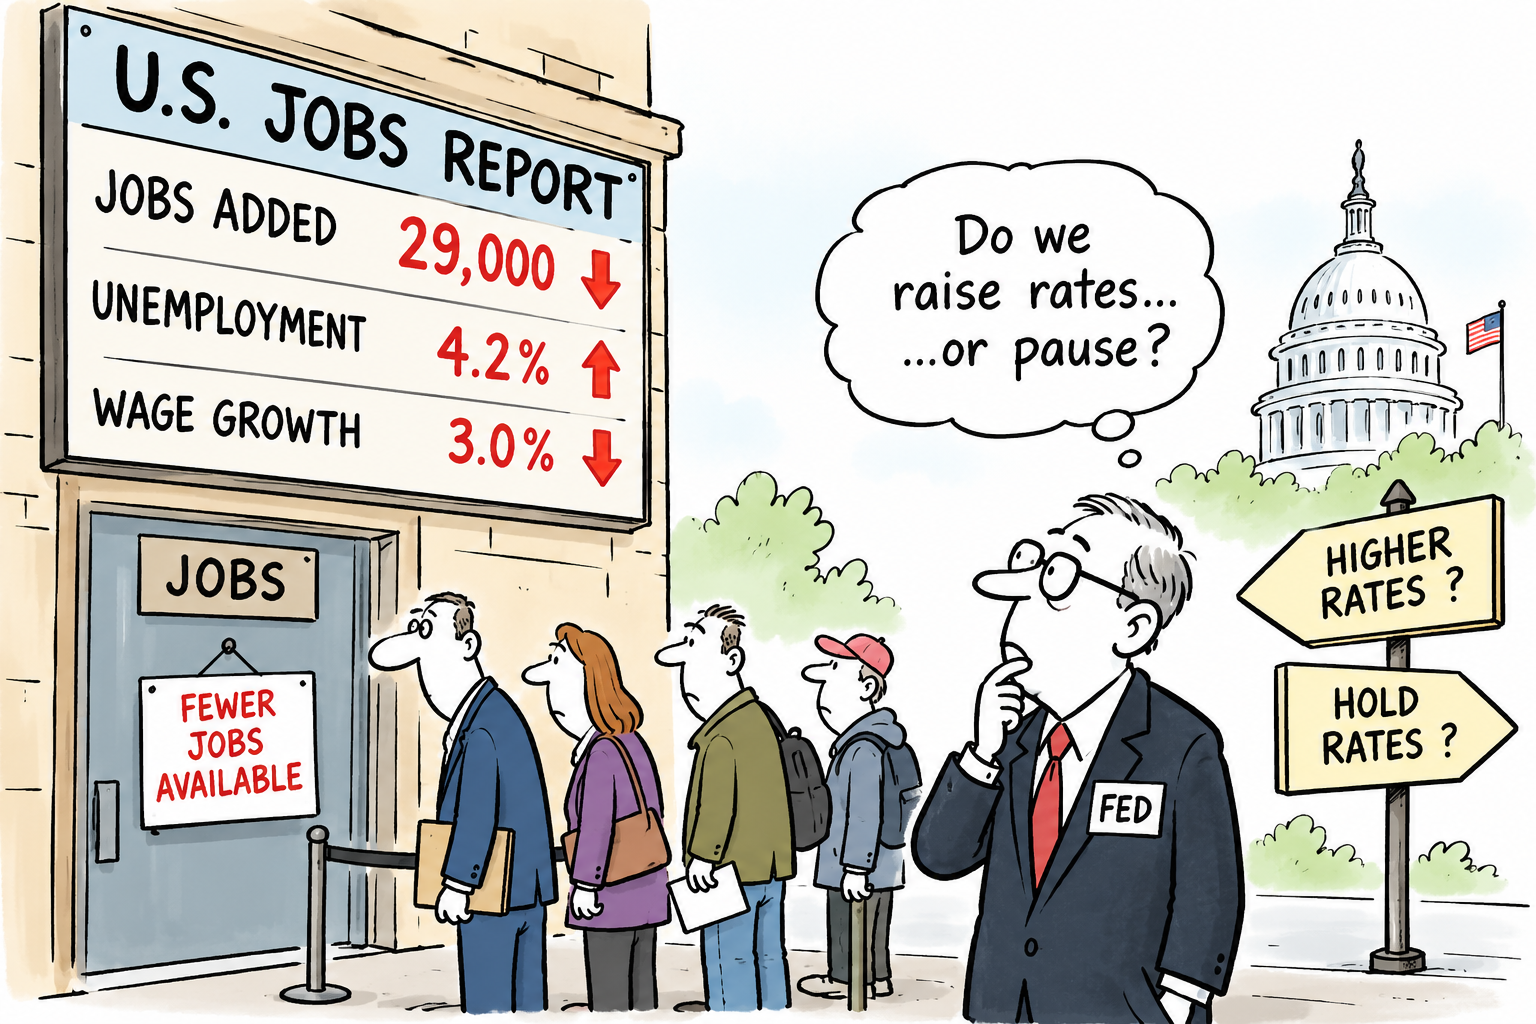
The latest U.S. non-farm payroll figures have delivered a significant downside surprise, with employers adding just 29,000 jobs in September 2026, well below economists’ expectations.
The unemployment rate also edged higher to 4.2%, while payroll growth for July and August 2026 was revised down by a combined 60,000 jobs.
Wage growth provided another important signal, with average hourly earnings rising just 0.1% in September 2026 and 3.0% over the past year.
Construction added 11,000 jobs and manufacturing 9,000, while healthcare continued to record employment gains.
Federal Reserve Decision?
For the Federal Reserve, the report strengthens the case for caution on further interest-rate increases.
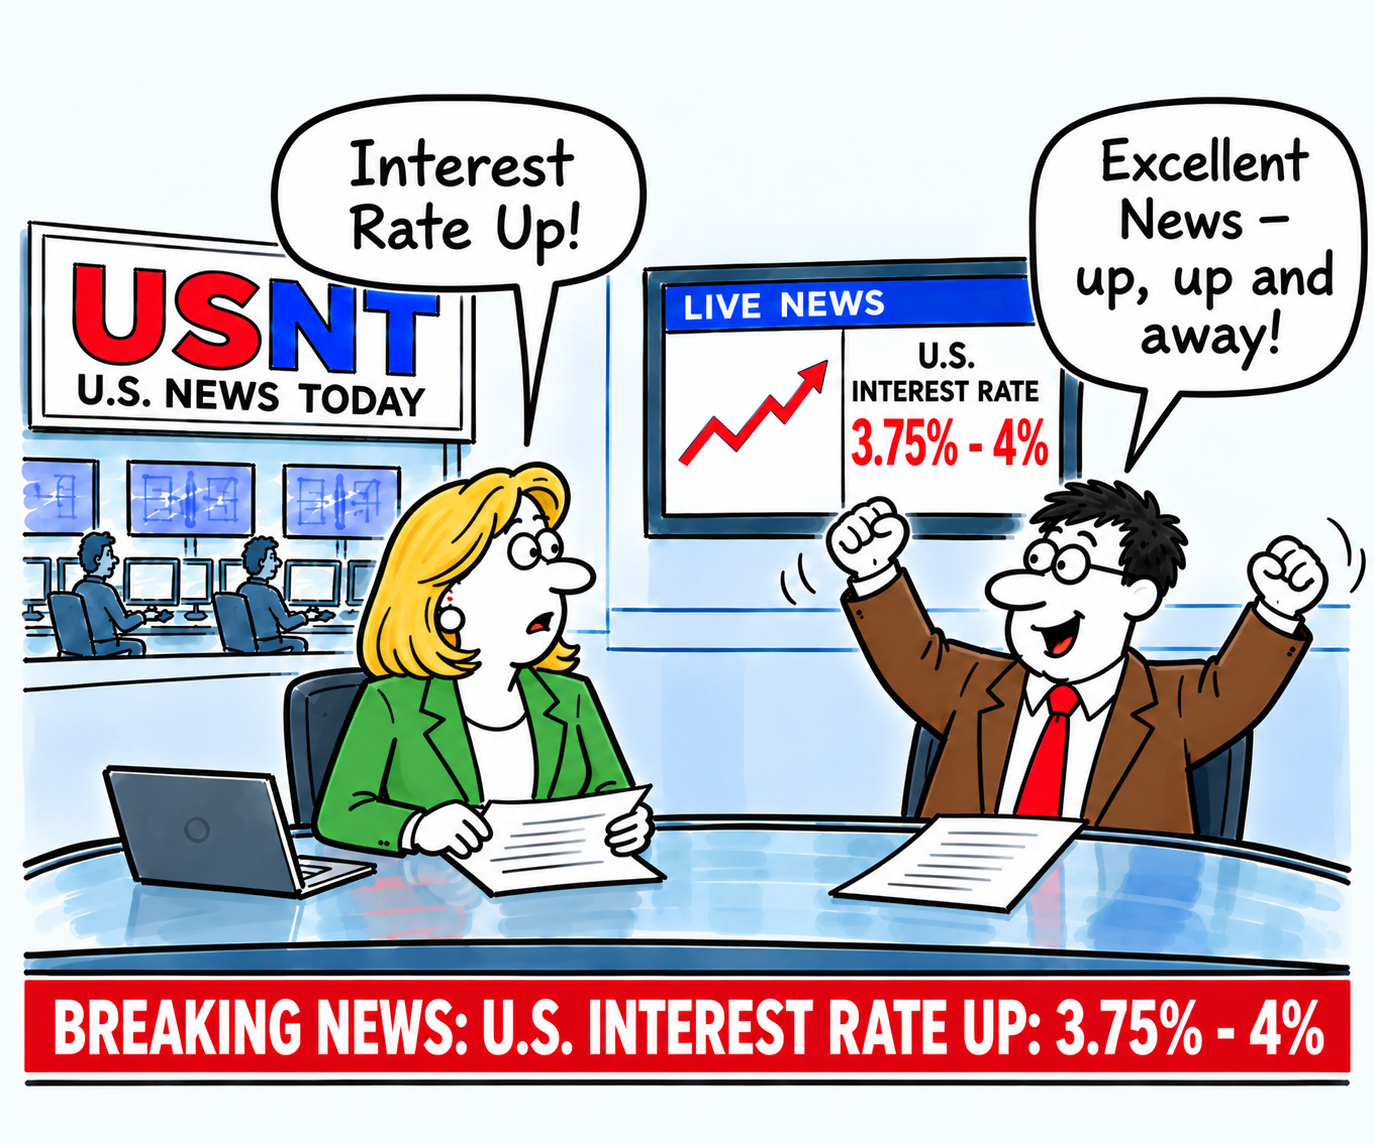
The Fed raised its benchmark rate by 25 basis points in September 2026 to a 3.75%-4.00% range, but policymakers have continued to face a difficult balance between controlling inflation and maintaining maximum employment.
The weak payroll number, higher unemployment and softer wage growth reduce evidence of an overheating labour market.
Market expectations for another U.S. rate increase at the Fed’s October meeting fell sharply following the release, although U.S. inflation remains the key obstacle to any immediate easing in policy.
The report therefore leaves the Fed with a more delicate policy trade-off: employment is losing momentum, but inflation remains too important to ignore.
Annual headline PCE inflation stood at 3.4%, while core PCE inflation, which excludes food and energy, remained at 3.0%.
Despite the encouraging monthly figures, inflation remains well above the Fed’s 2% target. Persistent price pressures, rising energy costs and resilient consumer spending could complicate the outlook.
The latest data may give policymakers some breathing space, but it does not guarantee interest-rate cuts.
The Fed must balance the need to control inflation against the risk of weakening economic growth, leaving the timing of future rate decisions uncertain.
The combination of record global debt, higher borrowing costs and growing doubts about the enormous sums being committed to artificial intelligence is creating a more complicated backdrop for financial markets.
Global debt exceeded $365 trillion in the first half of 2026, according to the Institute of International Finance, with debt now around 310% of global GDP.
China and the U.S. debt mountain
The increase was driven particularly by China and the United States. At the same time, higher interest rates are making refinancing increasingly expensive, creating the possibility of a vicious cycle in which governments and companies borrow more simply to service existing obligations.
This is particularly significant for the AI boom. The OECD says governments and companies are expected to borrow around $29 trillion from markets during 2026, while corporate borrowing is also rising as businesses finance major investment programmes, including AI infrastructure.
Michael Burry
Michael Burry, famous for anticipating the U.S. housing crisis, has added another warning sign.
He has recently reportedly increased bearish positions involving Micron, Palantir, Nebius and the semiconductor sector, arguing that parts of the AI and chip boom could be vulnerable if supply increases faster than demand.
The concern is not necessarily that AI will fail. Rather, enormous investment and borrowing require enormous future revenues to justify them.
If AI spending produces lower-than-expected returns, highly valued technology shares could face pressure at the same time as heavily indebted companies face rising financing costs.
Could this affect the stock market now?
The ingredients for greater volatility are certainly present. Higher bond yields, expensive energy, inflation pressures and debt-servicing costs can compete with equities for investors’ money.
Reuters recently reported that global borrowing costs and energy prices were already creating concerns about the potential impact on equities and credit markets.
Yet markets have so far remained remarkably resilient, with U.S. shares still close to record levels.
The danger, therefore, may not be debt alone, but…
debt + high valuations + expensive AI investment + higher interest rates.
If those pressures reinforce one another, the adjustment in markets could become considerably more significant.
Stock markets are continuing to climb despite a growing list of concerns that would normally be expected to unsettle investors.
Interest rates are higher, government bond yields have risen, oil prices are elevated and inflation remains a concern. Geopolitical tensions are also creating uncertainty. Tariffs still on the agenda. Global debt rising and rogue AI concerns.
Yet investors continue to buy shares, particularly in the United States.
So why?
One important reason is corporate earnings. Investors appear willing to tolerate higher interest rates and expensive valuations while they believe company profits will continue to grow.
Large technology companies, in particular, remain at the centre of this optimism, with huge investment in artificial intelligence fuelling expectations of strong future earnings.
Buying dips
Another factor is the willingness of investors to buy market dips. When share prices fall, investors who remain confident about the longer-term outlook see an opportunity to buy at cheaper prices.
This can create a self-reinforcing cycle: markets fall, buyers move in, confidence returns and prices rise again.
There is also a belief that the economy remains sufficiently resilient to withstand higher borrowing costs and expensive energy.
Bad news is therefore being viewed as a problem, but not necessarily one capable of seriously damaging corporate profits.
However, this resilience could eventually be tested.
Earnings faith
The market is currently placing considerable faith in continued earnings growth and the economic benefits of artificial intelligence. If either begins to disappoint, investors could reassess the high valuations attached to many shares.
Higher oil prices could also keep inflation elevated, forcing interest rates to remain higher for longer. Rising bond yields would then provide investors with an increasingly attractive alternative to shares.
Bull Bear
For now, the bulls remain in control of market prices, even though the bears have plenty of arguments on their side.
The important question is whether company profits can continue to justify today’s share prices.
If they can, markets may continue climbing despite the bad news. If they cannot, investors may suddenly start paying much closer attention to all those warning signs they have recently been ignoring.
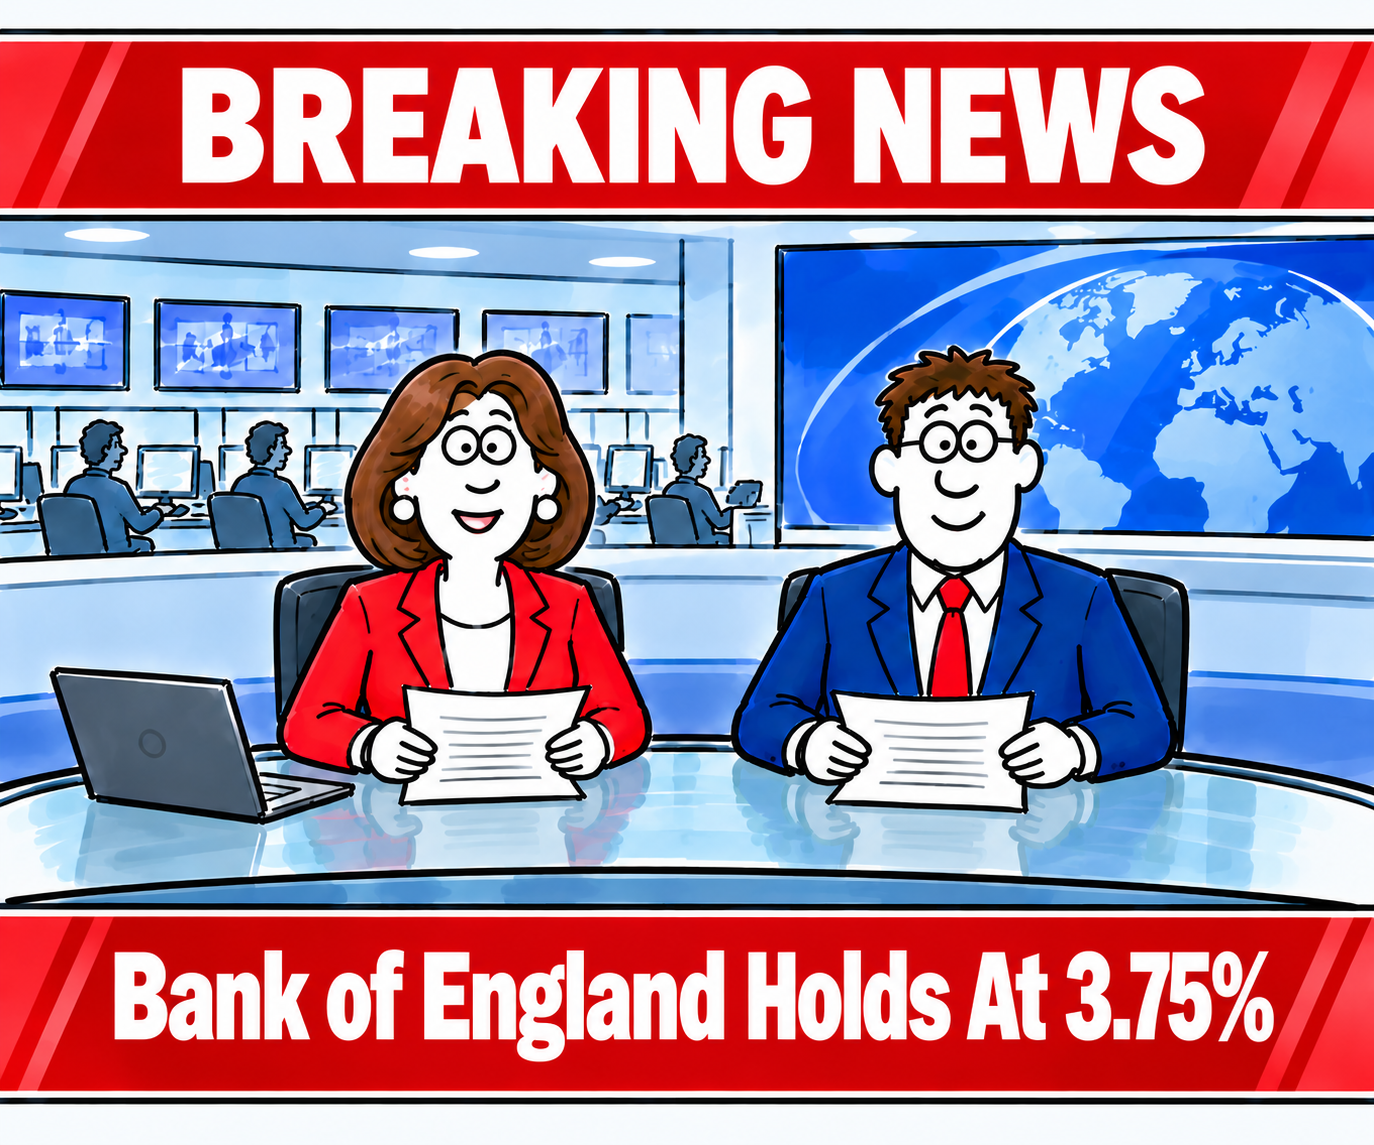
The Bank of England has held interest rates at 3.75% on 17th September 2026 but warned that persistently high energy costs could force rates higher.
The Monetary Policy Committee voted 6-3 to keep Bank Rate unchanged, while three members backed an increase to 4%.
Governor Andrew Bailey reportedly said the outlook remained uncertain, with rising energy prices creating renewed inflationary pressure.
UK inflation reached 3.1% in August 2026 and the Bank expects it to rise further, potentially exceeding 4% in early 2027 if energy costs remain elevated.
Bailey reportedly said that if the Middle East conflict persists and inflationary risks increase, monetary policy may need to tighten.
The Federal Reserve raised US interest rates by 25 basis points yesterday, taking its benchmark rate to 3.75%-4% and delivering the first increase since 2023.
The move puts U.S. inflation firmly back at the centre of the market conversation. Despite months of speculation about the direction of monetary policy, the Fed has signalled that persistent price pressures remain enough of a concern to warrant tighter financial conditions.
For investors, however, yesterday’s increase may be less important than what comes next
Markets must now decide whether the move represents a relatively modest adjustment to policy or the beginning of another tightening phase.
Any suggestion that further increases are coming could push U.S. Treasury yields and the dollar higher while placing renewed pressure on highly valued equities.
That matters particularly for a U.S. stock market already trading at elevated levels, with enthusiasm surrounding artificial intelligence continuing to support many of its largest companies.
Balancing act
The Fed therefore faces a difficult balancing act. It wants to bring U.S. inflation under control without unnecessarily damaging economic growth or employment.
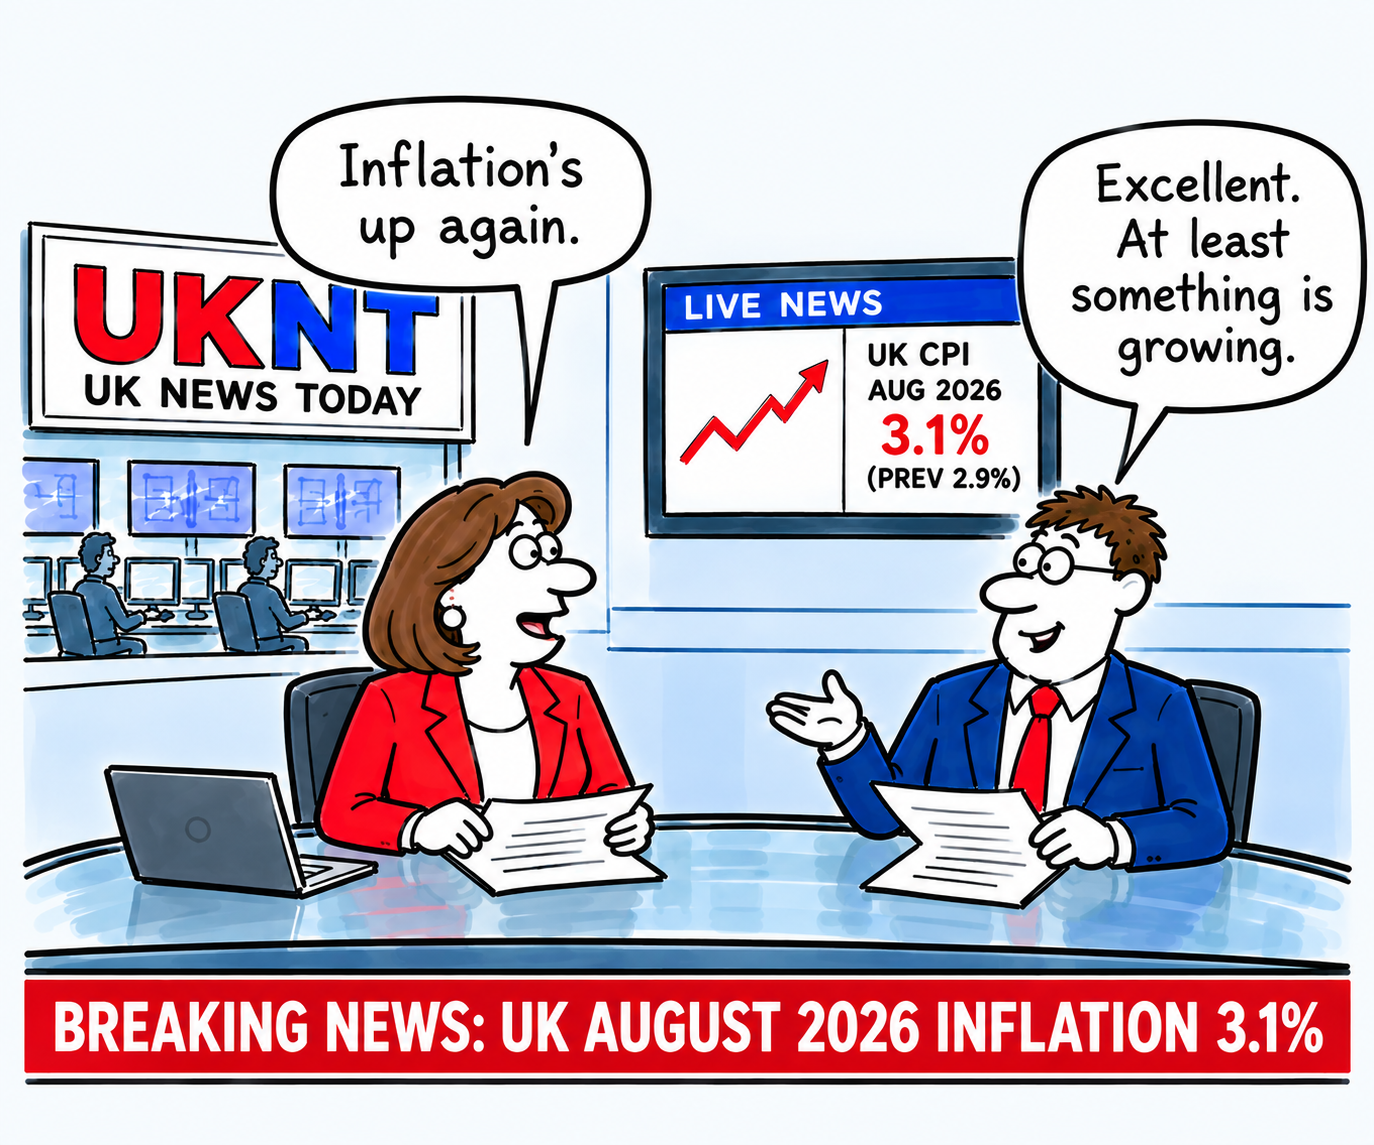
UK inflation has risen to 3.1% in August 2026, up from 2.9% in July, according to the latest figures from the Office for National Statistics.
The increase was driven largely by higher petrol and diesel prices, with transport making the biggest contribution to the rise. Airfares also added to inflationary pressures.
The latest figure is now well above the Bank of England’s 2% target, adding another complication for policymakers considering the future path of interest rates.
However, core inflation remained unchanged at 2.6%, suggesting underlying price pressures have not accelerated across the UK economy.
America’s inflation problem is proving stubborn, with the latest figures increasing pressure on the Federal Reserve to raise interest rates again.
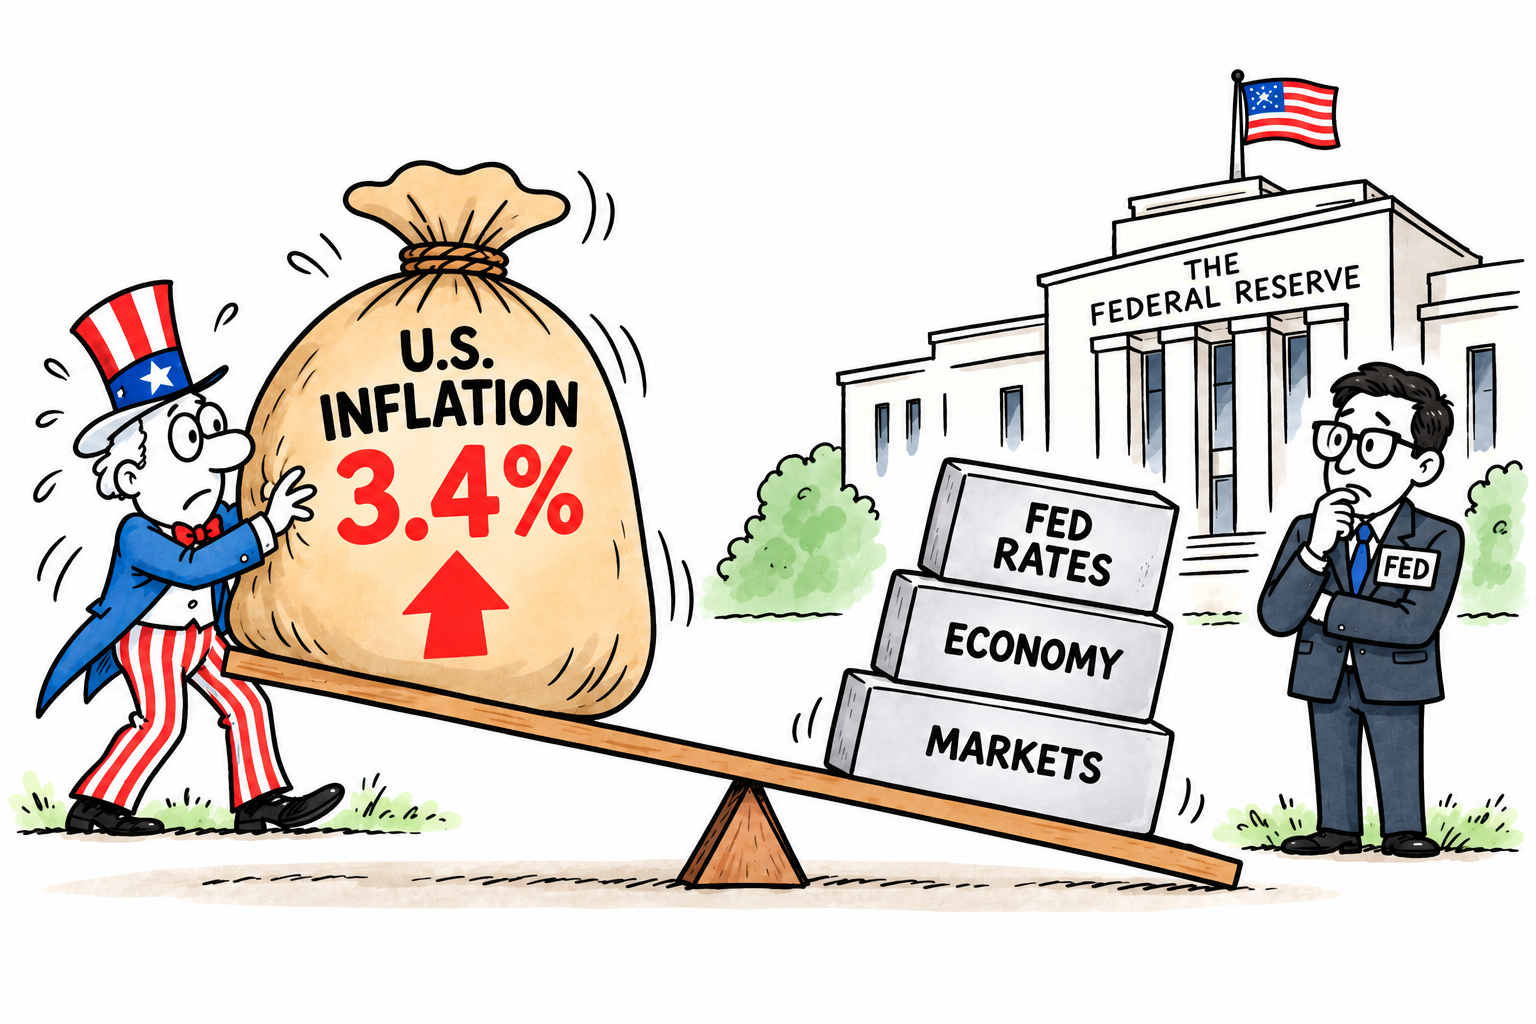
U.S. consumer prices rose 3.4% in August 2026 from a year earlier, unchanged from July, according to the latest U.S. Consumer Price Index figures.
Increase
Prices increased 0.4% during August 2026, a sharp acceleration from July’s 0.1% rise. Core inflation, which excludes volatile food and energy prices, rose 2.4% year-on-year and 0.3% during the month.
Higher petrol prices were a major contributor, with energy costs rebounding amid renewed geopolitical tensions.
Pressure
However, the persistence of underlying price pressures remains a concern for policymakers, particularly because U.S. inflation is still well above the Fed’s 2% target.
Attention now turns to the Federal Reserve’s September 15th–16th 2026 meeting. Financial markets have reacted strongly to the latest figures, with interest-rate futures putting the probability of a quarter-point rate increase at around 87% on September 16th 2026.
Decision
The Fed therefore faces a difficult decision. Higher rates could help contain inflation but would also increase borrowing costs for households and businesses.
For now, the latest data suggest that the battle against inflation is far from over, making a September rate increase increasingly likely.
On September 10th 2026, the European Central Bank (ECB) raised interest rates in an effort to stop a new wave of inflation from taking hold across the eurozone.
The ECB increased its key deposit rate by 0.25 percentage points to 2.5%, its second rate increase this year. The move comes as inflation has risen above 3%, well above the ECB’s 2% target.
Much of the renewed pressure is being blamed on higher energy prices, linked to the continuing conflict in the Middle East.
Energy costs
More expensive oil and gas can quickly feed through into transport, food and household bills, raising fears that inflation could prove more persistent than previously expected.
The problem for the ECB is that higher interest rates can also weaken economic growth. More expensive mortgages and business loans can discourage households from spending and companies from investing.
Challenge
Although the eurozone economy has shown some resilience, the outlook remains uncertain. The ECB expects inflation to average around 3% this year, while economic growth is expected to remain relatively weak.
The ECB now faces a difficult balancing act: raise rates enough to control inflation, but not so much that it pushes the economy into a deeper slowdown.
Investors are already likely wondering whether further increases could follow in the months ahead.
Britain’s fiscal squeeze is becoming increasingly difficult to ignore. The yield on the UK’s 30-year gilt has climbed to 5.89% — its highest level since 1998 — while the 10-year yield has risen to around 5.25%.
The immediate trigger is largely global: higher oil prices, renewed inflation fears and a worldwide bond sell-off. But Britain has an additional problem: an already stretched public finances position.
Tax, borrow or austerity – the familiar story
The timing could hardly be worse. Higher gilt yields mean higher future borrowing costs and, importantly, higher projected debt-interest payments.
Current estimates suggest that the rise in yields could roughly halve the Chancellor’s fiscal headroom, from around £26bn to about £13.8bn.
That leaves the government with an increasingly familiar choice: raise taxes, restrain spending, borrow more — or accept another round of austerity.
Burgeoning welfare
Welfare is inevitably part of the debate. UK welfare spending is enormous, projected at around £353bn in 2026-27, although more than half goes towards pensioners and the State Pension rather than working-age benefits.
The working-age and health-related components are nevertheless growing rapidly, creating a genuine long-term fiscal challenge.
But blaming welfare alone would be misleading. Debt interest itself has become a major burden. Public-sector net debt was around 95% of GDP in mid-2026, while debt-interest costs have been among their highest levels for decades.
The circle of failure
This is the vicious circle facing Britain: slow growth limits tax revenues; high spending increases borrowing; higher borrowing costs increase debt interest; and higher interest costs leave less money for public services and investment.
So is austerity coming back? Perhaps it never really left. The difference now is that governments are attempting to squeeze an increasingly expensive state while simultaneously trying to protect living standards and stimulate growth.
The October 2026 Budget may therefore be less about political ambition and more about how much pain the bond market will allow Britain to avoid.
Servicing debt
Borrowing costs in the U.S., Japan and Europe have hit similar highs in recent days, reflecting investors’ concerns about inflation, state borrowing levels and spending levels by large tech companies on AI.
World debt is a growing problem too
To be fair, rising yields and higher debt levels are not just a UK problem. France has its share of the burden, Japan, the EU and the U.S. too.
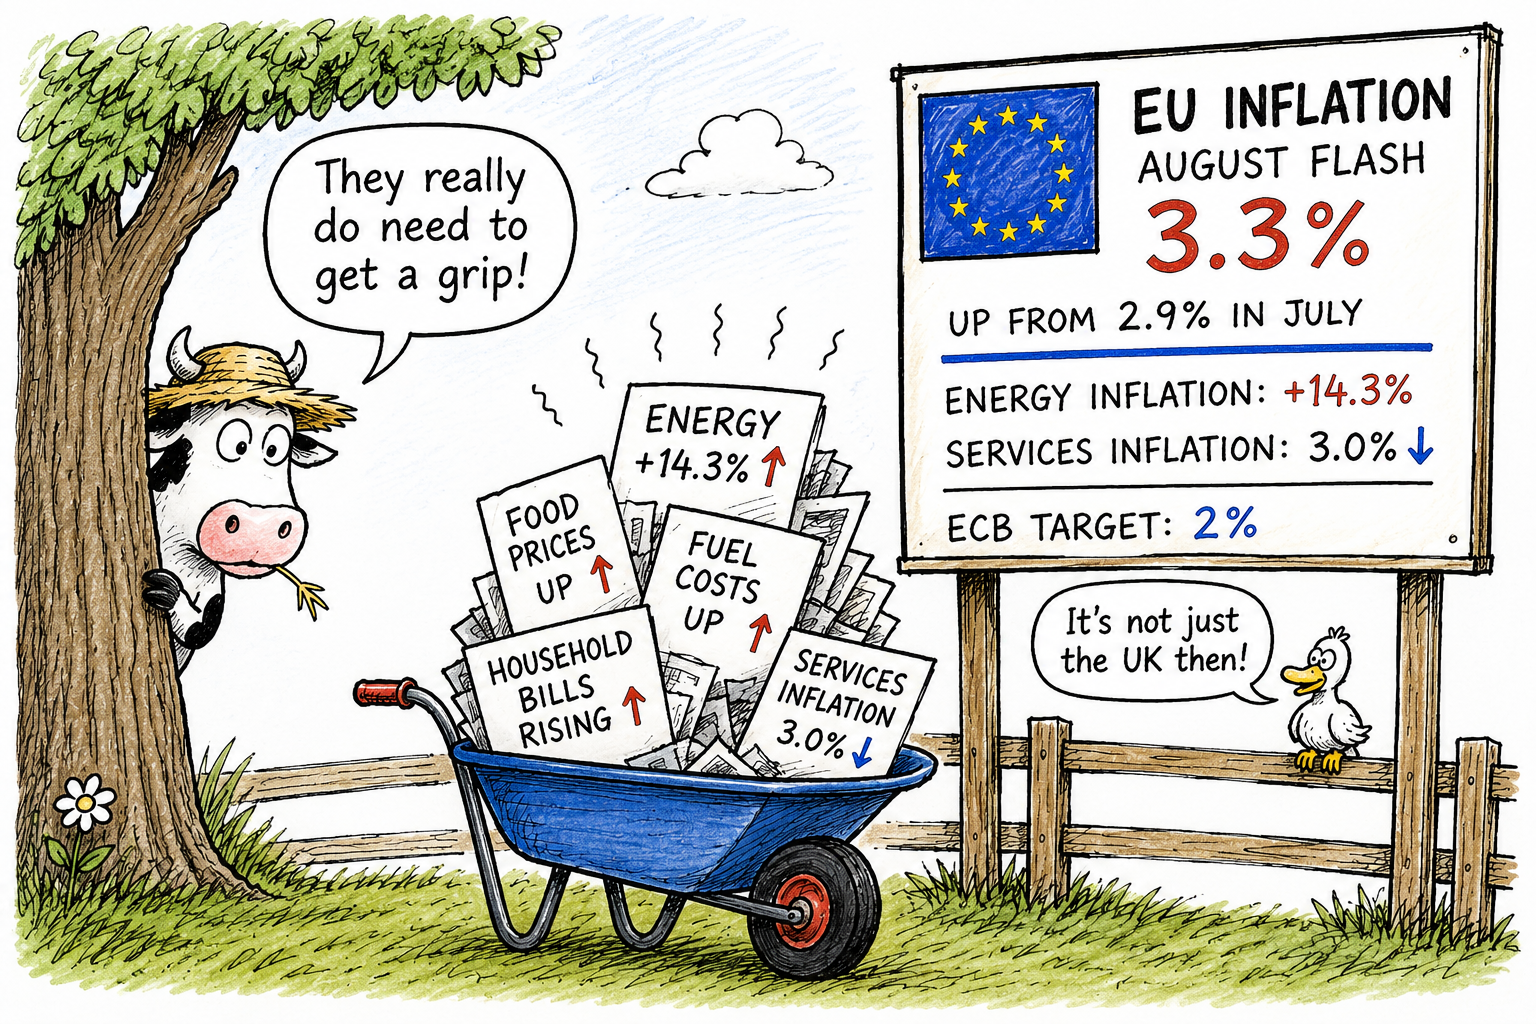
Inflation has returned as an unwelcome problem for Europe, with eurozone consumer prices rising by 3.3% in August 2026, according to Eurostat’s latest flash estimate.
That was a significant increase from 2.9% in July 2026 and puts inflation well above the European Central Bank’s 2% target.
Energy inflation up
The main culprit is energy. Annual energy inflation surged to 14.3%, up from 10.3% a month earlier, highlighting how quickly geopolitical tensions and energy markets can feed through into household bills and business costs.
There was, however, some better news beneath the headline figure. Services inflation eased to 3.0% from 3.30%, suggesting some underlying price pressures may be cooling.
Room for interest increase
The problem for the ECB is timing. Interest rates are already relatively low, but renewed inflation makes further cuts harder to justify.
Europe could therefore face an uncomfortable combination of higher prices and weaker growth — the very conditions policymakers would rather avoid.
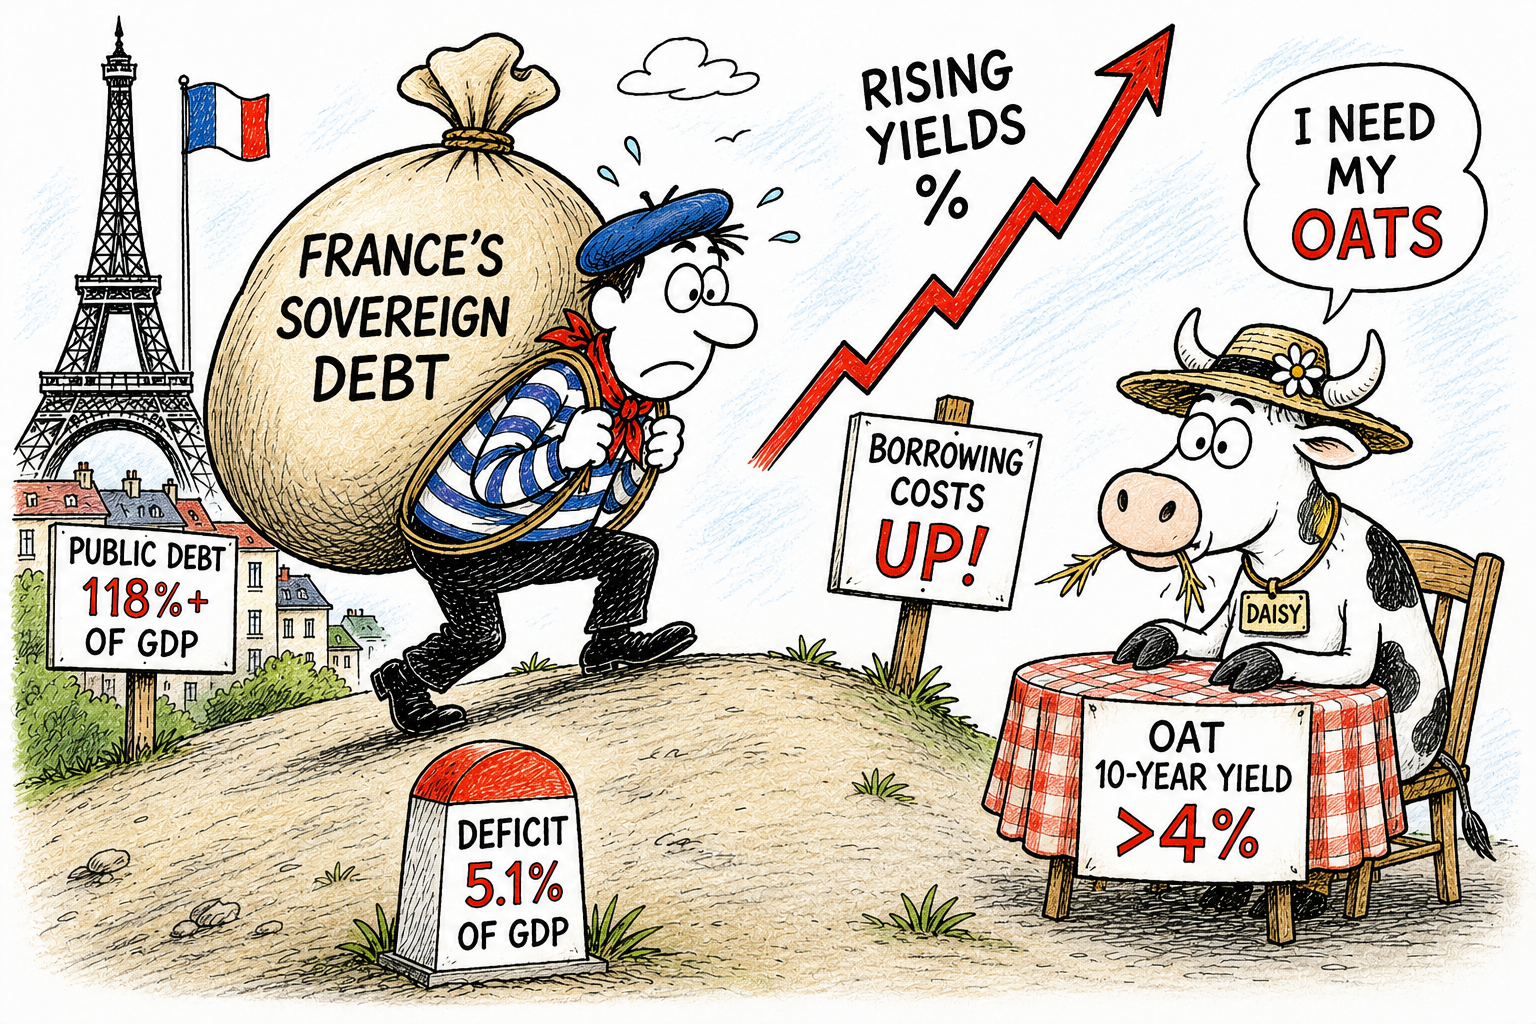
France is facing growing pressure from financial markets as the cost of servicing its enormous public debt continues to rise.
The problem is not simply the size of the debt, but the combination of high borrowing requirements, weak economic growth, political uncertainty and increasingly expensive interest payments.
France’s debt
France’s public debt is expected to reach around 118% of GDP in 2026, rising above 120% in 2027, according to the European Commission.
Meanwhile, the budget deficit is forecast to remain at around 5.1% of GDP this year, well above the European Union’s 3% limit.
Investors are now demanding higher returns to hold French government bonds. The yield on the benchmark 10-year French OAT recently moved above 4%, reaching levels not seen since the late 2000s.
Yields
At the end of August 2026, the yield remained around 4.1%, while the equivalent German Bund was closer to 3.25%.
That difference matters. The wider the gap between French and German borrowing costs, the greater the risk premium investors are demanding from Paris.
France’s spread has recently approached 90 basis points, reflecting concerns over its fiscal position and political uncertainty ahead of next year’s presidential election.
Danger signs
The danger is a potential “debt snowball”. As older, cheaper bonds mature, France must refinance them at today’s higher rates.
Interest payments therefore consume an increasing share of government revenue, potentially forcing Paris to borrow even more.
The European Commission reportedly expects French interest payments to rise from 2.2% of GDP in 2025 to 2.6% in 2026 and 2.8% in 2027.
France is not facing an immediate sovereign default, but markets are clearly demanding greater fiscal discipline.
The crucial question is whether politicians can agree on spending cuts and tax measures before rising interest costs become a much larger problem.
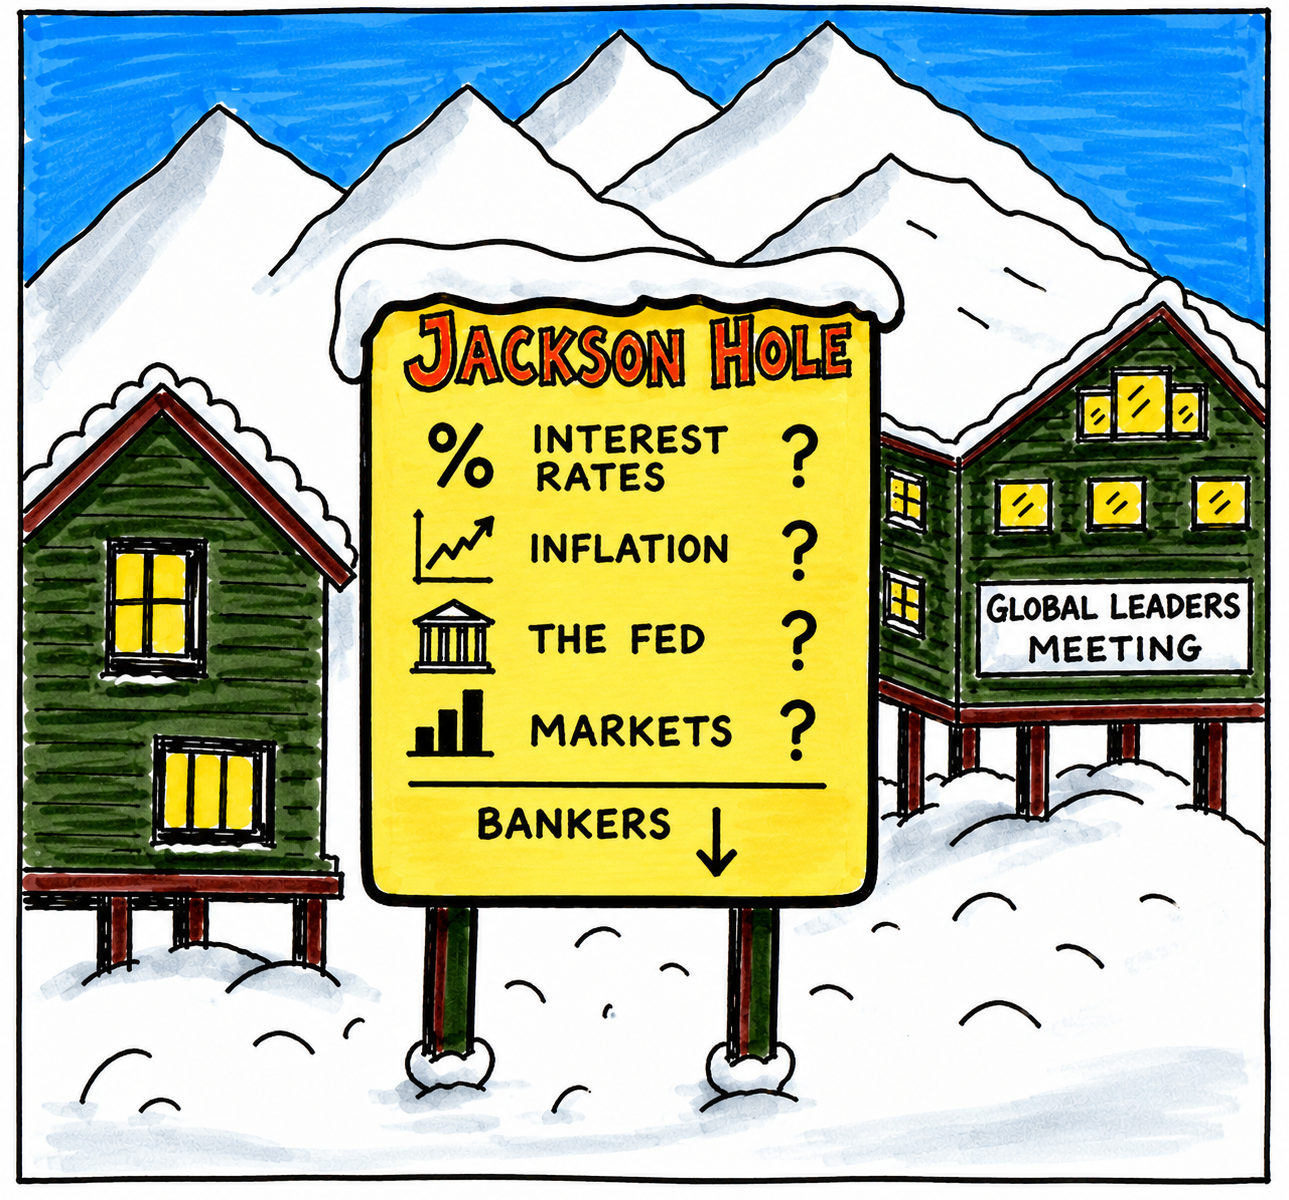
The 2026 annual Jackson Hole meeting has delivered a clear warning to financial markets: U.S. interest rates may not be heading lower… just yet.
Federal Reserve Chair Kevin Warsh used his first major Jackson Hole speech to stress that inflation remains too high and that recent improvements have not been enough to convince policymakers that price pressures are returning sustainably towards the Fed’s 2% target.
Warsh also suggested that current financial conditions are not sufficiently restrictive, raising the possibility that further interest-rate increases could be required.
Interest rate increase more likely?
Markets reacted quickly, with the probability of a September 2026 rate rise climbing to around 60%, compared with roughly 35% before his speech.
The message is particularly significant because investors had been hoping for lower borrowing costs. Instead, attention has shifted towards whether stubborn U.S. inflation will force the Fed to tighten policy again.
With the September 2026 meeting approaching, upcoming inflation and employment figures could prove crucial in determining the next move.
Fresh U.S. inflation figures released on 26th August have delivered an unwelcome reminder that the battle against rising prices is far from over.
The Federal Reserve’s preferred measure, the Personal Consumption Expenditures (PCE) price index, rose 3.7% in July compared with a year earlier, unchanged from June 2026 and above economists’ 3.6% forecast.
Core PCE, which strips out volatile food and energy costs, also remained stubborn at 3.3%, while prices increased 0.2% during July.
Above target of 2%
The figures leave inflation well above the Fed’s 2% target and could complicate expectations for interest-rate cuts. Markets have even increased the possibility of another rate rise later this year.
There was some encouragement elsewhere: personal income increased 0.4% in July 2026, while real consumer spending was broadly flat.
For the Fed, however, the message is clear: inflation is proving sticky, and cutting rates too quickly could risk reigniting price pressures.
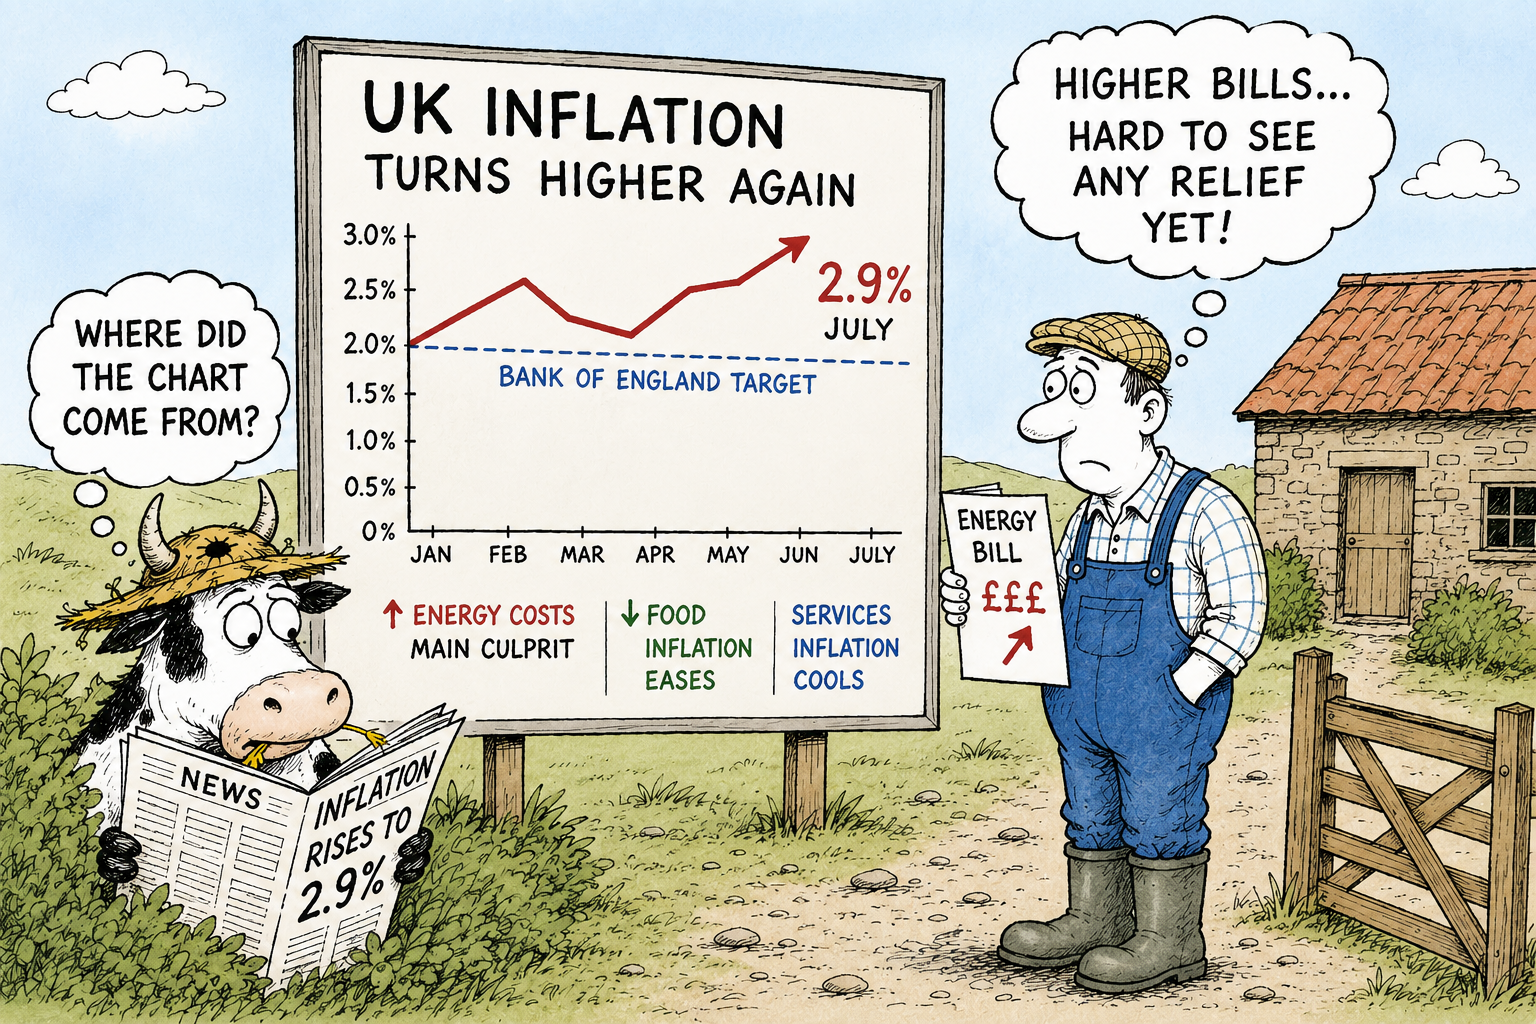
The UK’s inflation rate has moved higher again, providing an unwelcome reminder that the battle to bring prices under control is far from over.
Consumer price inflation rose to 2.9% in July 2026, up from 2.6% in June and moving further above the Bank of England’s 2% target.
The increase was largely driven by higher household energy costs following the latest rise in the energy price cap.
Not all negative
Gas prices increased sharply, putting renewed pressure on household budgets and pushing housing and household services inflation higher. For millions of families, the effect will be felt directly through larger energy bills.
However, the figures are not entirely negative. Food inflation eased to 1.3%, while services inflation fell from 3.6% to 3.4%. Core inflation, which strips out some of the more volatile components, remained at 2.6%.
Bank of England dilemma
That creates a difficult picture for the Bank of England. Inflation is moving in the wrong direction, but some of the underlying pressures are continuing to moderate.
The latest figures therefore make further interest-rate cuts more complicated. The Bank will want to avoid reigniting inflation, while also recognising that higher borrowing costs can weigh heavily on an already fragile economy.
For consumers, however, the message is simpler: the cost-of-living squeeze is easing, but it certainly isn’t over.
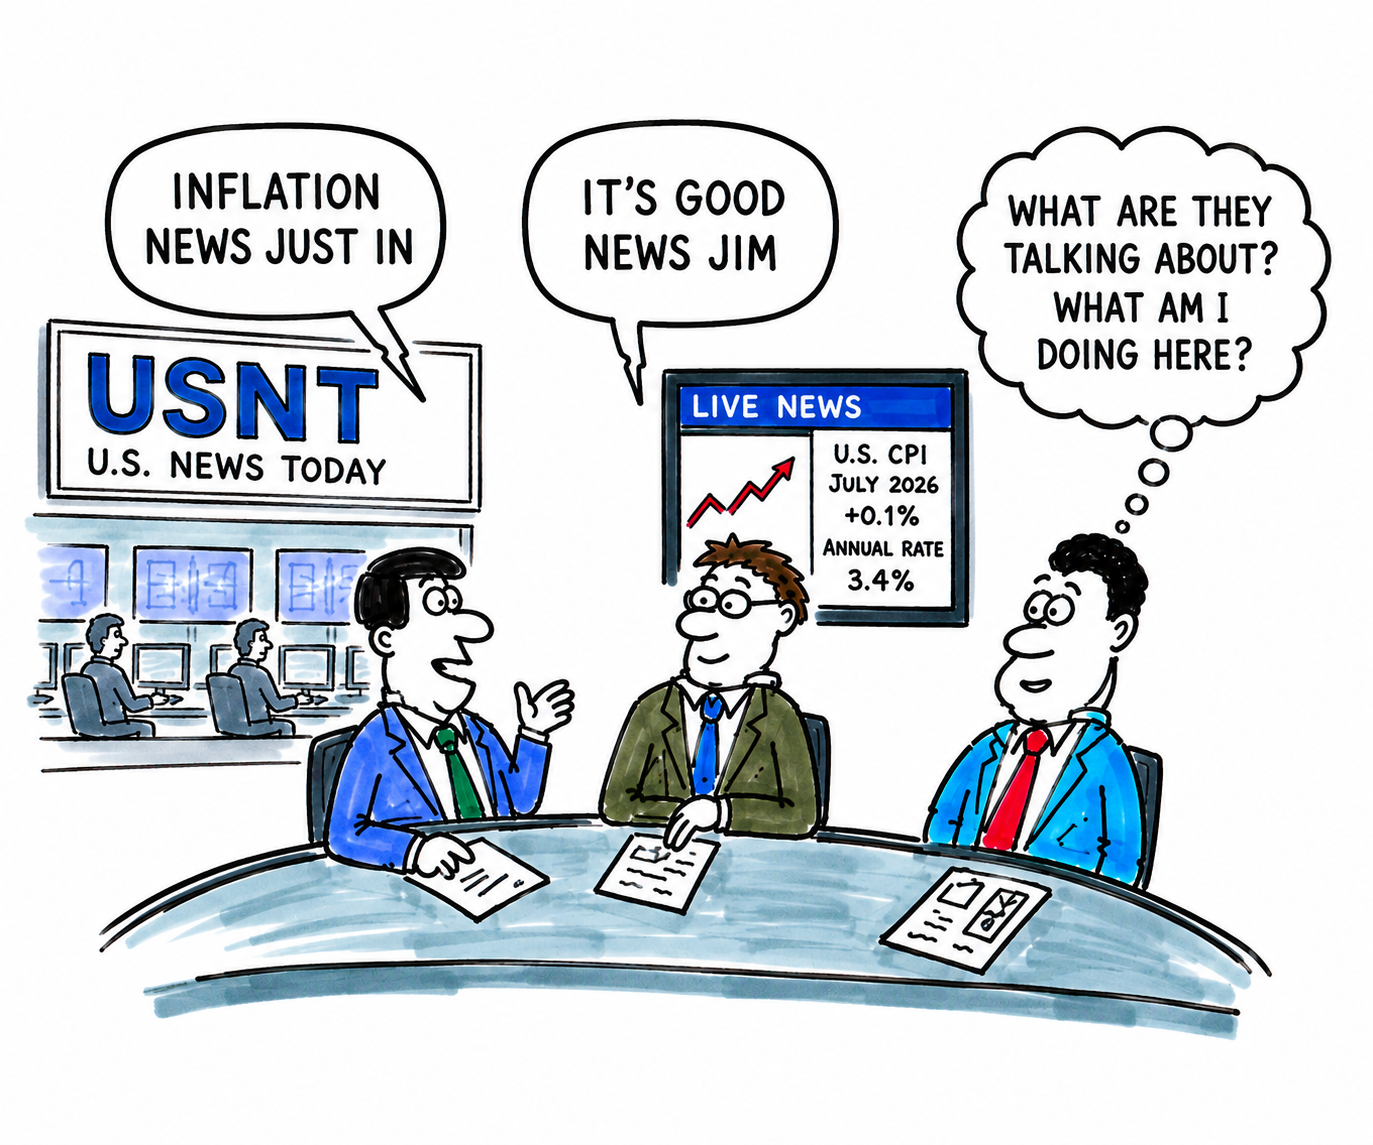
U.S. inflation offered investors some modest reassurance in July 2026, with consumer prices rising just 0.1% during the month, exactly in line with economists’ expectations.
The increase left annual inflation at 3.4%, down slightly from 3.5% in June.
The figures suggest that inflationary pressures are continuing to ease, although perhaps not quickly enough for the Federal Reserve to declare victory.
Core inflation
Core inflation, which excludes volatile food and energy prices, increased 0.2% during July 2026 and stood at 2.5% annually. Falling energy costs helped restrain the headline figure, while shelter and food prices recorded modest increases.
For Wall Street, the absence of an inflationary surprise was broadly welcome. Investors have become particularly sensitive to inflation data because of its implications for Federal Reserve interest-rate policy.
A stronger-than-expected figure could have revived fears that rates would need to remain higher for longer.
Flexibility
Instead, the relatively subdued reading leaves the Fed with greater flexibility. U.S. markets largely shrugged off the report, suggesting much of the result had already been priced into shares.
Technology and other growth stocks could benefit if U.S. inflation continues to moderate, since lower bond yields and expectations of easier monetary policy generally make their future earnings more attractive.
However, 3.4% inflation remains comfortably above the Federal Reserve’s 2% objective. Investors therefore have reason for optimism, but not complacency.
For U.S. stocks, July’s message was encouragingly simple: inflation is cooling, but the battle is not over.
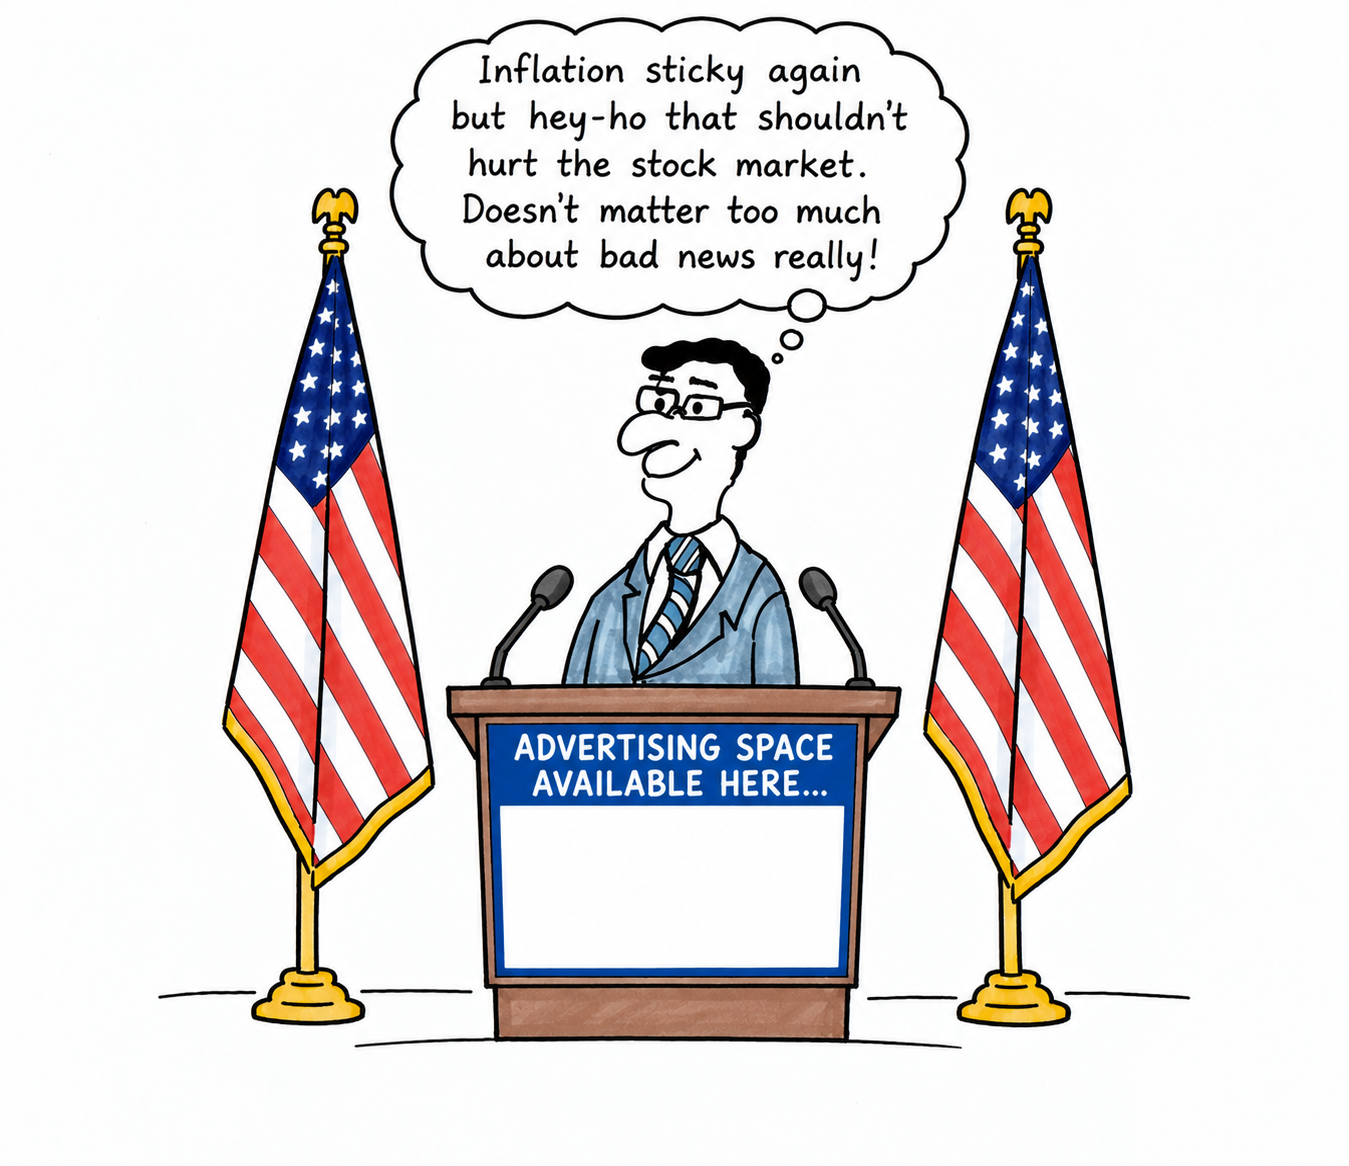
But it appears this AI driven market doesn’t seem to care about any news at the moment.
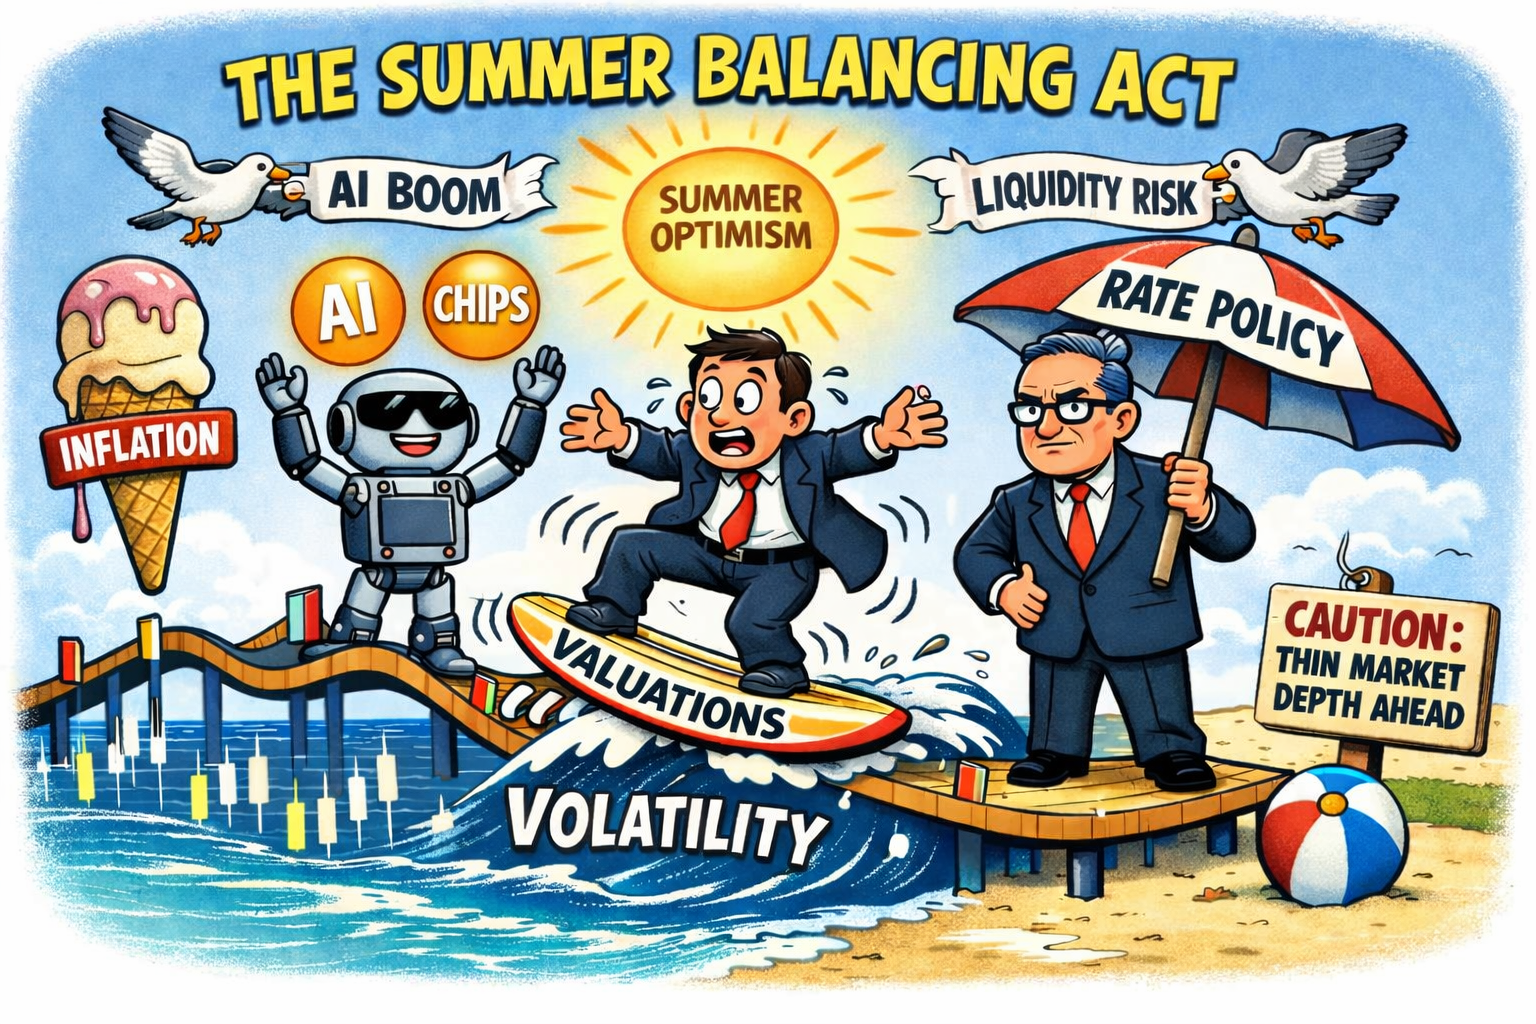
The probability of a summer correction in US equities is high
U.S. stocks have entered the summer with a confident stride, buoyed by softer inflation data and a fresh wave of enthusiasm for AI and Chip linked earnings.
Futures are rising, headlines are upbeat, and investors appear convinced that the worst of the tightening cycle is behind them.
Foundation
Yet beneath the surface, the market’s foundations look increasingly uneven — and that imbalance is precisely what makes a seasonal correction more likely than many expect.
The latest market action shows how sentiment can be shaped by single data points. A “soft inflation reading” has lifted futures, encouraging hopes of a gentler Federal Reserve.
But this sits awkwardly alongside the Fed’s own messaging: Chair Warsh has openly pledged a “regime change” in policy to eliminate the inflation “tax” on households, a stance that hardly suggests imminent easing.
When monetary policy becomes less predictable, equity valuations — especially in tech — become more vulnerable.
Leaders & Losers
At the same time, leadership in the market has narrowed dramatically. AI‑exposed names continue to surge, with ASML jumping more than 7% after raising its sales forecast again.
CrowdStrike, Goldman Sachs and Palo Alto Networks are among the recent biggest movers. Yet the other end of the tape tells a different story: IBM has suffered a record 25% plunge, Biogen is down sharply, and several consumer‑facing names are showing unusual volume on steep declines.
This split between winners and laggards is characteristic of late‑cycle behaviour.
Seasonally, July and August are already the market’s weakest stretch. Liquidity thins, volatility picks up, and geopolitical risks — from Middle East tensions to Europe’s drone‑driven defence pivot — add further instability.
Too Bullish
Even Bank of America warns that investors are “too bullish” heading into summer.
Put together, the picture is clear: optimism may dominate the headlines, but the underlying market structure suggests a correction is not only possible — it is increasingly probable.
What the latest evidence shows
The search results give a very clear picture: market structure is weakening beneath headline highs, and several institutions are openly warning about a summer drawdown.
1. Breadth collapse (the biggest red flag)
Sources show the S&P 500’s rally is being carried by a tiny handful of AI mega‑caps:
Median S&P 500 stock is 13% below its 52‑week high even as the index hits records.
Equal‑weight S&P 500 is down ~1% while the cap‑weighted index is up double digits.
Semiconductors +30%, Magnificent 7 +10%, “everything else on the curb.”
This is classic late‑cycle behaviour. Historically, this level of narrowness precedes larger‑than‑average drawdowns over 6–12 months (Goldman Sachs cited).
2. Technical overextension
Multiple sources highlight:
RSI above 70 for weeks (overbought).
Negative divergence: price makes new highs, RSI makes lower highs — seen at 2018, 2020, 2021 tops.
VIX at long‑term lows and “set up for a bullish swing,” which usually means S&P 500 downside.
3.Seasonality: worst window of the year
Summer (July–August 2026) is historically the weakest period for US equities due to:
Low liquidity
Higher volatility
Higher probability of corrections
This is explicitly flagged in multiple sources.
4.Fed uncertainty
The new Fed Chair (Warsh/Walsh) has taken a hawkish stance, removing forward guidance and signalling possible rate hikes:
Markets now price a 60% chance of a hike in October.
Higher rates → lower valuations → tech most exposed.
Liquidity contraction is also highlighted as the biggest near‑term risk (Morgan Stanley).
5.Institutional forecasts
Bank of America: warns of a 6% summer correction.
MarketBeat: warns of a potential 20% correction in H2 2026 (less consensus and unlikely, but notable).
Real Investment Advice: says risk is “stacking up” with breadth collapse + worst seasonal window + political cycle.
Are we facing a correction?
Yes — the probability is high likely. The convergence of:
collapsing breadth
overbought technicals
seasonal weakness
Fed uncertainty
narrow AI‑driven leadership
…makes a summer correction the base case, not an outlier.
The most credible range is –6% to –10%, with tail‑risk scenarios pointing deeper.
What matters most for the next 4–8 weeks (Summer 2026)
Watch VIX — a spike will confirm the correction.
Watch oil prices — a rebound could reignite inflation and force Fed tightening.
Watch semiconductors — they’re the rally’s spine; any wobble cascades.
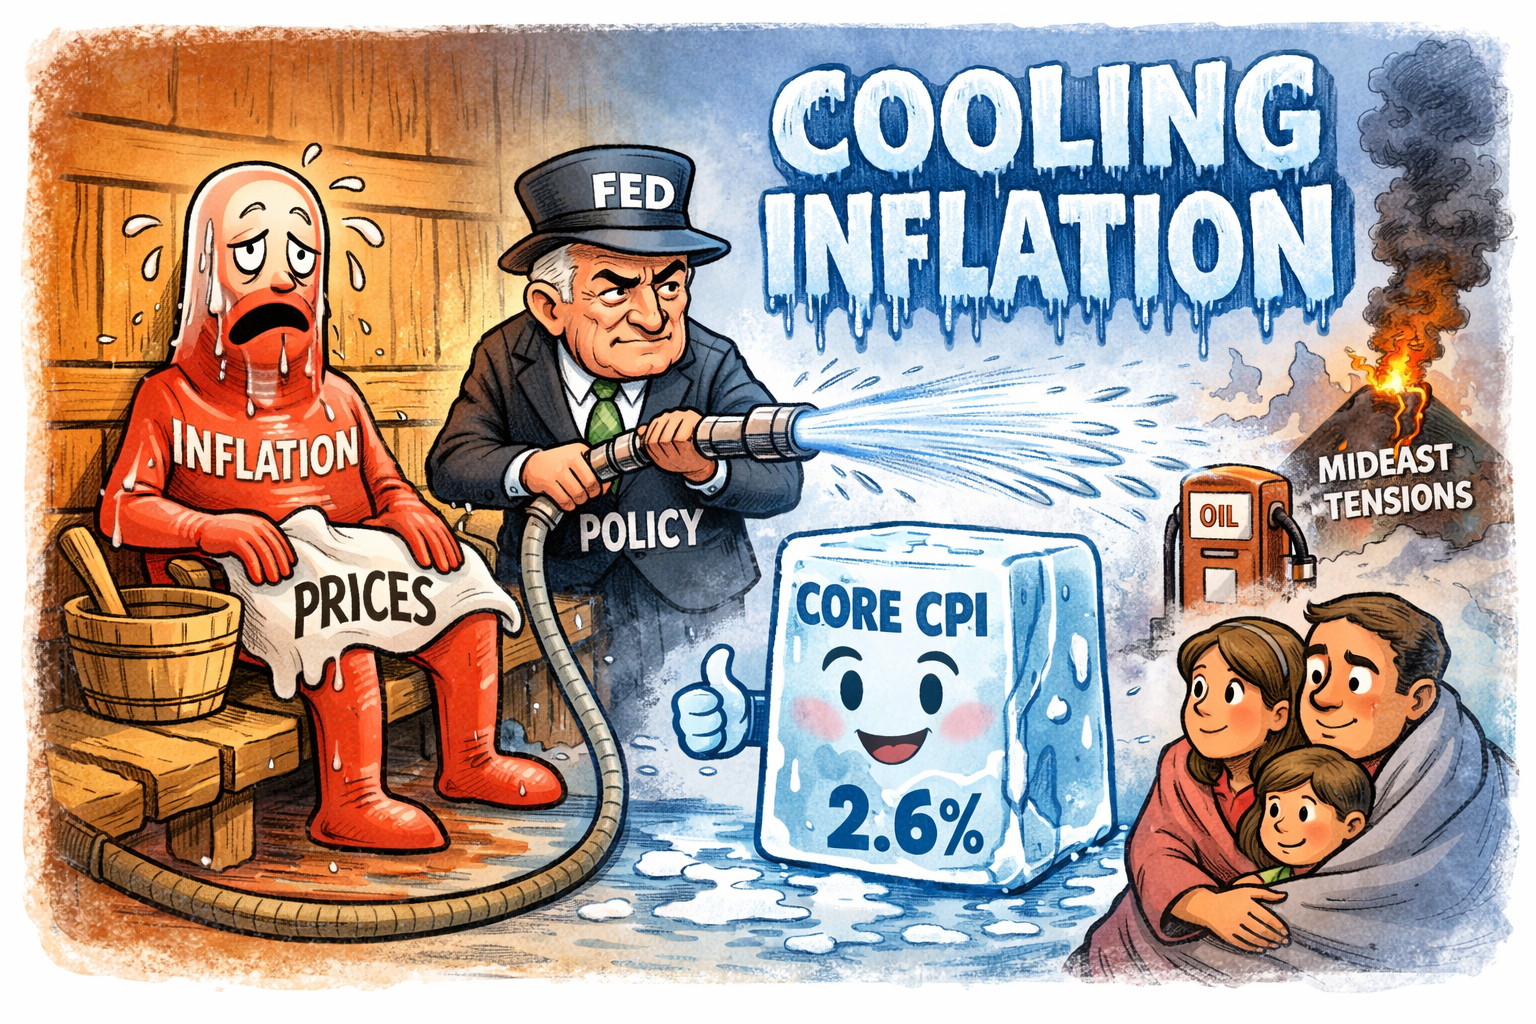
U.S. June’s 2026 U.S. inflation report showed an unexpected cooling, with headline CPI dropping 0.4% month‑on‑month and annual inflation easing to 3.5%, driven almost entirely by a steep fall in energy prices.
Core inflation was flat, bringing the yearly core rate down to 2.6%.
Why this report mattered
This was the final major inflation release before the Fed’s late‑July meeting. Markets had expected a softer print, but the scale of the energy‑driven decline surprised forecasters.
The underlying trend (flat core inflation) suggests cooling, but geopolitical risks mean July’s 2026inflation could rebound.
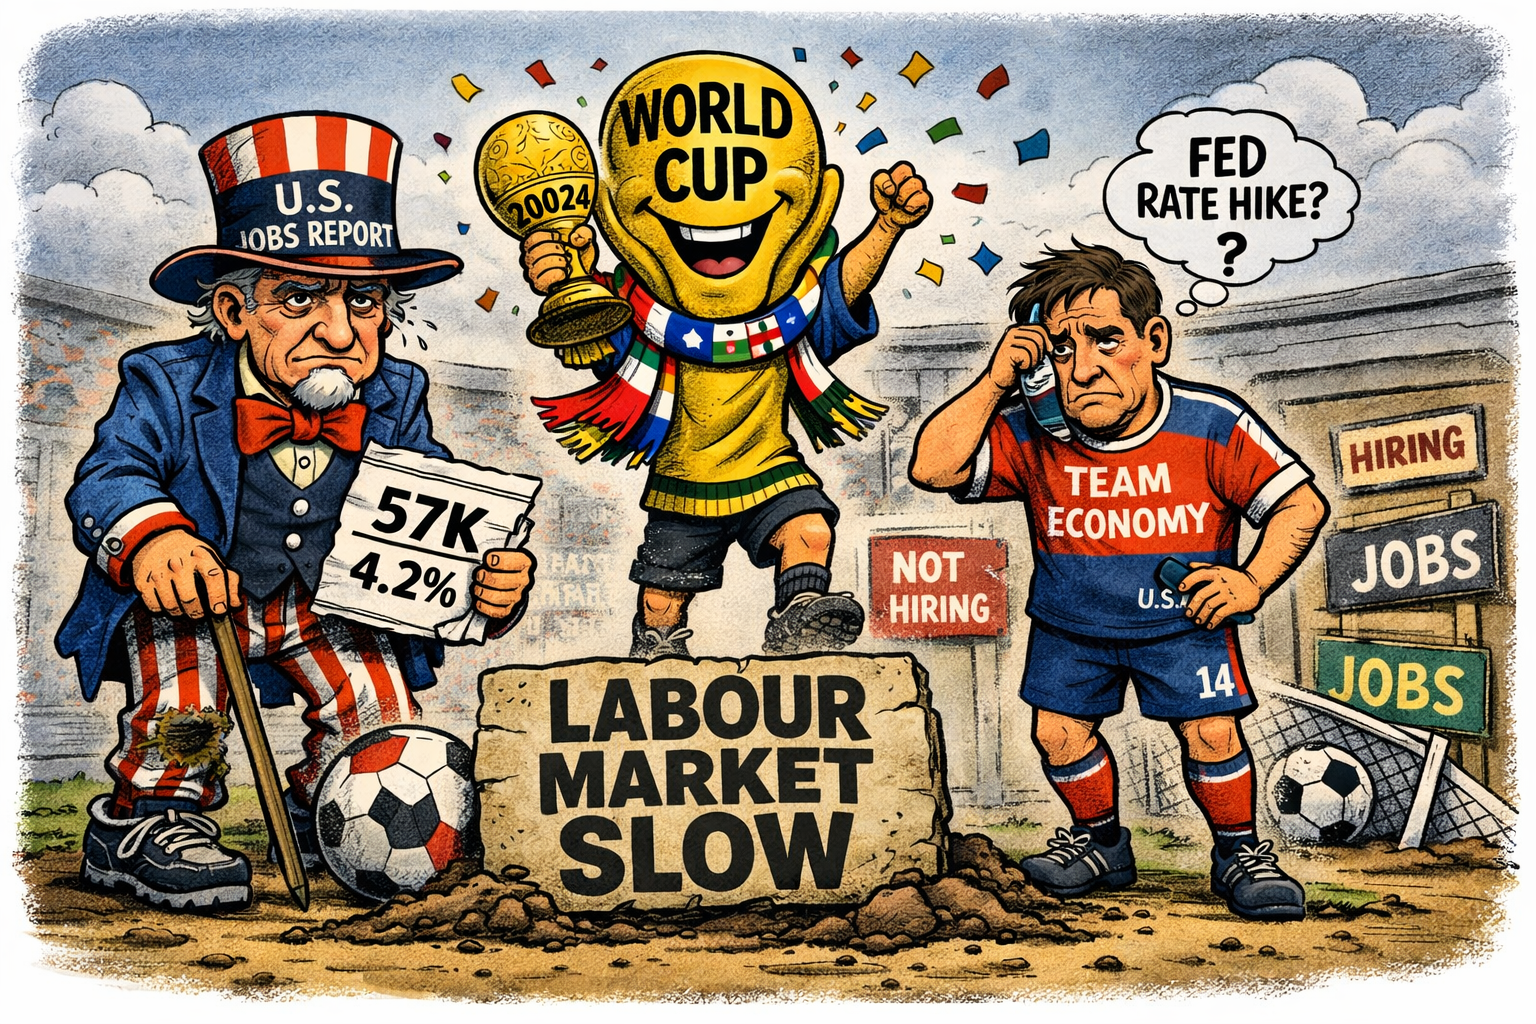
The latest U.S. jobs report underscored a clear cooling in labour market momentum, with June’s 2026 nonfarm payrolls rising by just 57,000, well below economists’ expectations and marking the weakest gain in four months.
And this despite an expected job boost as the U.S. hosts a highly successful record-breaking Football World Cup.
Although the headline unemployment rate dipped to 4.2%, this improvement was largely cosmetic: the labour force participation rate fell to 61.5%, its lowest level since March 2021, meaning fewer people were counted as actively seeking work.
Beneath the surface, the household survey painted a more troubling picture. Employment dropped sharply, with 507,000 fewer people reporting they were at work, and revisions to earlier months erased 74,000 previously reported jobs — undercutting the narrative of springtime strength.
Leisure and hospitality suffered a notable setback, shedding 61,000 positions, while gains were concentrated in a narrow band of sectors: professional and business services (+36,000), social assistance (+25,000), and healthcare (+22,000).
Financial markets reacted cautiously, with investors trimming expectations of a Federal Reserve rate rise in September 2026.
Overall, the data reportedly suggests a labour market losing steam, shaped more by statistical quirks and workforce exits than by genuine economic resilience.
United Kingdom – Latest Data This Week to June 19th 2026
Labour market:
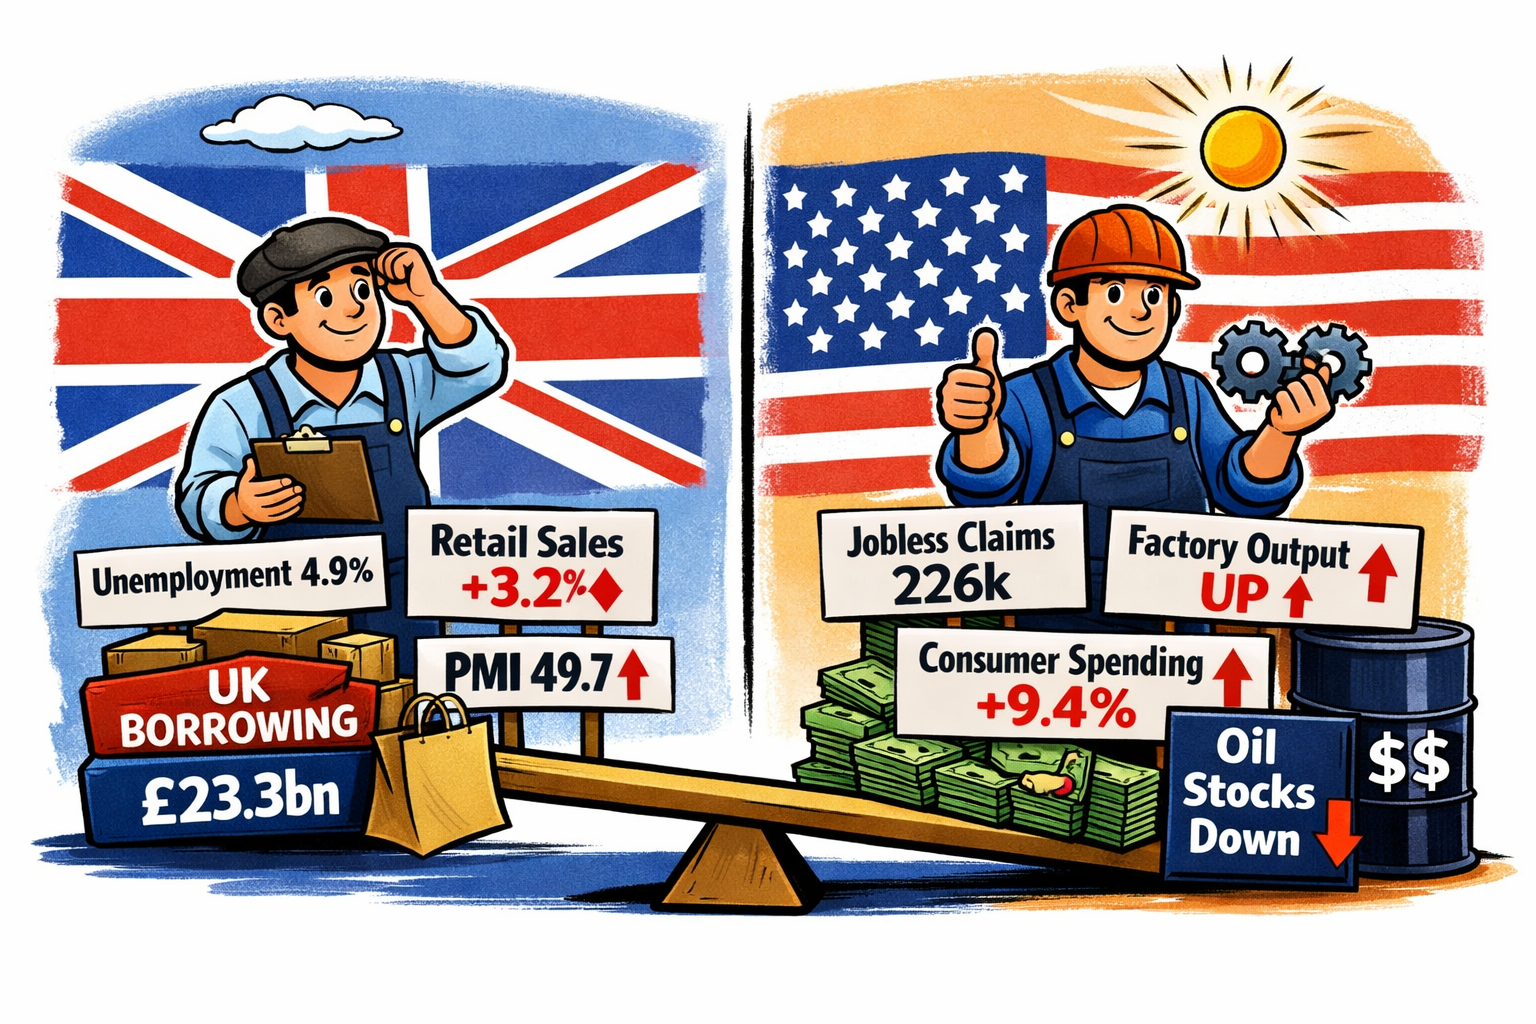
The UK unemployment rate for April 2026 held at 4.9%, slightly below the previous 5% reading. Average earnings including bonuses grew 4.4%, while earnings excluding bonuses rose 3.4%. Employment increased by 100,000 in April, although HMRC payrolls for May showed only a marginal +2,000 change.
Retail sales:
Retail sales rebounded strongly in May 2026, rising 1.2% month‑on‑month and 3.2% year‑on‑year, reversing April’s declines. Retail sales excluding fuel also rose 1.2% MoM and 4.6% YoY.
Public finances:
Public sector net borrowing (excluding banks) came in at £23.3bn in May, slightly worse than April’s revised figure.
Business activity:
Flash PMIs for June show mixed momentum:
Manufacturing PMI: 53.9 (expansion)
Services PMI: 49.3 (contraction)
Composite PMI: 49.7 (borderline contraction) These readings suggest the UK economy is losing some pace heading into summer.
United States – Latest Data This Week to 19th June 2026
Labour market:
Initial jobless claims for the week ending 13th June 2026 fell slightly to 226,000, broadly in line with expectations. Continuing claims rose to 1.81 million, indicating some softening in labour market conditions.
Manufacturing & business surveys:
The Philadelphia Fed Manufacturing Index jumped to 10.3 in June from –0.4, signalling a notable improvement in factory activity.
The S&P Global flash PMIs for June show:
Manufacturing: 55.1 (solid expansion)
Services: 50.7 (modest expansion)
Composite: 51.5 (steady growth) These point to a resilient US private‑sector backdrop.
Housing & consumer indicators:
Mortgage rates eased slightly, with the 30‑year rate dipping to 6.47%.
Redbook retail sales rose 9.4% YoY, suggesting firm consumer spending.
Capital flows & energy:
Net long‑term TIC flows for April registered $103.1bn, indicating strong foreign demand for US assets.
API data showed a sharp –8.33 million barrel draw in crude oil stocks, hinting at tighter near‑term supply.
Overall Pictures for UK and U.S.
UK: A mixed week — labour market steady but softening at the margins; retail sales surprisingly strong; PMIs signalling a mild loss of momentum; public borrowing still elevated.
US: Data broadly stronger — manufacturing rebounded, services steady, jobless claims stable, and consumer spending indicators show firm.
The European Central Bank jolted markets yesterday with its first interest‑rate increase since 2023, a move driven by renewed energy‑price pressures linked to the U.S./Iran conflict.
Policymakers signalled that the surge in wholesale gas and oil costs is feeding back into euro‑area inflation, forcing a return to tightening after more than two years of stability.
Investors had expected a cautious stance, but the ECB argued that delaying action risked inflation becoming embedded again, particularly in energy‑sensitive economies such as Germany and Italy.
The decision pushed bond yields higher across the bloc and strengthened the euro, reflecting expectations of a more hawkish path through the summer.
UK Lacklustre Growth
In the UK, fresh GDP data released by the ONS for April 2026 offered a more mixed picture. The economy expanded modestly, continuing the fragile recovery seen earlier in the year, but underlying momentum remains weak.
Services provided the bulk of the growth, while manufacturing and construction were broadly flat.
Economists warn that higher energy prices — the same shock driving the ECB’s decision — could weigh on UK output in the coming months, squeezing household budgets and raising costs for businesses.
Together, the ECB’s shift and the UK’s tentative growth figures underline how vulnerable Europe remains to global energy disruptions.
The UK’s latest run of economic data has delivered a contradictory picture: inflation easing sharply, borrowing surging, and growth outperforming expectations.
Together, the figures show an economy stabilising in some areas while coming under renewed strain in others.
Inflation (CPI)
April CPI fell to 2.8%, down from 3.3% in March, the lowest rate in nearly three years.
The drop was driven by Ofgem’s April energy price cap, which cut household gas and electricity bills, alongside softer rises in water charges, road tax and several food categories.
But economists warn the relief will be temporary. Wholesale energy prices have risen sharply since the U.S. / Iran conflict escalated, and inflation is expected to climb back above 4% later in the year.
The Bank of England is therefore likely to remain cautious about cutting rates.
Forecast out of sync
Government Borrowing (April 2026) The borrowing picture was far less encouraging. The government borrowed £24.3 billion in April — the highest April figure since 2020 and well above the £20.9 billion forecast by the OBR.
Borrowing was £4.9 billion higher than the same month last year, driven by inflation‑linked increases in benefits, the earnings‑linked rise in the state pension, and record April debt‑interest payments of £10.3 billion in 2026.
Analysts note that this deterioration comes before the full impact of the energy‑price shock is felt, raising concerns about the fiscal outlook for the rest of the year.
Growth
GDP Growth The bright spot came from growth: the economy expanded 0.3% in March 2026, beating expectations of a slight contraction, and delivered 0.6% growth for Q1 — the fastest among G7 countries reporting so far.
However, the ONS highlights that much of March’s strength reflected “front‑loading” of spending ahead of expected price rises linked to the Iran war, suggesting momentum may fade as higher energy and fuel costs feed through.
This data comes as the global economy waits for the full impact of the U.S. / Iran conflict to unravel.
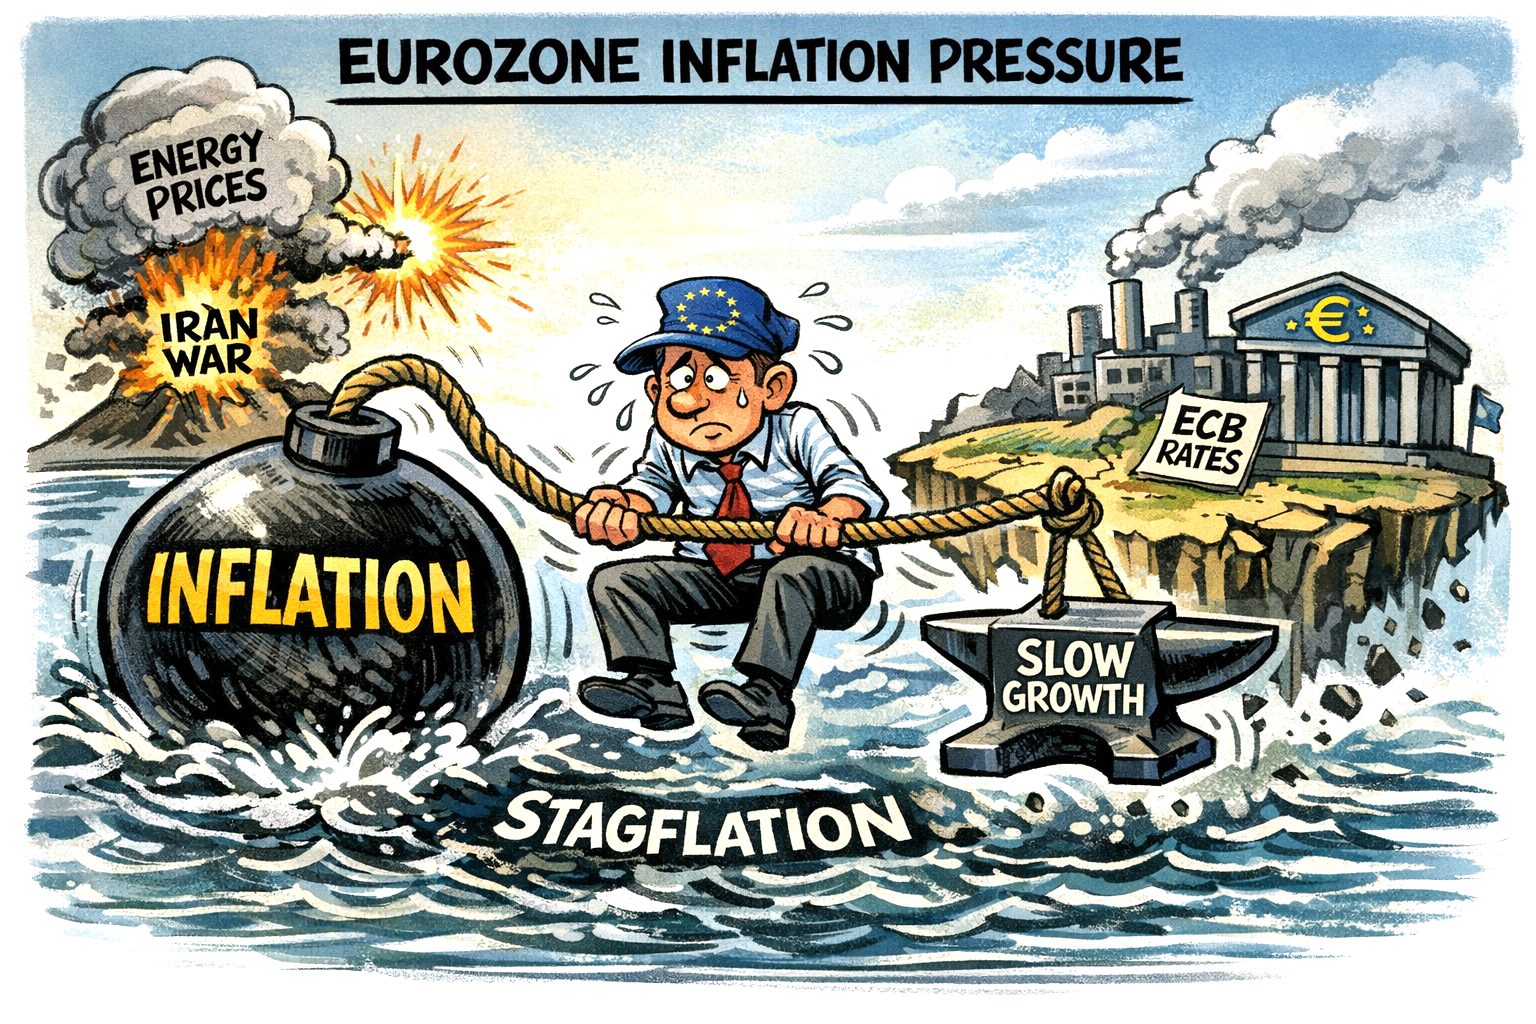
Euro zone inflation accelerated sharply in April 2026, rising to 3%, as the bloc’s economy barely grew — a combination that deepens fears of a stagflationary year.
The latest flash estimate from Eurostat shows headline inflation climbing from 2.6% in March, driven overwhelmingly by surging energy costs linked to the U.S./Iran war and the ongoing disruption in the Strait of Hormuz.
Energy
Energy inflation jumped to 10.9%, more than double the previous month’s rate, underscoring how exposed the currency bloc remains to external supply shocks.
Core inflation, however, edged down to 2.2%, offering a small reassurance that second‑round effects — wage‑price spirals — have not yet taken hold.
Growth was anaemic. First‑quarter GDP expanded by just 0.1%, reflecting weak industrial output, fragile consumer confidence, and higher input costs for businesses.
Stagnation
Economists warn that the combination of rising prices and near‑stagnant activity risks pushing the region into a period of low‑growth, high‑inflation pressure.
The figures land just ahead of the European Central Bank’s policy meeting. With inflation above target but growth faltering, the ECB faces a difficult balancing act.
Policymakers are widely expected to hold rates at 2%, wary that tightening into a supply‑driven shock could deepen the slowdown.
For now, the data reinforce a picture of a euro zone squeezed by global energy turmoil and struggling to regain momentum.