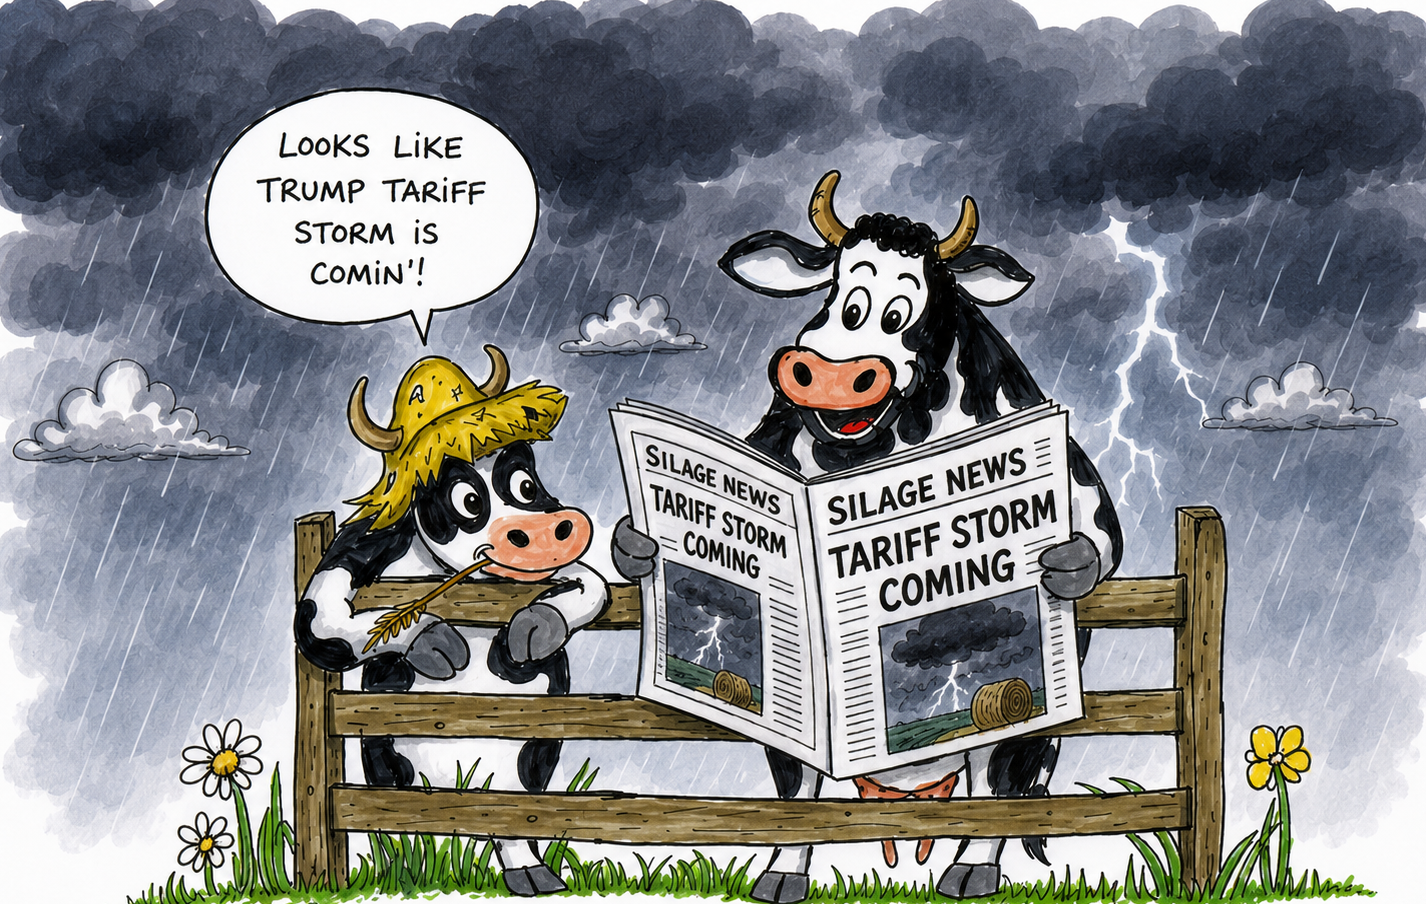
President Donald Trump’s newest tariff onslaught is not simply a reprise of his earlier trade offensives; it represents a structural shift in how the White House intends to wield tariffs as a long‑term economic instrument.
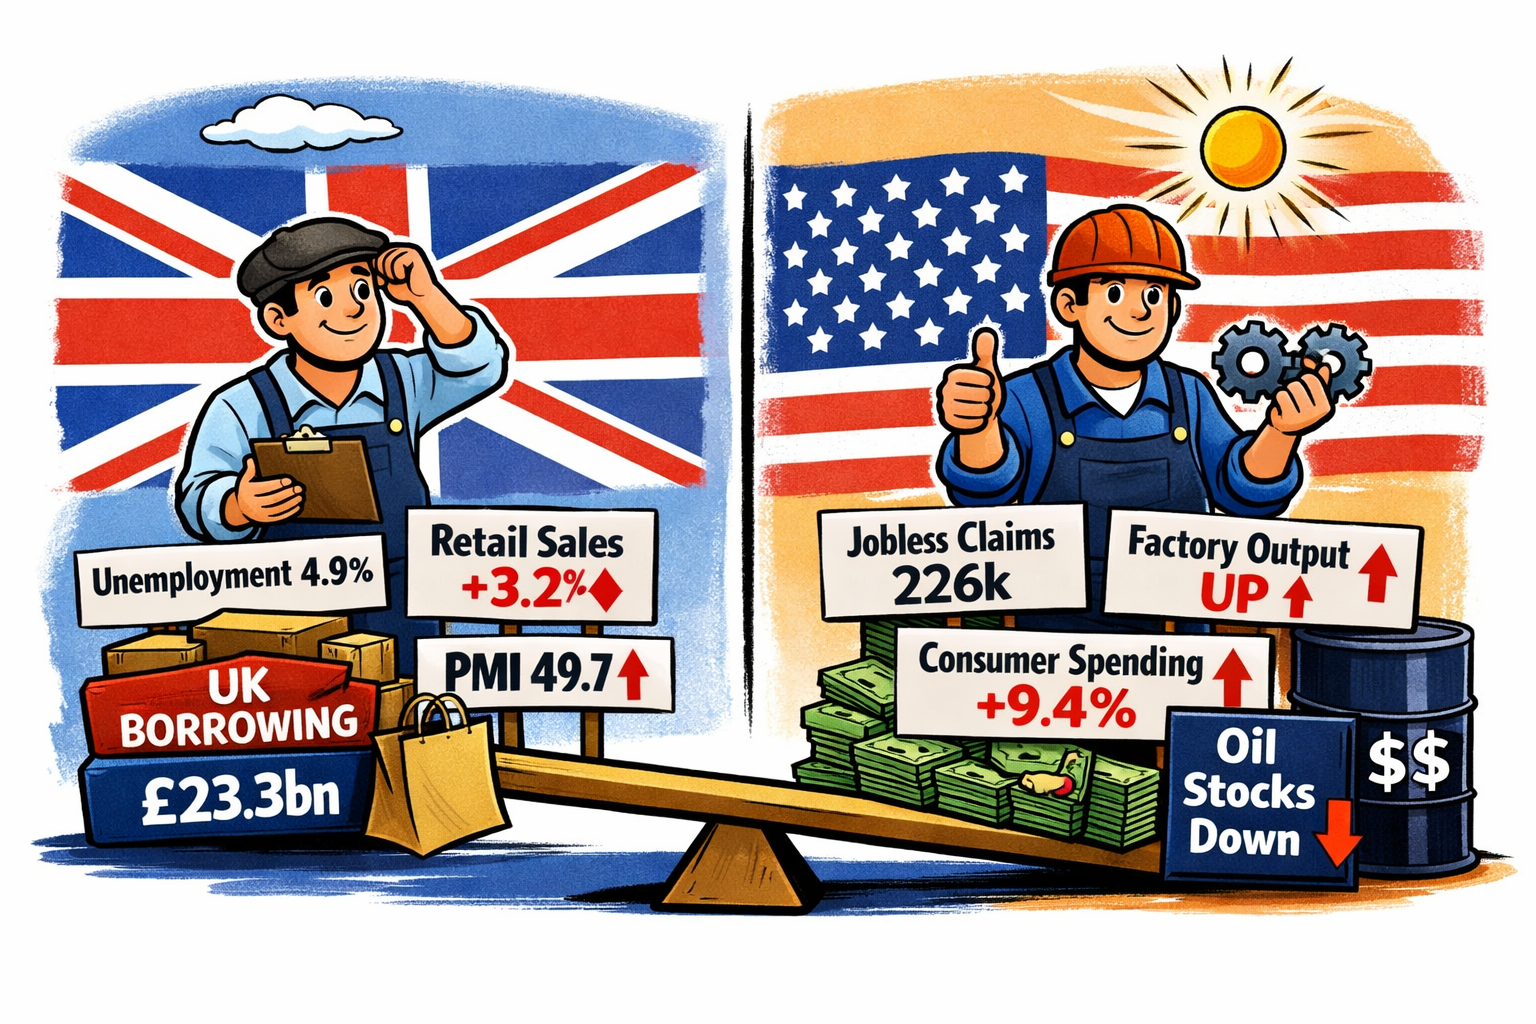
The administration has imposed fresh duties of 10% to 12.5% on 60 trading partners, including the EU, China, the UK and Canada.
Unlike the shock‑and‑awe “Liberation Day” tariffs of 2025, this latest round landed with muted market reaction — not because the measures are trivial, but because the global backdrop has changed dramatically.
Compounding Inflation
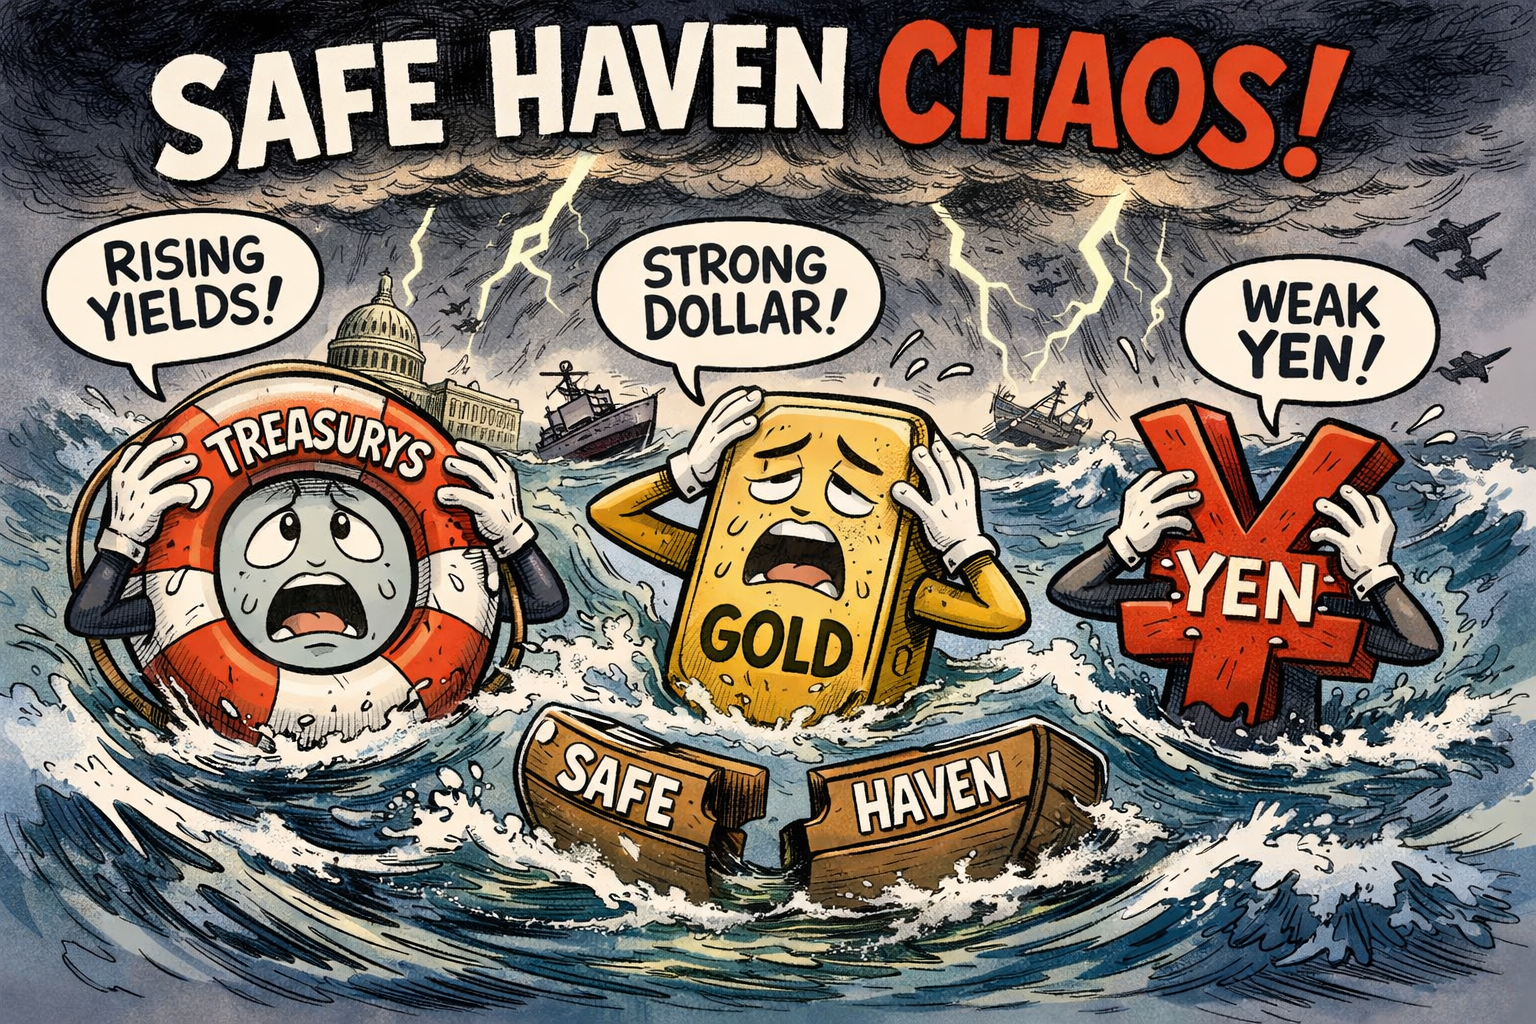
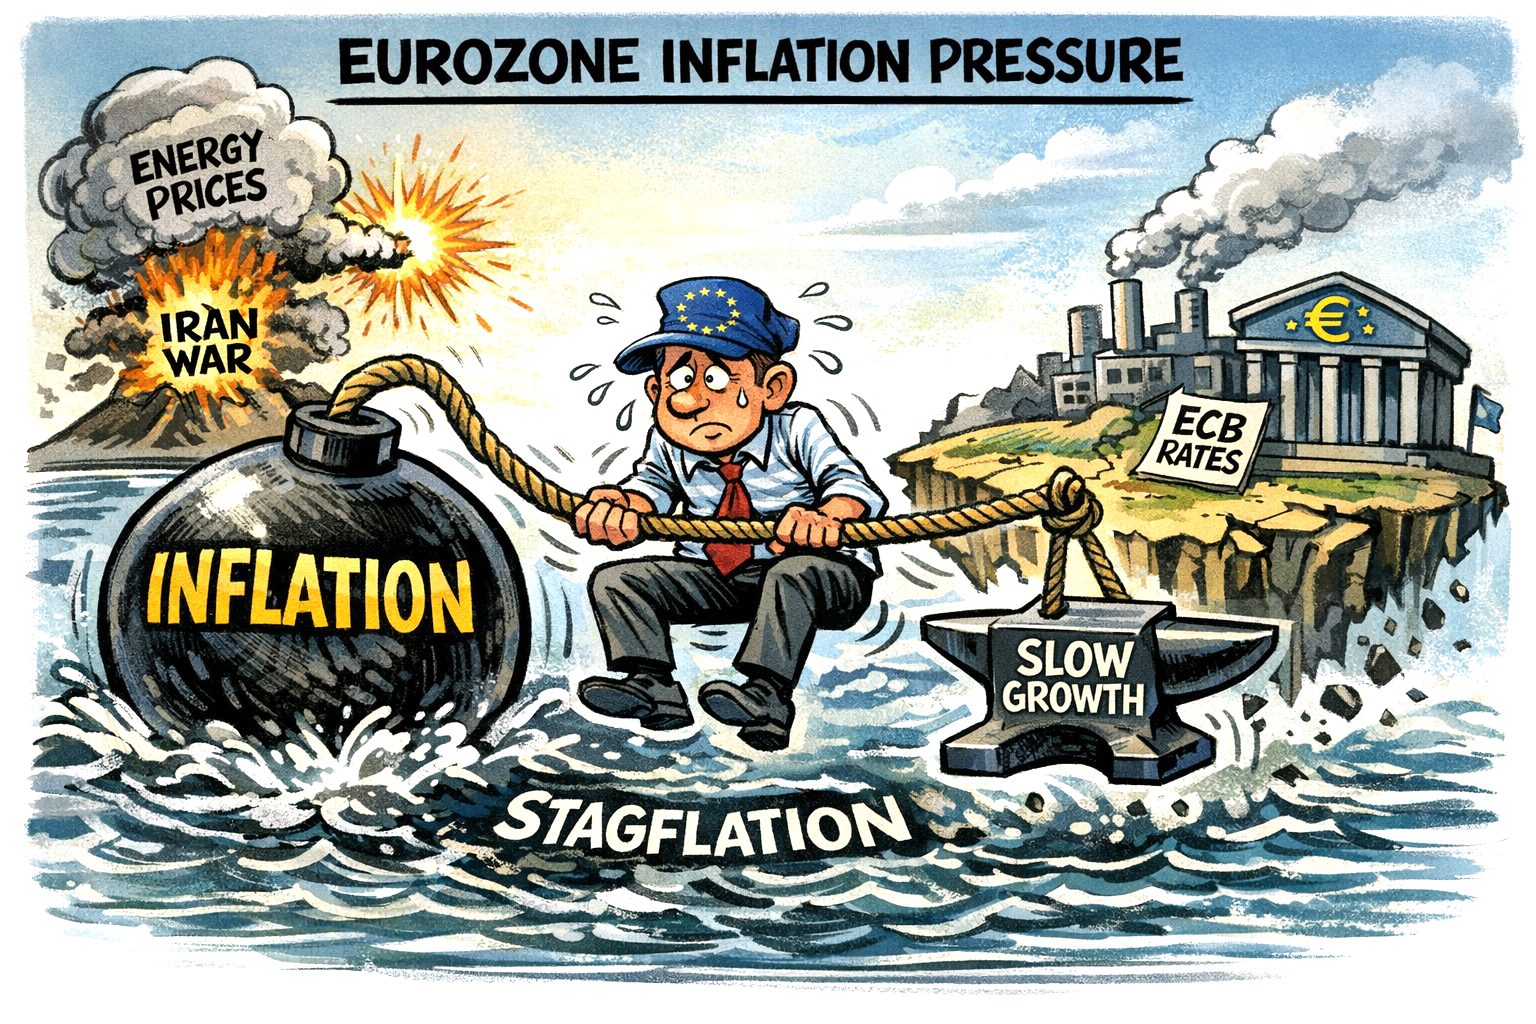
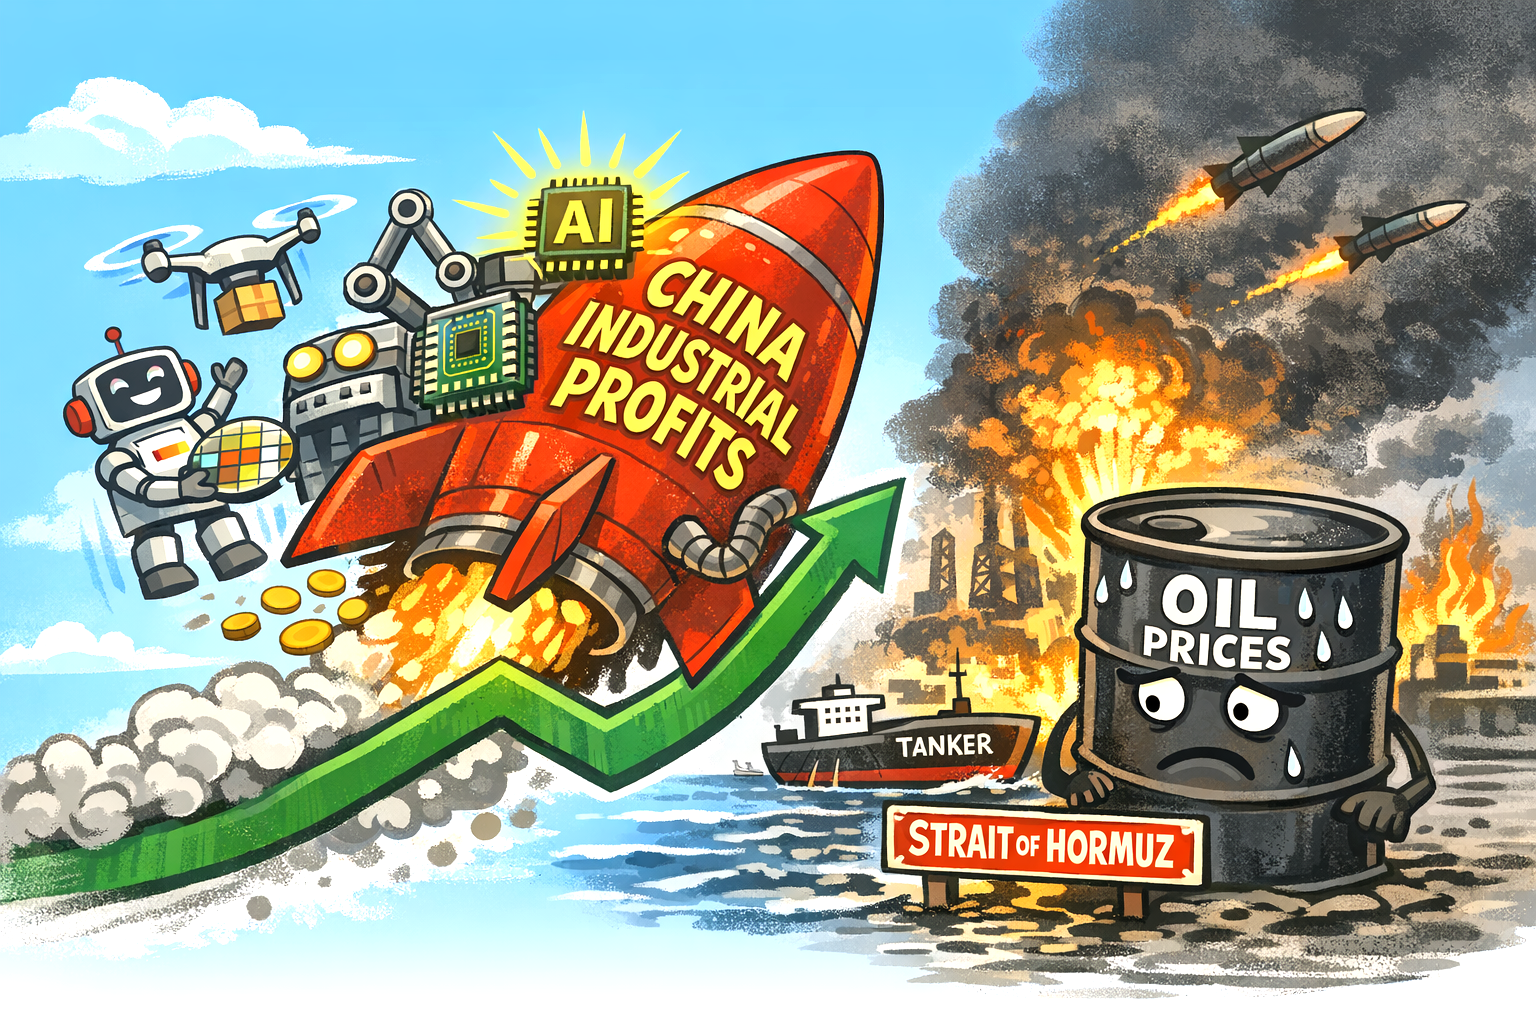
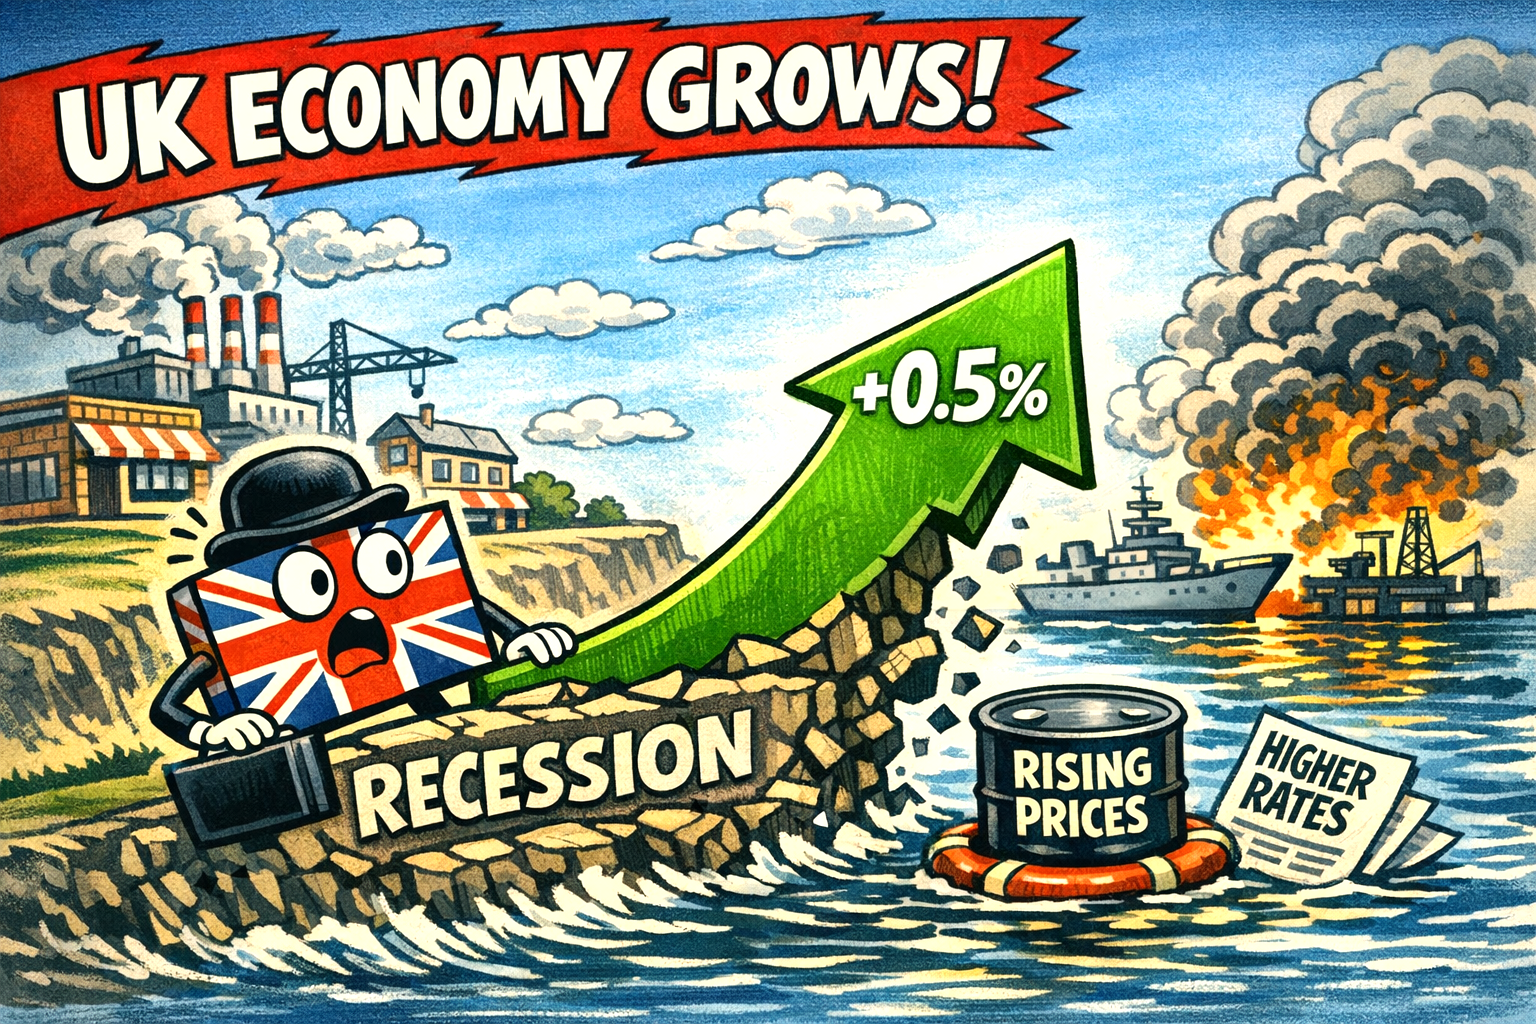
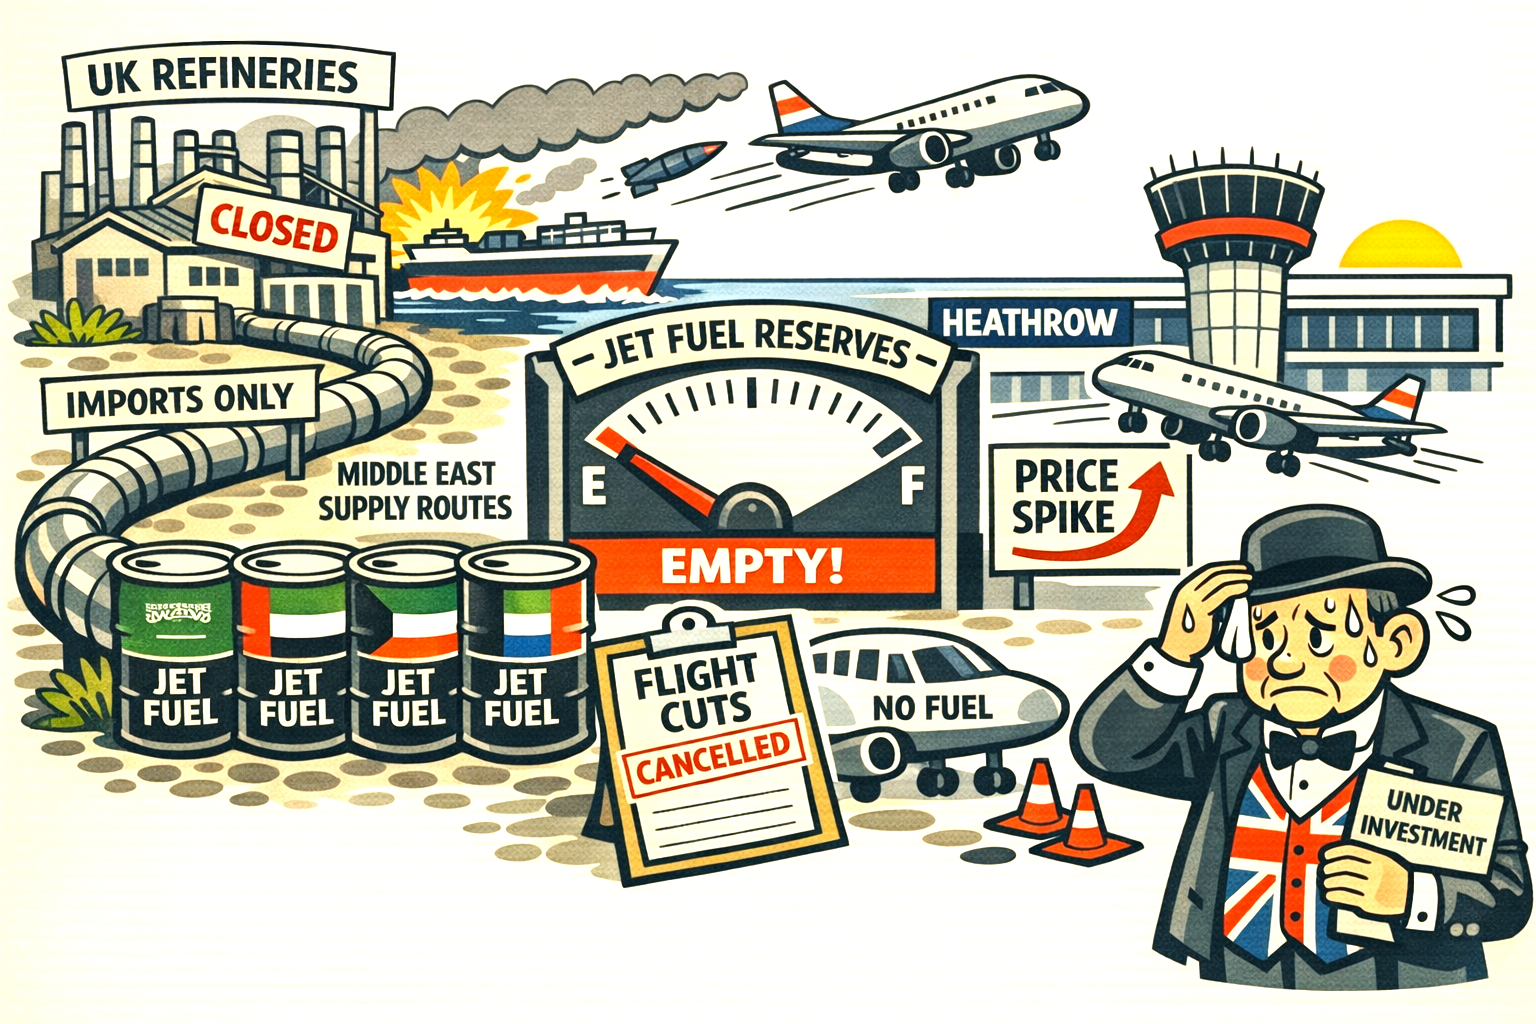
The defining difference is context. Markets are already strained by a prolonged US–Iran conflict, an energy shock pushing oil above $100, and persistent supply chain bottlenecks.
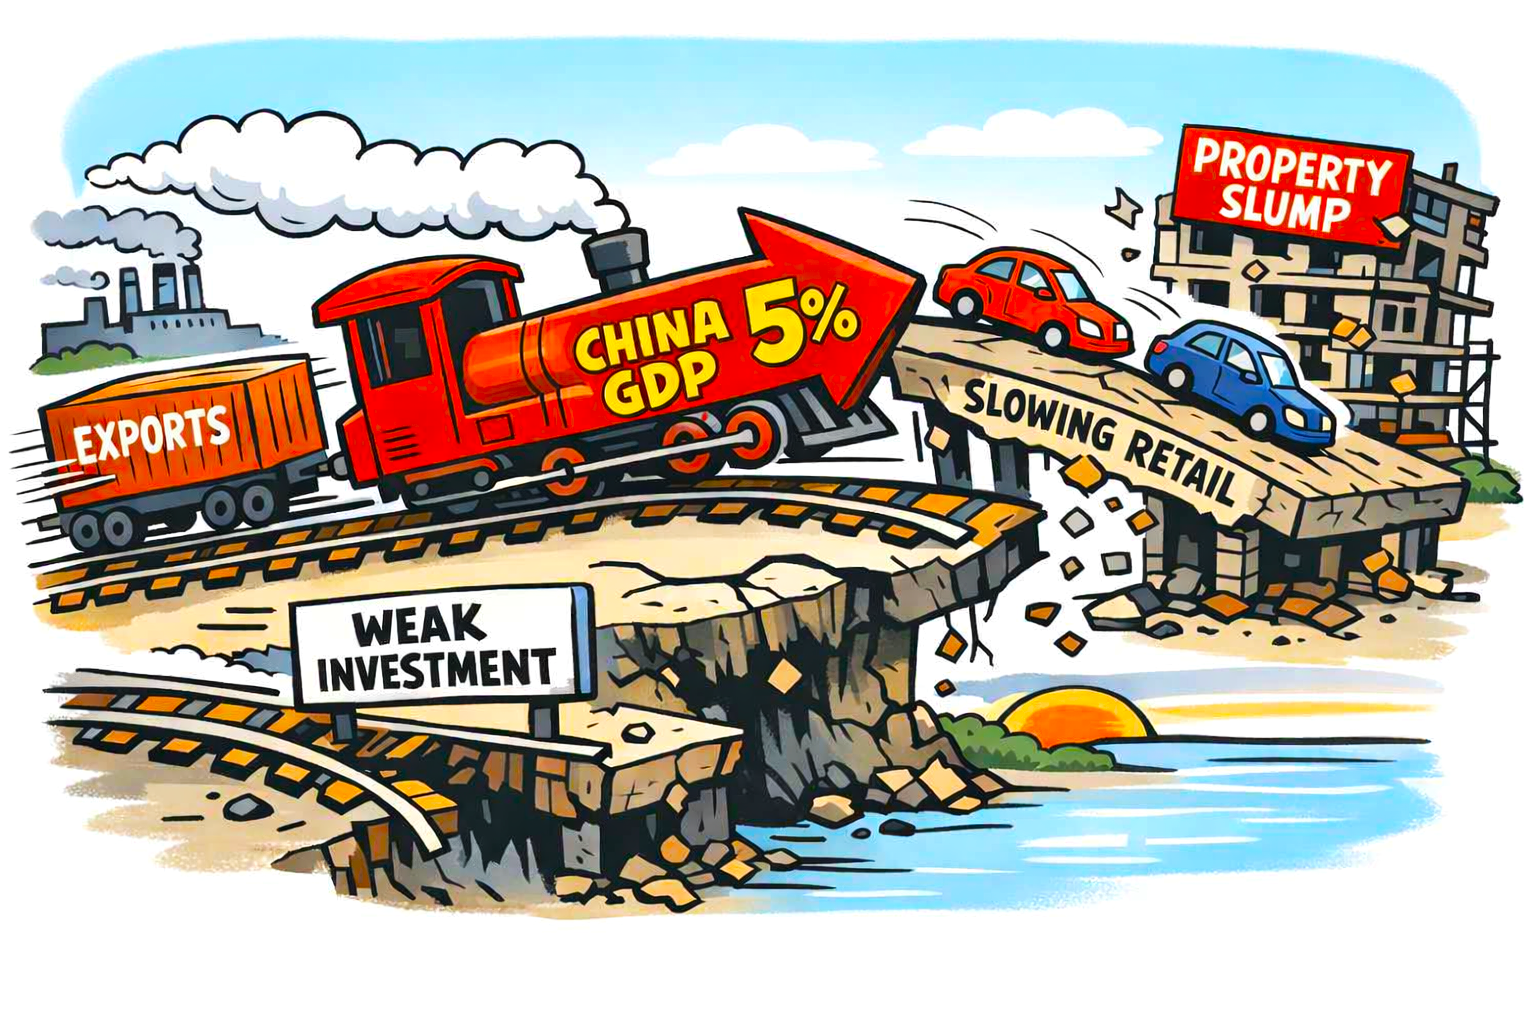
In this environment, tariffs no longer arrive as a standalone geopolitical gambit; they compound existing inflationary pressures and reinforce expectations of slower global growth.
Analysts warn that the combination of conflict‑driven uncertainty and renewed trade barriers could entrench a low‑growth, high‑inflation regime.
U.S. Supreme Court
The legal foundation has also shifted. After the Supreme Court struck down earlier tariffs, the White House has pivoted to Section 301 of the Trade Act of 1974, citing forced labour concerns.
This move removes the legal vulnerability that previously allowed courts to intervene. As a result, markets must now treat tariffs not as temporary negotiating tools but as potentially permanent features of U.S. economic policy.
Tariff battleground
Investment strategists suggest that other nations may respond cautiously at first, delaying escalation until the full impact becomes clearer.
Yet the broader implication is unmistakable: Trump’s tariff strategy has evolved from episodic salvos into a durable framework.
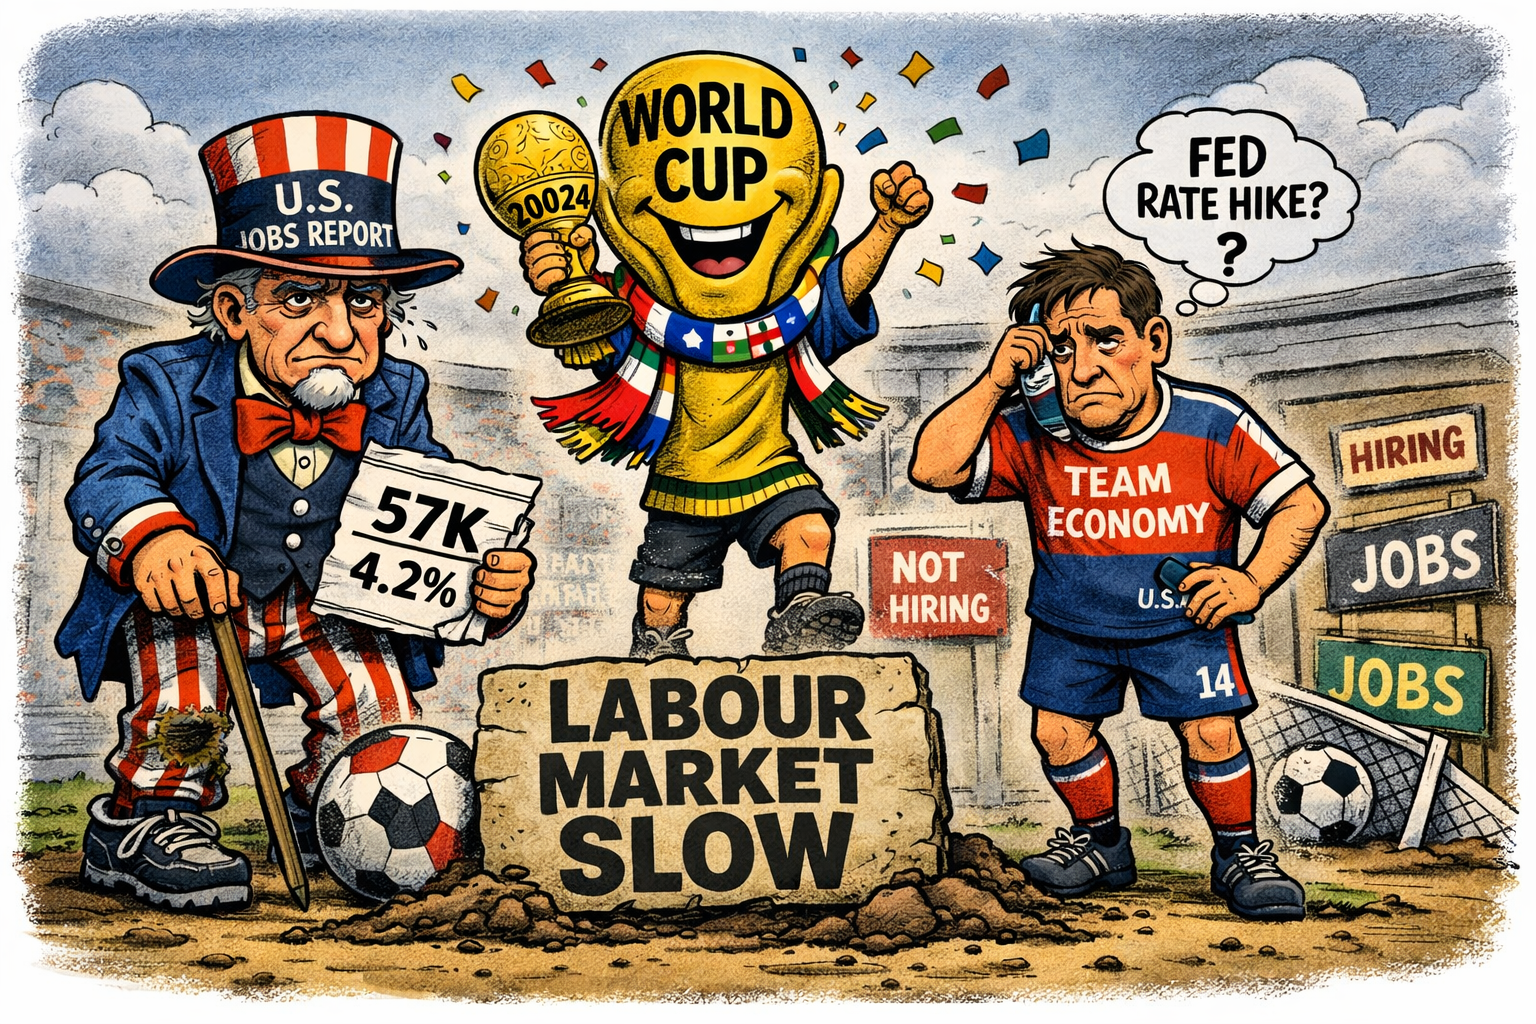
With the Federal Reserve now weighing the inflationary effects of rising oil prices, the tariff onslaught arrives at a moment when global markets can least absorb additional strain.
Trump pauses military strikes on Iran apparently to allow peace talks to resume – let’s see what happens this time.