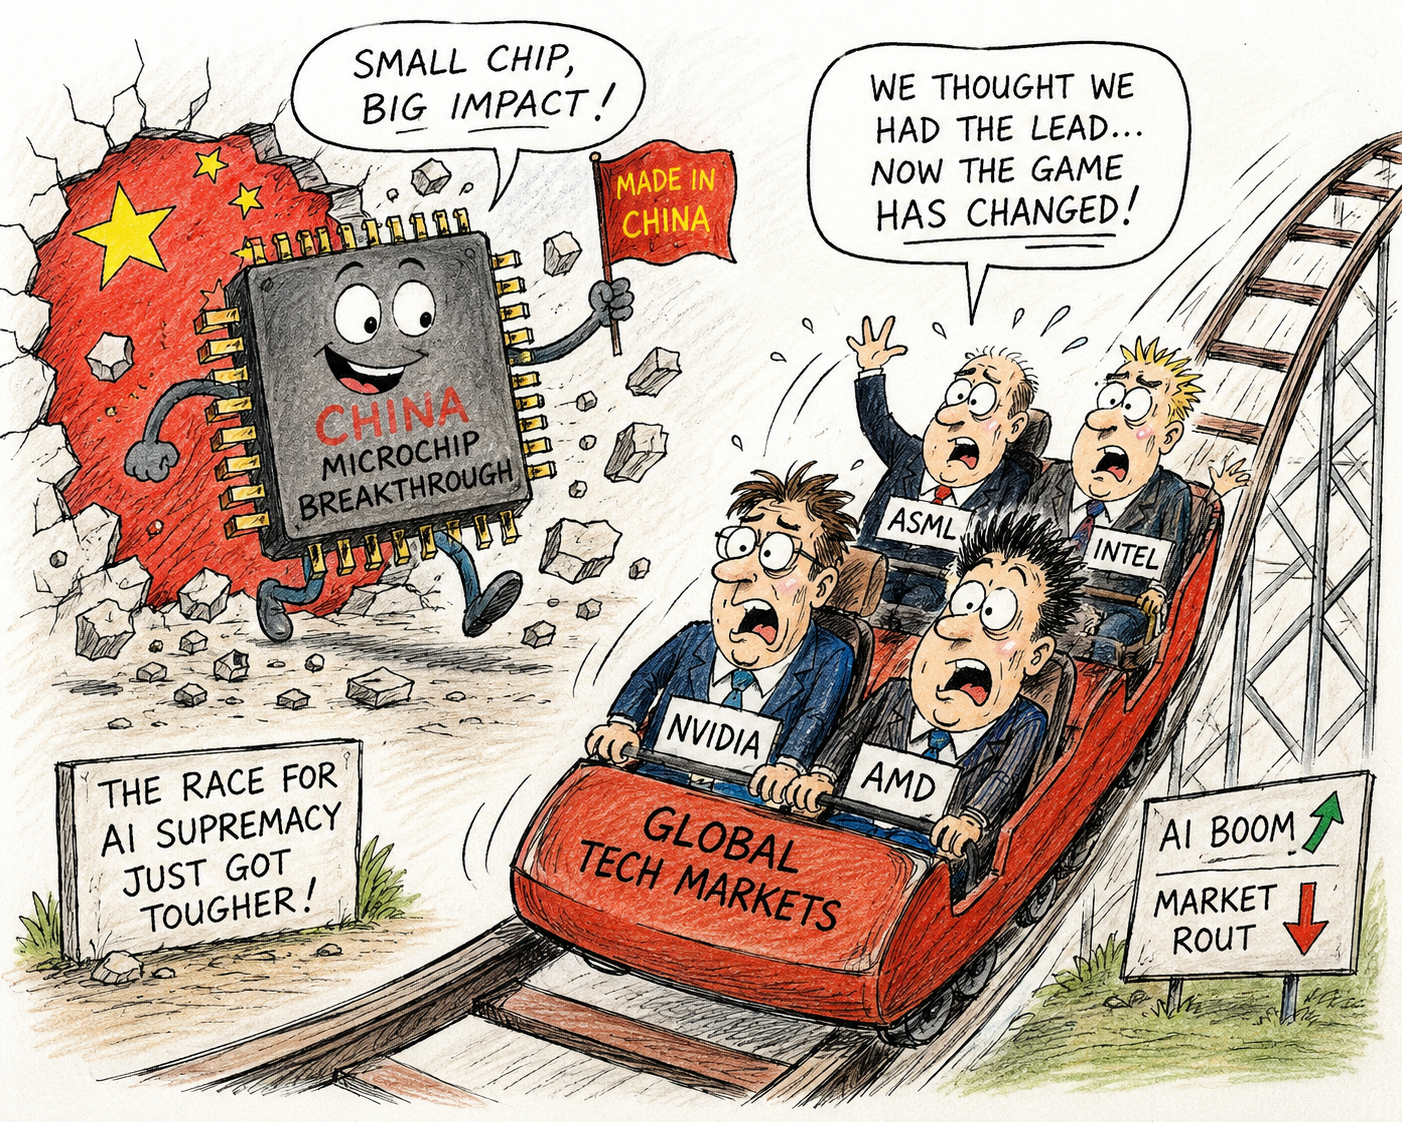
A stunning breakthrough in China’s microchip industry has rattled global technology markets, wiping billions from company valuations and raising fresh questions over who will dominate the next phase of the artificial intelligence revolution.
Western control
For years, Western export controls were expected to slow China’s progress in developing cutting-edge semiconductors – the tiny but powerful processors that sit at the heart of AI systems.
Instead, Chinese engineers appear to have made significant strides, challenging the assumption that the country would remain years behind its international rivals.
Sharp stock sell-off
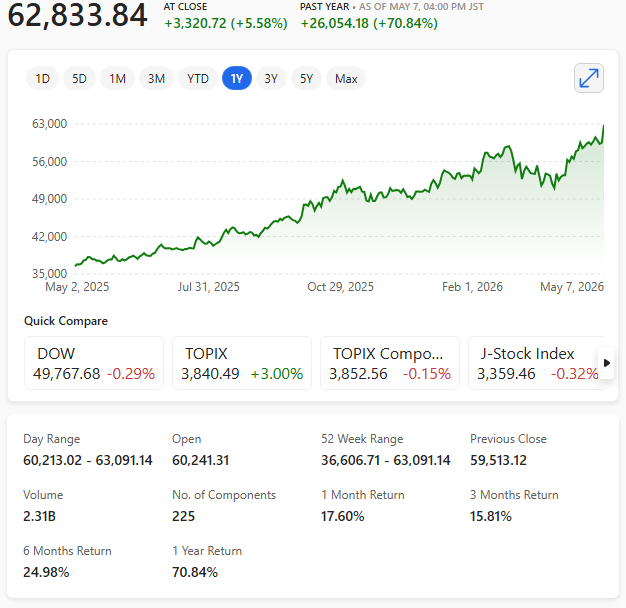
The news has sparked a sharp sell-off across technology stocks as investors digested the implications.
Shares in some of the world’s biggest chipmakers and AI-related companies fell as markets reassessed future earnings and the prospect of fiercer global competition.
While AI remains one of the fastest-growing industries on the planet, the emergence of another serious contender has unsettled a sector that has enjoyed remarkable investor confidence.
Strategic asset
Semiconductors have become one of the world’s most valuable strategic assets. They power everything from advanced chatbots and autonomous vehicles to medical research and military systems.
Any nation capable of producing high-performance chips gains not only an economic advantage but also increased technological independence.
Race
Industry experts believe China’s latest achievement could intensify the global race for semiconductor supremacy.
Governments are already investing heavily in domestic chip manufacturing, while technology firms are pouring billions into research to stay ahead of rapidly evolving competition.
Although the market reaction has been dramatic, many analysts see the current volatility as a short-term adjustment rather than a sign that the AI boom is fading.
Breakthrough
Instead, China’s breakthrough may ultimately accelerate innovation, forcing companies around the world to develop faster, smarter and more efficient technologies in what is becoming one of the defining industrial contests of the 21st century.
Or is there a more affordable alternative for AI development compared to the trillions the U.S. has invested?
China clearly believes there is.