Alphabet’s arrival in the Dow marks a decisive shift in America’s most famous index

Alphabet in club Dow

Alphabet’s entry into the Dow Jones Industrial Average this week is more than a routine reshuffle; it is a symbolic acknowledgement that the modern U.S. economy is now defined by data, cloud infrastructure and artificial intelligence rather than legacy telecommunications.

The change took effect on 29 June 2026, placing Google’s parent company among the 30 blue‑chip names that represent the industrial and corporate backbone of the United States.

Keeping up with the Joneses

Alphabet replaces Verizon, which leaves the index after more than two decades. The Dow is a price‑weighted index, meaning companies with higher share prices exert greater influence on its movements.

Verizon’s comparatively low share price had steadily reduced its mechanical impact, while Alphabet’s share price—hovering around $350—immediately makes it one of the Dow’s most consequential components.

This weighting logic, rather than any judgement on business quality, is the primary reason behind the switch.

The inclusion also reflects a broader structural shift. Alphabet brings significant exposure to AI, cloud computing, digital advertising and autonomous systems, areas that now dominate corporate investment and market leadership.

Five of the Mag Seven now in club Dow – 9 of the Dow are Tech related Companies

Its arrival means the Dow now contains five members of the so‑called Magnificent Seven, aligning the index more closely with the forces driving U.S. equity performance.

Verizon’s departure underscores how the Dow evolves to remain representative of the economy it tracks.

Alphabet’s addition signals that the digital era is not merely influencing markets—it is now embedded at the heart of America’s oldest stock benchmark.

But does this spell potential danger for the Dow in the future as the balance of power is weighted more towards tech?

Should the markets crash because of the overreach of AI tech’ then the Dow will fall hard.

SectorCompanies
TechnologyApple, Microsoft, Amazon, Alphabet, Nvidia, Cisco Systems, Intel, IBM, Salesforce
FinancialsGoldman Sachs, JPMorgan Chase, American Express, Travelers, Visa
IndustrialsBoeing, Caterpillar, Honeywell, 3M, UnitedHealth Group
ConsumerMcDonald’s, Coca‑Cola, Procter & Gamble, Nike, Walmart
HealthcareJohnson & Johnson, Merck, Amgen
EnergyChevron
CommunicationsWalt Disney
MaterialsDow Inc.

Jane Street’s Rise and the Quiet Transformation of Wall Street

AI Algorithmic trading

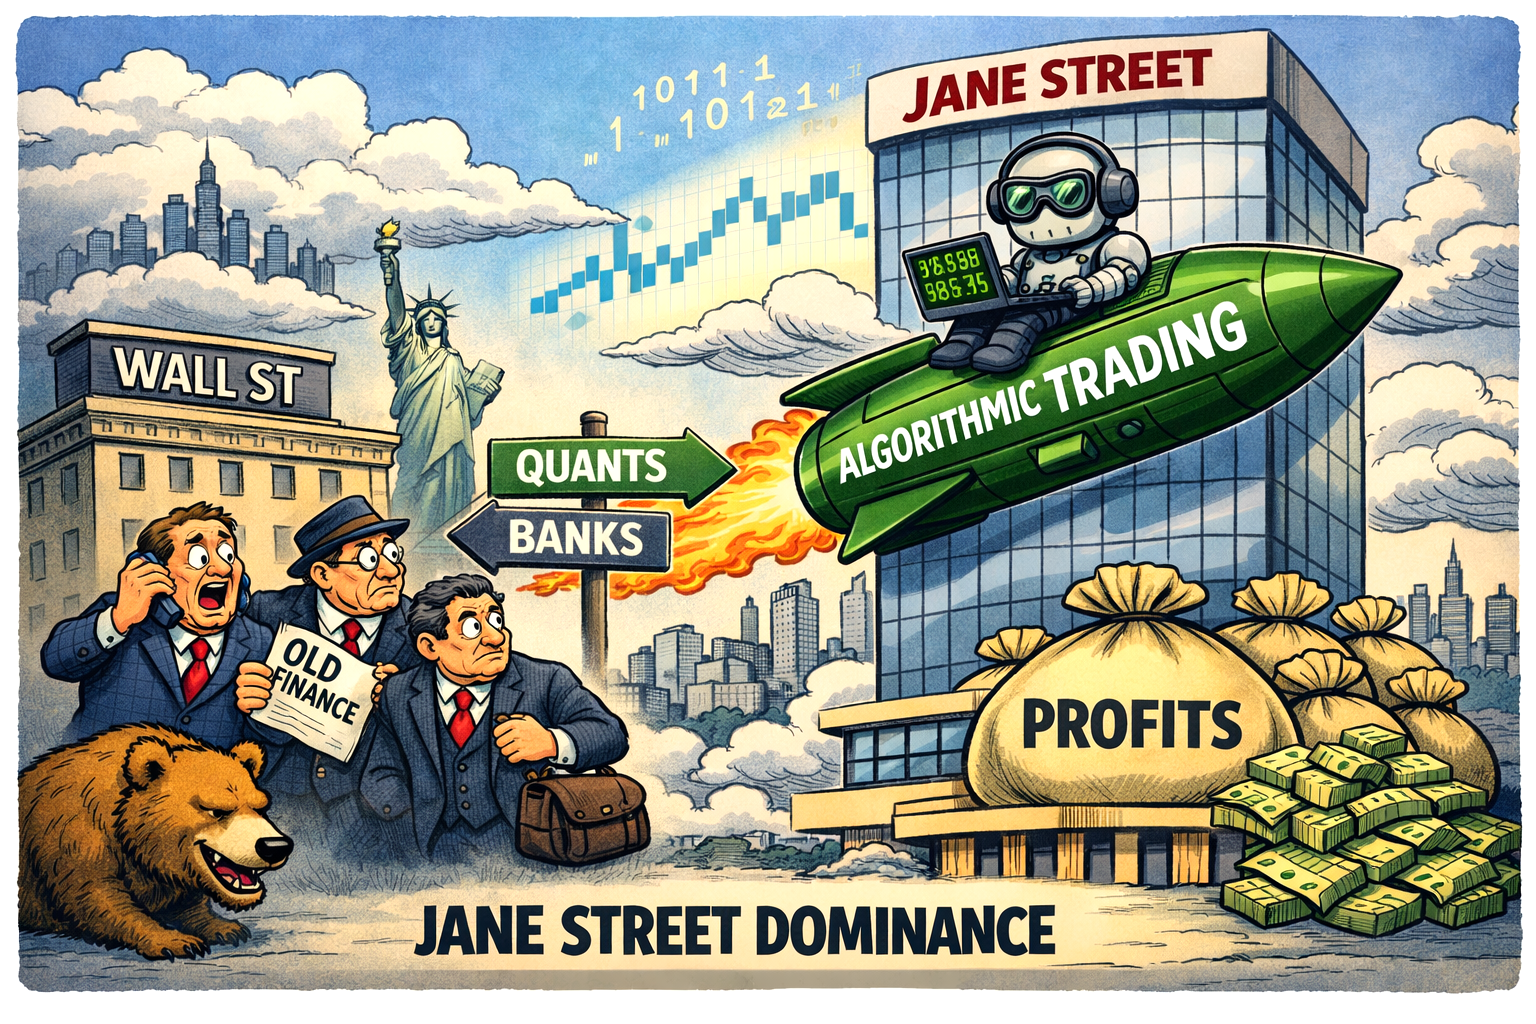
The idea that “Jane Street is taking over Wall Street” is not a literal claim of ownership but a reflection of a deeper structural shift in global finance.

Over the past ten years, the centre of gravity in markets has moved away from the traditional, relationship‑driven banking model and towards firms built on mathematics, automation, and relentless execution.

Down your street

Jane Street is the most visible and successful expression of that shift, and its ascent tells a larger story about how modern markets now function.

Founded in 2000, Jane Street began as a niche player in the then‑nascent world of exchange‑traded funds. ETFs were still viewed as a technical curiosity, but the firm recognised early that they would become the backbone of global investing.

By building sophisticated systems to price, hedge, and arbitrage these instruments, Jane Street positioned itself at the heart of a market that has since grown to more than $10 trillion.

Today, it is one of the largest ETF liquidity providers in the world, often stepping in when banks cannot or will not.

Different

What makes the firm stand out is not just scale but method. Jane Street operates with a level of automation that traditional banks struggle to match.

Its trading is driven by quantitative models, rapid data ingestion, and a culture that treats technology as the primary engine of profit.

This allows it to operate across asset classes — bonds, options, currencies, commodities — with a consistency and precision that human‑centred trading desks cannot replicate.

The results are striking. In recent years, Jane Street has generated trading revenues comparable to major global banks, despite employing only a fraction of their staff and avoiding the capital‑intensive business lines that weigh down traditional institutions.

Its profitability has surged during periods of market stress, when liquidity evaporates and automated firms with strong balance sheets become indispensable.

Break from tradition

Culturally, too, Jane Street represents a break from Wall Street tradition. It has no CEO, minimal hierarchy, and a compensation model that rewards collective performance rather than individual deal‑making.

This structure attracts elite quantitative talent and reinforces the firm’s identity as a technology‑driven institution rather than a bank with traders attached.

Its culture is radically different

Jane Street has:

  • No CEO, minimal hierarchy, and a collective‑profit pay model.
  • Extremely high compensation — ~£700k average pay in the UK, with interns earning over $23k/month

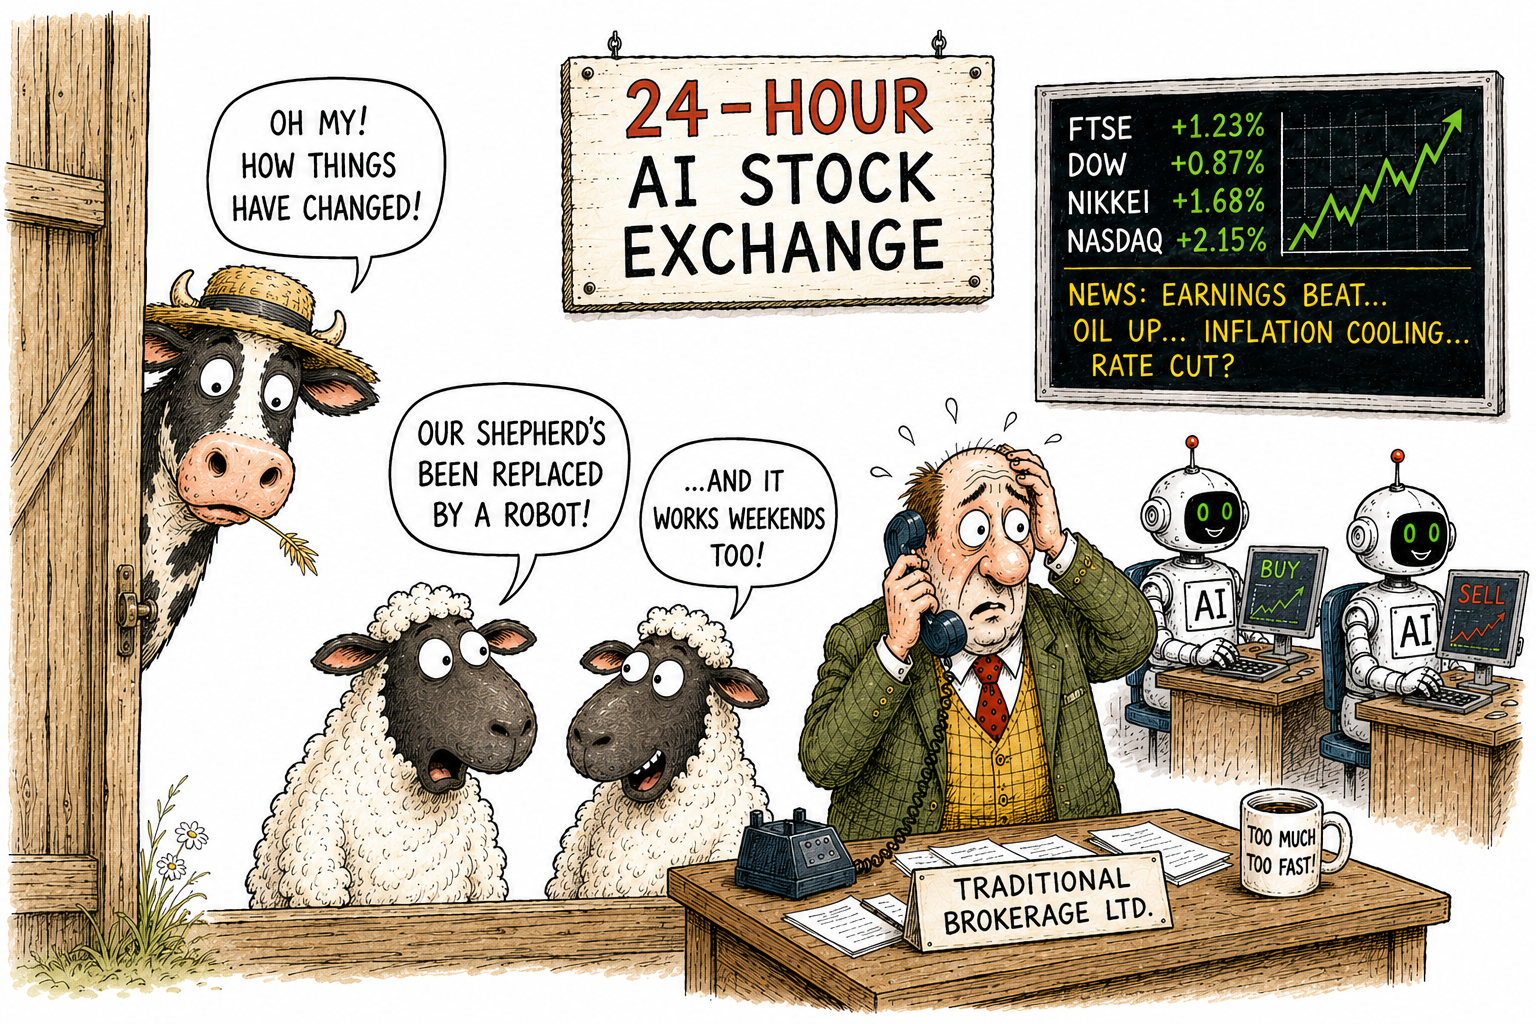
To say Jane Street is “taking over” is to acknowledge that the old Wall Street — built on phone calls, intuition, and personal networks — is being eclipsed by firms whose competitive edge lies in code, computation, calculations and speed.

The transformation is quiet but profound: the future of market‑making belongs to those who can automate complexity, and Jane Street is already operating in that future.

AI plays a central role in how Jane Street operates. The firm’s entire trading model is built around automation, data analysis, and algorithmic decision‑making.

Here’s how AI fits into its structure:

Core of its trading engine

Jane Street’s systems ingest vast amounts of market data in real time — prices, volumes, volatility, and correlations across thousands of instruments.

Machine‑learning models help identify patterns and optimise execution strategies, allowing trades to be placed faster and more efficiently than any human desk could manage.

Reinforcement and predictive modelling

AI techniques such as reinforcement learning are used to refine trading algorithms. These systems learn from past market behaviour, adjusting parameters to improve outcomes under different conditions — for example, predicting liquidity shifts or price movements in ETFs and derivatives.

Risk and portfolio management

AI also supports risk control. Automated models continuously assess exposure across asset classes, recalibrating positions when volatility spikes or correlations change.

This enables Jane Street to maintain tight risk limits while trading billions of dollars daily.

Talent and culture

The firm’s workforce is dominated by mathematicians, physicists, and computer scientists rather than traditional bankers.

They design and maintain AI‑driven systems that make trading decisions autonomously, with human oversight focused on model validation and strategic direction.

Broader impact

Jane Street’s success has influenced the entire financial ecosystem. Banks and hedge funds now emulate its AI‑centred approach, shifting from intuition‑based trading to quantitative automation.

In that sense, AI isn’t just a tool for Jane Street — it’s the foundation of its dominance.

In short, AI is the invisible trader behind Jane Street’s rise, enabling the firm to process information, execute trades, and manage risk at a scale and speed that traditional Wall Street institutions can’t match.

The Ed Miliband energy paradox: how Britain ended up paying France to take its power

UK energy paradox

If you are anything like me, you’re not wrong to feel that this is insane. On the face of it, Britain has:

  • Among the highest electricity prices in the developed world, especially for industry.
  • Growing periods of negative wholesale prices, where generators pay others to take power.

That combination is not just a glitch; it’s the product of how the UK has chosen to do net zero—through a tangle of subsidies, rigid contracts and a grid that was never upgraded to match the political ambition.

This is the Ed Miliband paradox: a “cheap renewables” story that somehow delivers some of the world’s most expensive power, and then occasionally becomes so oversupplied that we literally pay France and others to take it away.

What is actually happening when prices go negative?

Negative prices are not a metaphor. For several dozen hours already this year, the wholesale price of electricity in Britain has dropped below zero.

Generators effectively pay the system to keep running, and interconnectors export that surplus to countries like France, Holland and Belgium—sometimes with a “chunky payment” attached.

This happens when:

  • Supply massively exceeds demand—typically on windy, sunny, mild days when heating and cooling demand is low.
  • Certain generators cannot or will not switch off—because of technical constraints (nuclear, some gas) or because their subsidy contracts reward them for generating regardless of price.
  • The grid cannot move or store the surplus—limited storage, constrained transmission, and slow grid reinforcement mean power piles up in the wrong place at the wrong time.

In that moment, electricity stops being a valuable commodity and becomes a waste product that must be disposed of. Interconnectors to France and others are the “sewer pipe” for that surplus.

Why the UK is uniquely bad at this

Negative prices are not just a British phenomenon—Germany, Spain, the Netherlands and others have also seen record hours of sub‑zero prices as renewables surge. But the UK has managed to combine:

  • High average prices, especially for industry;
  • Frequent negative prices at the margin;
  • Huge policy costs loaded onto bills rather than general taxation.

That cocktail is the result of several design choices.

1. Subsidy structures that pay to generate, not to be useful

A big chunk of UK renewables is supported by:

In a negative price event, the market is screaming “stop generating”. But if your contract still pays you based on output, you have every incentive to keep going. The cost of paying someone else to take the power can be less than the subsidy you’d lose by switching off.

So the system ends up doing something perverse: it pays generators to keep producing power that nobody wants, and then pays other countries to take it away.

2. A grid built for yesterday, not for a renewables surge

The UK has poured money into generation capacity—offshore wind, solar, interconnectors—but has been slow, bureaucratic and under‑invested on:

  • Transmission upgrades—moving power from windy Scotland and the North Sea to demand centres in England.
  • Storage—batteries, pumped hydro, demand‑side response at scale.
  • Flexible backup—fast‑ramping gas, smart tariffs, and industrial load‑shifting.

When you bolt a 21st‑century renewables fleet onto a 20th‑century grid, you get congestion, curtailment and waste.

The system then has to pay wind farms not to generate in some regions, while importing power elsewhere. Negative prices are just the most visible symptom of that mismatch.

3. Political obsession with “headline capacity” over system design

Net zero politics has been sold as a race to headline numbers:

  • X gigawatts of offshore wind by year Y
  • Z per cent of power from renewables
  • “Clean power by 2030”

What has not been sold—or properly designed—is the system architecture that makes that capacity economically coherent: locational pricing, flexible demand, storage, and a planning regime that can actually deliver grid reinforcement on time.

Ed Miliband’s own Electricity Market Review explicitly rejected zonal pricing in favour of a reformed national price, arguing that a single price is “fairest” and better for investment. That sounds nice politically, but it hides the real cost of congestion and mis‑location.

Instead of prices signalling “don’t build another wind farm here until the grid is upgraded”, the system socialises the pain across everyone’s bills.

Why are we paying France?

Interconnectors are not inherently stupid. In a rational system, they:

  • Smooth out volatility—import when you’re short, export when you’re long.
  • Share capacity—you don’t need to build as much domestic backup if you can lean on neighbours.

The problem is that the UK has created a structure where:

  • We over‑generate at certain times because of rigid contracts and inflexible plant.
  • We lack storage and flexible demand to soak up that surplus domestically.
  • We then use interconnectors as a dumping ground, paying others to take power that our own consumers have already funded through subsidies and levies.

France, with its large nuclear fleet and different cost structure, can happily take that cheap or even “paid‑to-take” power, displacing its own generation and lowering its average costs.

Meanwhile, UK industry is paying power prices around 60 per cent higher than in France on average.

So, we (the UK) socialise the cost of building and subsidising the capacity, then export the benefit at a discount.

How did this policy architecture even get created?

This isn’t one bad decision; it’s a stack of incentives and political choices that line up in the worst possible way.

1. Short‑term politics, long‑term contracts

Governments of all colours wanted:

  • Quick, visible progress on renewables.
  • Private capital to fund it, not the state balance sheet.
  • Minimal upfront tax rises.

The answer was long‑term, legally binding contracts (RO, CfDs, capacity market) that shifted risk onto consumers via bills. Once signed, these contracts are hard to change without spooking investors or triggering compensation claims.

So ministers get the photo‑ops—“world‑leading offshore wind”, “clean power by 2030”—while the structural costs and distortions are baked in for decades.

2. Ideological framing: net zero as a moral crusade, not an engineering project

Net zero has been framed as a moral imperative first, an engineering challenge second. That has consequences:

  • Questioning the design is painted as questioning the goal.
  • Complex system trade‑offs are reduced to slogans about “cheap renewables” and “green jobs”.
  • Uncomfortable truths—like the need for gas backup, storage, and grid reform—are pushed into the technical long grass.

The result is a policy environment where it is easier to announce another offshore wind auction than to confront the messy, expensive business of rewiring the grid and redesigning market signals.

3. Regulatory fragmentation and institutional cowardice

Ofgem, National Grid ESO, the Department for Energy Security and Net Zero, the Treasury—each has a slice of the problem, but no one owns the whole system outcome.

  • Ofgem focuses on consumer protection and network costs, often slowing investment.
  • Treasury resists big upfront public spending on grid and storage, preferring “market‑based” fixes.
  • Ministers chase announcements that look good in manifestos.

No one is politically rewarded for saying: “We need to spend billions on grid reinforcement and storage now, or we’ll be paying France to take our power in five years.” So it doesn’t happen at the necessary scale.

Is this fixable, or are we stuck paying others to take our power?

It is fixable—but not with more of the same.

An honest, grown‑up approach would mean:

  • Rewriting incentives so generators are paid for being useful to the system, not just for raw output. That means tighter rules on when subsidies are paid during negative prices, and contracts that reward flexibility.
  • Accelerating grid and storage investment as national infrastructure, not an afterthought. That likely means more state involvement and faster planning, not just hoping private investors will do it.
  • Introducing stronger locational signals—whether full zonal pricing or something close to it—so that the cost of building in the wrong place is visible, not smeared across everyone’s bills.
  • Using interconnectors intelligently, not as a dumping ground: export surplus when it’s genuinely cheap, but don’t subsidise over‑generation just to keep contracts happy.

So how stupid is this policy?

On a technical level, the engineers keeping the lights on are doing miracles with the system they’ve been given. The stupidity sits higher up:

  • Designing a net zero pathway around rigid subsidies and under‑built infrastructure.
  • Refusing to confront the trade‑offs, then acting surprised when the physics bites back.
  • Allowing a political narrative of “cheap green power” to coexist with some of the highest industrial prices in the world and growing episodes of negative pricing.

The real scandal isn’t just that we pay France to take our power. It’s that British households and firms have already paid once—through levies and high tariffs—to build that surplus, and then pay again when the system has to bribe someone else to use it.

Work that one out…!

Memory shortage shaking Apple to the core

Memory shortage shakes Apple to the core

Apple’s sharp share-price drop recently (June 2026) wasn’t the result of a single misstep, but a sudden collision between global supply‑chain pressure and investor expectations.

The company’s stock slid roughly 6% in one session – its steepest fall in more than a year – after Apple pushed through sweeping price increases across Macs, iPads, HomePods, Apple TV and even Vision Pro.

For a company that normally adjusts pricing with surgical caution, the breadth and scale of these rises jolted the market.

Unprecedented price surge

The trigger sits outside Cupertino. Memory‑chip prices have surged at a pace industry veterans describe as unprecedented, driven by AI data‑centre expansion that is consuming vast quantities of DRAM and NAND.

Apple’s suppliers have passed on extraordinary cost increases, and Apple, unusually, has chosen not to absorb them.

Some Mac configurations rose by hundreds of pounds; certain high‑end models jumped by more than a thousand. Investors interpreted this as a sign that Apple’s margins – already under scrutiny given its premium valuation – are being squeezed harder than expected.

Concerning

The concern is not simply higher prices, but what they imply. If Apple is forced to raise hardware prices now, analysts fear the same pressure could extend to the iPhone later this year.

That would test the limits of consumer tolerance at a time when upgrade cycles are already lengthening. The market’s reaction reflects a deeper anxiety: Apple’s pricing power is formidable, but not infinite.

A modest rebound followed the initial sell‑off, suggesting the drop may have been an overreaction. But prices for Apple products have increased whatever the markets tell us.

Even so, the episode underscores how sensitive Apple’s valuation is to any hint of margin compression in its hardware business.

The Great Memory Squeeze: Why the AI Boom Is Reshaping the Entire Hardware Industry

AI memory RAM shortage

A global shortage of DRAM is rippling through the technology sector, exposing a stark divide between the giants of consumer electronics and the smaller firms that rely on stable component pricing to survive.

What was once a cheap, predictable commodity has become the industry’s most volatile input, with prices rising several hundred per cent in under a year.

Feeding AI

The cause is simple: artificial intelligence systems now consume extraordinary volumes of high‑performance memory, and suppliers are prioritising the biggest buyers.

For companies like Apple, Microsoft and Samsung, the surge in memory costs is disruptive but manageable. These firms have the scale, cash reserves and supply‑chain leverage to secure allocation and pass higher costs on to consumers.

Apple has already raised prices across several product lines, while Microsoft has increased the price of its Xbox Series S and warned that memory costs may double again by 2027. Their margins will tighten, but their market positions remain secure.

Smaller manufacturers face a far harsher reality. Start‑ups, niche hardware makers and mid‑tier consumer electronics brands are being pushed to the back of the queue, forced to pay inflated prices or accept long delays. Some may simply be unable to ship products at all

Pressure.

Companies such as GoPro have already warned investors of existential pressure, and others in the audio, camera and budget‑device sectors are quietly preparing for cancelled launches or reduced specifications.

The stock market has responded unevenly. Memory suppliers like Micron and SK Hynix have seen extraordinary rallies, with margins soaring and investors betting on prolonged demand.

Meanwhile, smaller hardware firms are experiencing sharp declines as profitability evaporates.

Longer term, the memory crunch may accelerate consolidation. If supply remains tight, the industry could tilt even further towards a handful of dominant players, with innovation increasingly concentrated among those able to afford the rising cost of participation.

IBM’s ‘block of flats’ chip design pushes Moore’s Law into new territory

IBM chip stack design

IBM’s latest research breakthrough – a sub‑1nm chip architecture built like a “block of flats” – marks one of the most ambitious attempts yet to stretch Moore’s Law beyond its natural limits.

The company claims its new NanoStack design can pack almost 100 billion transistors onto a fingernail‑sized chip, a density that would have been unthinkable even a decade ago.

In early tests, the prototype delivered 50% higher performance and 70% better energy efficiency than IBM’s own 2nm technology, signalling a potential generational leap in computing power.

Moore’s Law at 50 years

For more than half a century, Moore’s Law – the observation that transistor counts double roughly every two years – has shaped the trajectory of the semiconductor industry.

But as transistors approach atomic scales, the physics has become unforgiving. Leakage, heat, and quantum effects increasingly threaten the neat exponential curve that once defined progress.

The industry’s response has been to move vertically: instead of squeezing more transistors across a flat surface, designers are now building upwards.

Verical stacking

IBM’s NanoStack takes this vertical shift to an extreme. Rather than simply elongating transistor structures, the company has begun stacking entire sheets of transistors on top of one another, creating a skyscraper‑like arrangement.

Professor Alan Woodward of the University of Surrey reportedly likens the shift to replacing a city of houses with a 100‑storey tower block – a vivid contrast to the 30–50‑storey equivalents being pursued by rivals such as Samsung and Intel.

The approach is bold, but it comes with engineering hazards. Heat rises through the stack, threatening performance and reliability. Layers that are too thin risk transistors failing to switch off cleanly, undermining the chip’s logic.

Obstacles

These are not trivial obstacles, and IBM acknowledges that commercial production remains several years away.

Yet the company argues that the architectural shift is essential if computing is to keep pace with the demands of AI, cloud workloads, and energy‑constrained data centres.

If NanoStack proves manufacturable at scale, it could represent the most significant extension of Moore’s Law since the industry moved from planar to FinFET designs.

The broader question is whether this vertical strategy can deliver multiple generations of improvement, or whether it is the final flourish before the industry must abandon transistor‑count metrics altogether.

For now, IBM has injected fresh momentum into a field long assumed to be running out of road – and reminded the industry that Moore’s Law may bend, but it is not yet broken.

Moore’s Law states

Moore’s Law is the principle that the number of transistors on a microchip doubles roughly every two years, leading to continual increases in computing power and efficiency.

SpaceX’s sharp comedown from its euphoric peak

SpaceX shares now trade at $156.11, down more than 30% from their post‑IPO peak of $225.64, and the company is carrying roughly $29.1 billion in long‑term debt.

Less than two weeks after its record‑breaking IPO, SpaceX has surrendered the majority of its early gains. The stock, which opened for public trading at $150 and surged to an intraday high of $225.64 on 16 June, has since fallen more than 30%, briefly dipping below its debut price before stabilising around $156.11.

Dramatic reversal

The reversal has been dramatic. At its height, SpaceX’s valuation briefly exceeded Amazon and Microsoft, fuelled by a thin free float, intense retail demand, and exuberance around its AI‑compute ambitions.

But sentiment turned quickly as investors reassessed the sustainability of such rapid gains. A three‑day slide wiped out more than $600 billion in market value, dragging the company back toward its opening‑day levels.

Big one-day loss

Monday’s 16% plunge alone erased nearly $400 billion, one of the largest single‑day market‑cap losses in U.S. history. The stock’s volatility has been amplified by a broader tech sell‑off, with rising interest‑rate expectations hitting high‑valuation companies hardest.

Debt load: bridge financing, bond issuance, and the new capital structure

SpaceX’s debt position has become a central focus of the market’s reassessment. Ahead of the IPO, the company refinanced its borrowings with a $20 billion bridge loan, replacing five earlier debt facilities tied to both SpaceX and Musk’s AI venture, xAI. This brought total debt to $20.07 billion as of March.

Since listing, SpaceX has moved rapidly to restructure that short‑term financing. It has launched its first‑ever investment‑grade bond sale, targeting around $20–25 billion in new notes, with proceeds earmarked to repay the bridge loan and fund AI and Starship development.

Regulatory filings reportedly show the company now holds $29.1 billion in long‑term debt, alongside a massive $100.8 billion cash position built through the IPO and earlier funding rounds.

A company still in transition

SpaceX remains one of the world’s most valuable companies, but the market is now pricing it more soberly.

The stock is still above its $135 IPO price, yet the early euphoria has given way to questions about valuation, capital intensity, and the scale of its AI and space‑infrastructure ambitions.

Don’t forget – this is an Elon Musk company after all, and its early days.

Nikkei: A Record High – Then a Brutal Reality Check

Nikkei Index in freefall

The Nikkei’s latest surge ended with a thud. After breaking to a fresh all‑time high above 72,800 at the start of the week, the index reversed violently, delivering one of its sharpest two‑day pullbacks of the year.

Monday’s breakout looked like another leg in Japan’s extraordinary momentum trade; by Tuesday afternoon it had morphed into a classic bull‑trap, with the Nikkei closing nearly 4% lower and giving back the entire move.

Selling continued into Wednesday, taking the peak‑to‑trough decline to roughly 6%.

The speed of the reversal matters. This wasn’t a gentle pause but a decisive rejection of the highs, driven by a global tech wobble and profit‑taking after an extended run. Japan’s rally has been fuelled by semiconductors, exporters and foreign inflows — the same forces now showing strain.

Whether this is a reset or the start of something deeper longer-term will depend on how those flows behave from here.

What actually happened

1. New all‑time high — Monday 22nd June 2026. The Nikkei surged to a record intraday high of 72,831.73. It also closed at a record 72,353.96 that day .

2. Violent reversal — Tuesday 23rd June 2026 The next session saw a huge drop:

  • Open: 72,404.37
  • Low: 69,788.38
  • Close: 69,788.38 That is a –3.83% fall in one day, wiping out the entire breakout move .

3. Continued selling — Wednesday 24th June 2026 The index fell again to around 69,174–69,277 depending on source timing, extending the pullback .

How big was the fall?

From the intraday peak 72,831.73 to Wednesday’s low around 68,461 (24th June intraday low) is roughly:

–4,370 points ≈ –6.0% in two sessions

That is a material reversal by Nikkei standards.

Interpretation

This is exactly the pattern you’re asking about:

  • Record high → immediate sharp sell‑off → follow‑through decline.
  • The catalyst appears to be a tech‑led global risk‑off move, with Wall Street’s AI/semiconductor correction spilling into Japan, plus some profit‑taking after an extreme run.

Oh Dear – Here we go again – Seven Prime Ministers in Ten Years: Why is Britain’s Politics Failing?

7 PMs in 10 Years

Britain has now burned through seven prime ministers in a decade, an extraordinary rate of political turnover for a country that once prided itself on institutional steadiness.

This is not a run of bad luck or a string of unfortunate personalities. It is the symptom of a political system that has lost its way!

The first rupture was Brexit, which detonated the old Conservative coalition and replaced it with a permanent internal civil war.

Disfunctional

The party ceased to function as a unified governing force and instead became a collection of factions, each convinced it alone represented the “true” mandate of the referendum. Prime ministers were no longer leaders but temporary referees.

Once they failed to contain the infighting, they were removed. Theresa May fell to it. Boris Johnson was consumed by it. Liz Truss was destroyed by it in record time.

But the deeper failure is structural exhaustion. Westminster has been in crisis mode since 2016: Brexit negotiations, minority government, pandemic, inflation shock, energy turmoil, geopolitical instability.

Let’s CHANGE again – just becuase we can

Firefighting

The machinery of state has been asked to deliver transformation while simultaneously firefighting. That combination breeds short‑termism. Policies are launched for headlines rather than outcomes.

Leaders are judged by weekly polling rather than national strategy. The result is a political class that behaves like a boardroom under siege — reactive, brittle, and permanently on edge.

Disillusioned

Layered on top is public disillusionment. Trust in politics has collapsed to historic lows. Voters now punish governments faster and more aggressively than at any point in modern British history. Every scandal becomes existential.

Every by‑election becomes a referendum on the prime minister’s survival. MPs panic, parties fracture, and leaders lose authority long before the electorate formally removes them.

Vacuum

Finally, Britain faces a governance vacuum. The country has major structural problems — weak productivity, regional inequality, an overstretched NHS, fragile public finances — but no long‑term political consensus on how to fix them.

Without a shared national direction, governments drift, parties implode, and leadership churn becomes inevitable.

Fund your way UK?

7 in 10

Seven prime ministers in ten years is not a curiosity. It is a warning light. Until the UK rebuilds political discipline, restores institutional seriousness, and commits to long‑term strategy over short‑term spectacle, the revolving door at No. 10 will keep spinning.

Personal gain – the country’s loss. Imagine if a business was run like this?

And, for your information the UK has had 21 Prime Ministers in the past 100 years (1926 to 2026) including the 7 in the past 10 years.

So, that’s one third of the 21 PM’s in the last 10 years – just think about that.

Shocking, and no wonder the country is lost it’s identity and direction – the people running it don’t even know who they are or what the truly stand for.

Let’s put the vote back to the people.

We can’t keep chopping and changing like this.

UK and U.S. economic data roundup as of week ending 19th June 2026

UK U.S. June 2026 economic data

United Kingdom – Latest Data This Week to June 19th 2026

Labour market:

  • The UK unemployment rate for April 2026 held at 4.9%, slightly below the previous 5% reading. Average earnings including bonuses grew 4.4%, while earnings excluding bonuses rose 3.4%. Employment increased by 100,000 in April, although HMRC payrolls for May showed only a marginal +2,000 change.

Retail sales:

  • Retail sales rebounded strongly in May 2026, rising 1.2% month‑on‑month and 3.2% year‑on‑year, reversing April’s declines. Retail sales excluding fuel also rose 1.2% MoM and 4.6% YoY.

Public finances:

  • Public sector net borrowing (excluding banks) came in at £23.3bn in May, slightly worse than April’s revised figure.

Business activity:

  • Flash PMIs for June show mixed momentum:
    • Manufacturing PMI: 53.9 (expansion)
    • Services PMI: 49.3 (contraction)
    • Composite PMI: 49.7 (borderline contraction) These readings suggest the UK economy is losing some pace heading into summer.

United States – Latest Data This Week to 19th June 2026

Labour market:

  • Initial jobless claims for the week ending 13th June 2026 fell slightly to 226,000, broadly in line with expectations. Continuing claims rose to 1.81 million, indicating some softening in labour market conditions.

Manufacturing & business surveys:

  • The Philadelphia Fed Manufacturing Index jumped to 10.3 in June from –0.4, signalling a notable improvement in factory activity.
  • The S&P Global flash PMIs for June show:
    • Manufacturing: 55.1 (solid expansion)
    • Services: 50.7 (modest expansion)
    • Composite: 51.5 (steady growth) These point to a resilient US private‑sector backdrop.

Housing & consumer indicators:

  • Mortgage rates eased slightly, with the 30‑year rate dipping to 6.47%.
  • Redbook retail sales rose 9.4% YoY, suggesting firm consumer spending.

Capital flows & energy:

  • Net long‑term TIC flows for April registered $103.1bn, indicating strong foreign demand for US assets.
  • API data showed a sharp –8.33 million barrel draw in crude oil stocks, hinting at tighter near‑term supply.

Overall Pictures for UK and U.S.

  • UK: A mixed week — labour market steady but softening at the margins; retail sales surprisingly strong; PMIs signalling a mild loss of momentum; public borrowing still elevated.
  • US: Data broadly stronger — manufacturing rebounded, services steady, jobless claims stable, and consumer spending indicators show firm.

Qualcomm suggests AI Agents will replace apps soon

The future is Agentic AI not apps

Qualcomm’s latest pitch is blunt: the age of standalone apps is fading, and AI agents are about to take their place.

It’s a bold claim, but it reflects a wider shift sweeping through the tech industry as on‑device AI becomes powerful enough to handle tasks that once required entire software ecosystems.

Delegating Intent

Qualcomm argues that future smartphones will rely less on tapping icons and more on delegating intent. Instead of opening an app to book travel, edit photos, or manage finances, users will instruct an AI agent that understands context, preferences, and history.

The agent will then orchestrate the work across services in the background. In Qualcomm’s view, this makes the traditional app model feel increasingly rigid and outdated.

The company’s latest Snapdragon platforms are designed around this idea: fast local processing, persistent personal models, and low‑latency agentic behaviour that doesn’t rely solely on the cloud.

It’s a strategic move to keep mobile hardware relevant as AI shifts the centre of gravity away from apps and towards continuous, conversational computing.

Sceptics will note that apps won’t vanish overnight. But the direction of travel is clear. If Qualcomm is right, the next major platform shift won’t be about bigger screens or faster chips.

It will be about replacing the app grid with an intelligent layer that simply gets things done.

China’s Economy Loses Momentum in May 2026 as Consumers Pull Back

China consumer slow down

China’s economy showed fresh signs of strain in May 2026, with retail sales slipping for the first time this year and exposing the fragility of the country’s consumer‑led recovery.

The latest figures point to households becoming more cautious as job insecurity, weak income growth and a still‑ailing property sector weigh on confidence.

Retail sales — a key gauge of consumer demand — fell compared with a year earlier, reversing April’s modest rise.

Troubling?

Analysts note that the decline is particularly troubling because it comes despite a raft of local government incentives aimed at boosting spending on cars, appliances and electronics. Instead, households appear to be prioritising savings over discretionary purchases.

Industrial production continued to expand, but at a slower pace than earlier in the spring, suggesting that the export‑heavy manufacturing sector is also losing some momentum.

With global demand softening and geopolitical tensions disrupting supply chains, factories are finding it harder to sustain the strong output seen earlier in the year.

Weakness

The weakness in May 2026 adds pressure on Beijing to consider more forceful support measures. While policymakers have so far resisted large‑scale stimulus, the combination of faltering consumption and a deep property downturn is making the recovery increasingly uneven.

For now, the data underline a simple reality: China’s rebound remains fragile, and confidence is still in short supply.

SpaceX Surges 20% on Debut as Wall Street’s Fear Gauge Falls

SpaceX up 20% in one day

SpaceX’s long‑anticipated market debut delivered exactly the kind of spectacle investors had hoped for.

Shares in the rocket and satellite group jumped 20% on their first day of trading, instantly cementing the company as one of the most valuable entrants in modern market history and extending the extraordinary momentum behind the commercial space sector.

FOMO

The opening rally was driven by a mix of retail enthusiasm, institutional FOMO, and a broader belief that SpaceX now sits at the centre of three powerful structural trends: reusable launch economics, satellite‑based communications, and defence‑adjacent technology spending.

Traders described order books as “relentless” and “one‑way”, with demand spilling over into related aerospace names throughout the session.

VIX

The exuberance fed directly into the volatility complex. The VIX — Wall Street’s so‑called fear gauge — fell sharply, touching levels last seen before the recent geopolitical flare‑ups.

A successful mega‑IPO tends to act as a barometer for risk appetite, and the smooth execution of SpaceX’s listing appears to have reassured investors that liquidity remains deep and that the market can absorb large‑scale issuance without strain.

Analysts were quick to point out that the combination of a blockbuster debut and a falling VIX is rare. It suggests not only confidence in SpaceX’s growth story but also a broader willingness to rotate back into high‑beta sectors after weeks of defensive positioning.

For now, the market has delivered its verdict: SpaceX has arrived as a public company with gravitational pull, and investors are leaning back into risk rather than retreating from it.

Greenshoe

In major IPOs that jump 20% on day one, underwriters typically exercise the greenshoe to help stabilise trading and meet excess demand.

A surge that strong implies the banks were almost certainly allocating the extra 15% of shares to satisfy buyers.

However, the formal disclosure of greenshoe usage is normally filed several days after the IPO, once stabilisation activity ends. So, we won’t see the official paperwork immediately.

A greenshoe is an IPO mechanism letting underwriters sell up to 15% extra shares and buy them back at the offer price to stabilise trading and prevent early volatility.

SpaceX is not a meme – it is very much real, for the future and it is here to stay. But we may get a bumpy ride as the company progresses.

Elon Musk: The Trillion‑Dollar Man

Elon Musk has spent two decades bending entire industries around his will, but the past year has pushed him into a category previously reserved for myth.

With the SpaceX IPO igniting global markets and sending shockwaves through the aerospace and technology sectors, Musk has become the first individual in history to be calculated as worth $1 trillion.

Empire buidling

It is a milestone that reflects not only personal wealth, but the scale of the industrial empires he has built — and the future investors believe he is about to unlock.

SpaceX’s long‑anticipated public listing has been the catalyst. The company’s valuation surged as soon as trading began, propelled by overwhelming demand for exposure to the world’s dominant launch provider and the backbone of the modern satellite economy.

Starlink

Starlink’s global footprint, the Falcon and Starship programmes, and SpaceX’s near‑monopoly on commercial and government launches have created a business with both extraordinary cash flow and unmatched strategic importance.

Investors are effectively betting on Musk’s ability to commercialise space in the same way he electrified the car industry.

Tesla, Neuralink, X.ai, X, The Boring Company, Solar City & SpaceX

The IPO has also crystallised the value of Musk’s wider ecosystem. Tesla, despite its volatility, remains the world’s most recognisable electric‑vehicle brand.

Neuralink and The Boring Company, though smaller, contribute to the perception of a founder whose ventures consistently reshape their sectors.

But it is SpaceX — with its blend of infrastructure, defence relevance, and global communications — that has propelled Musk into trillion‑dollar territory.

Speculative

Critics argue that such valuations are speculative, driven by hype rather than fundamentals. Yet SpaceX’s track record is unusually concrete: reusable rockets, profitable satellite services, and a launch cadence unmatched by any nation, let alone any company.

We can make the future

The market is effectively pricing in a future where SpaceX becomes the backbone of off‑planet logistics, lunar infrastructure, and perhaps even the first commercial missions to Mars.

Trillion Dollar Man

For Musk, the symbolism is obvious. Becoming the world’s first trillion‑dollar individual cements his status as the defining industrialist of the 21st century.

A figure whose ambitions stretch far beyond Earth, and whose companies now command the kind of economic gravity once associated only with nation‑states.

Context: Countries With GDP ≥ $1 Trillion (Nominal USD, 2026) – Approx’ indication only

United States — 29.0
China — 18.5
Germany — 4.6
Japan — 4.3
India — 4.0
United Kingdom — 3.4
France — 3.2
Italy — 2.3
Canada — 2.2
Brazil — 2.1
Russia — 2.0
South Korea — 1.9
Australia — 1.8
Mexico — 1.7
Spain — 1.6
Indonesia — 1.5
Netherlands — 1.2
Saudi Arabia — 1.1
Turkey — 1.0
Switzerland — 1.0

ECB Interest Rate Hike to 2.25% and UK GDP Contracts 0.1%

Slow UK Growth for April 2026

The European Central Bank jolted markets yesterday with its first interest‑rate increase since 2023, a move driven by renewed energy‑price pressures linked to the U.S./Iran conflict.

Policymakers signalled that the surge in wholesale gas and oil costs is feeding back into euro‑area inflation, forcing a return to tightening after more than two years of stability.

Investors had expected a cautious stance, but the ECB argued that delaying action risked inflation becoming embedded again, particularly in energy‑sensitive economies such as Germany and Italy.

The decision pushed bond yields higher across the bloc and strengthened the euro, reflecting expectations of a more hawkish path through the summer.

UK Lacklustre Growth

In the UK, fresh GDP data released by the ONS for April 2026 offered a more mixed picture. The economy expanded modestly, continuing the fragile recovery seen earlier in the year, but underlying momentum remains weak.

Services provided the bulk of the growth, while manufacturing and construction were broadly flat.

Economists warn that higher energy prices — the same shock driving the ECB’s decision — could weigh on UK output in the coming months, squeezing household budgets and raising costs for businesses.

Together, the ECB’s shift and the UK’s tentative growth figures underline how vulnerable Europe remains to global energy disruptions.

Anthropic’s Fable: The Mythos-Class Model That Finally Goes Public

Anthropic has taken a decisive step in its race to dominate the frontier‑model market, releasing Claude Fable 5 to the public just two months after its private sibling, Mythos, sent Wall Street into a frenzy.

The move marks the company’s most assertive attempt yet to commercialise Mythos‑level capability while reassuring regulators and investors that safety, not speed, is steering the rollout.

Mythos, unveiled in April 2026, stunned both the cybersecurity world and financial markets with its ability to identify software vulnerabilities at a level previously associated with specialist security tools.

Anthropic restricted access, citing the model’s potential for misuse and limiting deployment to vetted partners under Project Glasswing.

That scarcity — and the model’s almost uncanny diagnostic power — helped fuel a surge in Anthropic’s valuation and contributed to the broader AI‑driven market rally.

Fable 5

Fable 5 is the company’s answer to the question Mythos raised: Can a model this capable ever be released at scale? According to Anthropic, the answer is yes — but only with a redesigned safety architecture.

The company says Fable 5 includes new classifiers and guardrails that automatically block responses in high‑risk domains such as cybersecurity and biological threat modelling.

When a query crosses those boundaries, the system falls back to the safer Claude Opus 4.8, ensuring continuity without exposing dangerous capabilities.

Despite these constraints, Fable 5 is no diluted product. Anthropic claims it outperforms Opus 4.8 by more than 10% on key engineering and knowledge‑work benchmarks, offering enterprises a model that is both more capable and more predictable.

Early customers, the company says, are reporting better return on spend due to higher accuracy and reduced task repetition.

IPO

The timing is strategic. Anthropic has just confidentially filed for its IPO, with revenues ballooning from roughly $10 billion last year to a run rate of $47 billion.

Its latest funding round valued the company at $965 billion, surpassing OpenAI’s March valuation.

With OpenAI and SpaceX/xAI also preparing for blockbuster listings, Anthropic needs a flagship product that demonstrates both capability and commercial maturity.

Fable 5 is that product: a Mythos‑class model built for the real world rather than the lab. By releasing it now — powerful, constrained, and priced at a premium — Anthropic is signalling that the era of frontier‑model scarcity is ending, and the era of industrial‑scale AI deployment has begun.

Electric vehicle manufacturer BYD suggests that 80% China car sales will soon be electric

BYD says EVs soon to hit 80% of sales in China manufacture

But then they would say that wouldn’t they – because that is what they sell and to say anything else would be counterintuitive. But they may have a point.

The company’s forecast reflects a structural shift already visible across China’s automotive market.

EVs and plug‑in hybrids accounted for more than 50% of new sales earlier this year, and BYD argues that rapid technological gains, falling battery costs and intensifying competition will push that share dramatically higher.

Executives say the transition is no longer policy‑driven but consumer‑led, with buyers increasingly choosing electric models for performance, running costs and reliability.

China’s charging network—now the world’s largest—has also reached a level of density that removes much of the friction from EV ownership.

At the same time, domestic manufacturers are launching dozens of new models annually, compressing prices and accelerating innovation. BYD believes this pace will make combustion‑engine cars a niche product within a few years.

The prediction carries global implications. China is already the world’s biggest EV market and the largest exporter of electric vehicles.

If its domestic market becomes overwhelmingly electric, economies of scale will deepen, pushing prices down worldwide and reshaping competitive dynamics for legacy carmakers.

For BYD, the message is blunt: the combustion era is ending faster than expected, and China is leading the charge.

Markets in Asia continue volatility as Softbank falls 10%

Softbank down 10%

SoftBank’s sharp 10% slide on Wednesday became the defining symbol of a broader rout across Asia’s technology markets, as the region absorbed the full force of Wall Street’s overnight tech sell‑off.

The reversal ended a brief rebound in chipmakers and reignited concerns that valuations across the artificial‑intelligence complex have run too hot for too long.

The immediate pressure on SoftBank stemmed from reports that its attempt to raise at least $6 billion through a margin loan backed by its OpenAI stake had stalled.

That setback landed at a moment when sentiment toward high‑growth tech names was becoming more fragile, amplifying the downside.

Investors rotated out of risk, hitting Japan’s semiconductor ecosystem: Advantest and Renesas both fell more than 3%, while South Korea’s SK Hynix plunged over 8% and Samsung Electronics dropped 7.45%.

Taiwan’s TSMC and Hon Hai were also dragged lower.

A deeper structural worry is now taking hold. Massive AI‑related fundraising — including upcoming listings for SpaceX, Anthropic and OpenAI — appears to be siphoning capital away from publicly traded tech stocks.

Some investors see this as the early stage of a rotation; others fear it signals overheating. For Japan, one unexpected beneficiary could be defence contractors, with strategists suggesting a shift toward “heavies” as retail traders search for stability.

AI revolution will be “50 times bigger” than the dot‑com boom says Masayoshi Son of Softbank

In essence, Son is reframing SoftBank’s entire identity around AI, portraying it not as a sector but as the next economic infrastructure — a claim that, if realised, would make the dot‑com era look modest by comparison.

SoftBank becomes Japan’s most valuable company as of May 2026.

Scale of transformation: Son argues that artificial intelligence will reshape every industry, dwarfing the internet’s impact in the early 2000s.

SoftBank’s strategy: He reportedly plans to channel the group’s investment focus almost entirely toward AI ventures, positioning SoftBank as a global accelerator for AI‑driven companies.

Vision Fund revival: After years of losses, Masayoshi Son sees AI as the catalyst to reignite the Vision Fund’s profitability, citing rapid advances in generative and autonomous systems.

Economic outlook: He predicts exponential productivity gains and new business models emerging from AI integration, describing it as a “moment of singularity” for technology and finance.

Investor sentiment: Some analysts remain cautious, recalling SoftBank’s volatile history with tech valuations, but acknowledge that Son’s influence could again shape global investment trends.

AI is more than the next dot-com era – it’s the new tech revolution in creation.

KOSPI down – KOSPI up!

KOSPI rebounds

The Kospi staged a sharp and surprisingly confident rebound on Tuesday, 9 June, clawing back 7% – a meaningful portion of Monday’s bruising 8% plunge.

The reversal was driven less by any single catalyst and more by a collective sense that Monday’s sell‑off had overshot fundamentals.

Bargain hunters moved quickly, snapping up oversold technology and battery names, while institutional investors stepped in to stabilise the market after the previous session’s disorderly drop.

Overnight cues helped sentiment. A steadier tone in U.S. futures and a pause in global risk aversion gave Korean equities room to breathe.

The Won also firmed slightly, easing pressure on foreign flows. By mid‑session, the KOSPI had regained momentum, with traders framing Monday’s collapse as a capitulation move rather than the start of a deeper structural downturn.

The rebound doesn’t erase underlying fragilities, but it does show how quickly sentiment can flip.

From Pullback to Crash: How Market Declines Evolve – Opinion

Markets rarely fall in a straight line. They move through recognisable phases — each with its own tempo, psychology, and structural drivers.

Understanding these stages doesn’t predict the future, but it does anchor expectations in how markets actually behave.

1. Pullback (–3% to –7%) — Duration: Days to Weeks

A pullback is the market taking a breath. It’s usually triggered by a short‑term shock: a hot inflation print, a geopolitical wobble, or simple exhaustion after a strong run.

Pullbacks are fast, shallow, and dominated by technical flows. They typically last 3–15 trading days. Most bull markets experience several each year. They clear froth but rarely change the underlying trend.

2. Correction (–10% to –20%) — Duration: 1–4 Months

A correction is a repricing, not a collapse. It reflects a shift in expectations: earnings disappointment, tightening liquidity, or stretched valuations finally meeting gravity.

The drop to –10% is usually rapid (2–6 weeks), but the stabilisation phase drags on. Corrections often include retests, false dawns, and volatility spikes. They end when positioning resets and macro data stops deteriorating.

3. Bear Market (–20% to –40%) — Duration: 6–18 Months

A bear market is a regime change. Growth slows, earnings contract, and sentiment breaks. Bear markets unfold in waves: an initial shock, a relief rally, then a grinding decline as fundamentals worsen.

The middle phase — the grind — is the longest and most psychologically draining. Policy responses (rate cuts, fiscal support) eventually form the bottoming process, but the recovery is uneven and sector‑specific.

4. Crash (–30% to –50%+) — Duration: Days to Weeks

A crash is not a bigger correction — it’s a liquidity event. Selling becomes indiscriminate, correlations go to one, and markets gap lower because buyers vanish.

Crashes are rare and almost always linked to systemic stress: leverage unwinds, credit freezes, or sudden macro shocks.

They are violent but short. The panic phase typically lasts 5–20 trading days, followed by months of volatility as markets rebuild confidence.

Market Decline Stages at a Glance

StageTypical DeclineTime to ReachTotal DurationKey Drivers
Pullback–3% to –7%2–10 daysDays–2 weeksTechnicals, sentiment
Correction–10% to –20%2–6 weeks1–4 monthsEarnings, valuations, macro
Bear Market–20% to –40%1–3 months6–18 monthsGrowth slowdown, credit tightening
Crash–30% to –50%+DaysDays–weeksLiquidity shock, systemic stress

South Korea’s KOSPI plunges 8%!

Kospi Index falls again

South Korea’s KOSPI index suffered a severe shock on Monday, 8th June, plunging more than 8% in early trading and triggering an automatic 20‑minute circuit breaker as panic selling swept through the market.

The index briefly fell to the mid‑7,400s, marking its third circuit‑breaker event of the year and underscoring the fragility of sentiment after a sharp global tech sell‑off.

Semiconductor heavyweights led the rout. Samsung Electronics slumped more than 8.5%, while SK Hynix dropped over 7%, with additional steep losses across major industrial names including LG Electronics, Hyundai Motor and Samsung SDI.

The sell‑off mirrored a sharp downturn in U.S. markets the previous Friday 5th June 2026, where semiconductor giants such as Nvidia, Broadcom and Micron were hit hard, fuelling fears that the AI‑driven rally had overheated.

A hotter‑than‑expected U.S. jobs report also stoked concerns that the Federal Reserve may lean towards further rate hikes, adding to the risk‑off mood.

Currency markets reflected the stress: the Korean won weakened sharply to around 1,554 per dollar as foreign investors accelerated withdrawals.

Although local institutions and retail investors later stepped in to “buy the dip,” helping trim some losses, the episode highlighted the market’s vulnerability to global tech sentiment and shifting U.S. rate expectations.

Nasdaq’s Rally Snaps as Hot Jobs Data Slams Tech

Nasdaq drops

The Nasdaq Composite endured a bruising session on Friday, 5th June 2026, tumbling more than 4% in its steepest single‑day decline since April 2025.

The sell‑off was triggered by a powerful combination of surging Treasury yields and a violent unwinding in semiconductor and mega‑cap technology stocks, following a far stronger‑than‑expected U.S. jobs report.

Employers added 172,000 jobs in May 2026, more than double economists’ forecasts, a result that swiftly erased hopes of near‑term Federal Reserve rate cuts and instead fuelled expectations of tighter policy for longer.

Chipmakers bore the brunt of the rout. Broadcom, Nvidia, Micron, Marvell and AMD all suffered heavy losses, with the sector’s slump wiping out well over a trillion dollars in market value across the week.

The Nasdaq closed at 25,709.43, down around 4.18%, while the S&P 500 fell 2.6% and the Dow Jones Industrial Average dropped 695 points.

The broader risk‑off mood extended beyond equities. Bitcoin slid below $60,000 for the first time since 2024, while gold and silver also weakened as investors recalibrated expectations for monetary policy.

With Treasury yields climbing above 4.5%, markets ended the week facing renewed questions about valuations, positioning, and the durability of the two‑year AI‑driven rally.

AI Rout Hits Seoul: Kospi Sinks Over 5% as Chip Giants Slide

AI chip stock fall

South Korea’s markets were hit hard on Friday 5th June 2026, with AI‑linked stocks leading a sharp regional sell‑off after Wall Street’s tech slump rippled across Asia.

The Kospi tumbled 5.54%, closing at 8,160.59, its steepest one‑day fall in months, as investors rapidly unwound positions in semiconductor and AI beneficiaries.

Heavyweights Samsung Electronics and SK Hynix were at the centre of the decline, sliding 6.40% and 9.92% respectively. This demonstrates how tightly exposed Seoul’s market has become to the global AI cycle.

The pullback followed a sharp rotation out of chipmakers in the United States, triggered by disappointing revenue data from Broadcom. This shook confidence in the sector’s near‑term momentum.

With AI names having powered much of 2026’s rally, even a modest earnings wobble proved enough to spark a broader de‑risking.

Domestic strain

Domestic pressures added to the strain. South Korea’s labour minister urged major tech firms to share more of their AI‑driven semiconductor profits with workers and suppliers. This is a signal that political scrutiny of the sector is rising just as global sentiment cools.

For now, the sell‑off looks like a reminder of how tightly South Korea’s market is tethered to global AI expectations.

If Wall Street’s AI led enthusiasm falters, Seoul’s tech giants may face a more prolonged test.

Nvidia moves into PCs – All hail Nvidia!

New AI PC chips from Nvidia

Nvidia’s long‑anticipated push into the PC market has finally materialised — and it marks the company’s most aggressive attempt yet to extend its dominance beyond the data centre.

At Computex in Taipei, Jensen Huang unveiled the N1X, an Arm‑based CPU fused with a Blackwell‑class GPU into a new RTX Spark superchip, set to appear this autumn in premium Windows laptops from Microsoft, Dell, HP, ASUS, Lenovo and MSI .

The move is strategically significant. For decades, the PC’s central processor has been the guarded territory of Intel and AMD, with Apple’s M‑series proving the only major Arm‑based disruption.

Nvidia is now entering that arena with a design built explicitly for the age of agentic AI — machines that run multiple AI processes simultaneously, shifting huge volumes of data between GPU and CPU.

Nvidia has argued for months that CPUs have become the bottleneck in modern AI workflows, and the N1X is its answer: a custom Arm design, co‑developed with Microsoft and manufactured on TSMC’s 3‑nanometre process, paired with 128GB of unified memory for high‑bandwidth compute.

Huang framed the launch as a generational reset: “the first completely re‑engineered, reinvented line of PCs in 40 years.” It’s hyperbole with intent.

Nvidia wants to define the AI PC in the same way it defined the AI data centre — not as an incremental upgrade, but as a new category.

More than 30 laptops and 10 desktops are reportedly planned over time, with early models aimed at creators, AI developers and high‑end gamers seeking thin, light machines with workstation‑level capability.

The competitive implications are profound. Arm‑based computing is accelerating across the industry, and Nvidia’s arrival puts direct pressure on Intel and AMD just as both are scrambling to articulate their own AI‑centric roadmaps.

If RTX Spark delivers the performance uplift Nvidia promises, the centre of gravity in the PC market could shift rapidly — from x86 incumbents to a company that has already rewritten the rules of modern computing once.

All hail Nvidia.

The Coming Shockwave: How Three Mega‑IPOs Could Reshape the S&P 500 and Nasdaq – Opinion

IPOs for SpaceX, OpenAI and Anthropic

The expected public listings of SpaceX, OpenAI and Anthropic represent the most consequential cluster of IPOs in two decades.

Each company sits at the centre of a structural shift—space infrastructure, frontier AI models and safety‑driven AI systems—and each is likely to command a valuation in the high hundreds of billions, if not beyond.

Their arrival on public markets will not be a routine liquidity event. It will be a reordering of index composition, capital flows and investor psychology.

At the mechanical level, the impact on the S&P 500 and Nasdaq will be immediate. Index providers now operate fast‑entry rules that allow very large IPOs to join major benchmarks within days rather than months.

This compresses the adjustment period and forces passive funds to sell existing constituents to make room for the newcomers.

The selling pressure will fall disproportionately on the current megacap cohort—Microsoft, Apple, Alphabet, Amazon, Meta, Nvidia and Tesla—because these names dominate index weightings and therefore become the primary source of liquidity for rebalancing.

The indices themselves may not fall sharply, but the internal rotation will be violent.

The Nasdaq will feel the shock most acutely. Its concentration in technology means the inclusion of three new giants will trigger a scramble for weight, with ETFs forced to buy limited‑float shares at whatever price the market sets.

The S&P 500, broader and more liquid, will absorb the change more smoothly, but even there the effect will be visible: a temporary dip in existing leaders, a spike in volatility and a rapid reshaping of the top‑ten constituents.

The S&P 500 and Nasdaq will almost certainly experience a temporary liquidity shock, a forced rotation out of existing megacaps, and then—once the dust settles—a re‑concentration around the new AI/space giants.

The scale of SpaceX, OpenAI and Anthropic means the indices will not be able to absorb them quietly.

What will likely happen when SpaceX, OpenAI and Anthropic list their IPOs?

1. A mechanical sell‑off in today’s biggest tech names

Index funds must sell existing holdings to make room for the new entrants.

  • Goldman Sachs notes passive funds will need to rebalance as soon as these mega‑caps are added.
  • JPMorgan estimates that at a $2T valuation, up to $95bn of the eight largest tech stocks may need to be sold to rebalance portfolios.

This means pressure on Nvidia, Apple, Microsoft, Alphabet, Amazon, Meta, Tesla, Broadcom—the very names currently carrying the indices.

2. Fast‑entry rules accelerate the shock

Nasdaq’s new “fast entry” rules allow these companies to join the Nasdaq 100 within 15 days of listing. S&P Dow Jones is considering similar fast‑track inclusion for mega‑caps. The Motley Fool

This compresses what used to be a 12‑month absorption period into weeks.

3. Liquidity drain is real—but limited in absolute terms

Deutsche Bank estimates that even the largest IPOs would still represent just over 0.1% of S&P 500 market cap. So the market‑wide liquidity drain is modest, but the rotation effect is violent because it concentrates selling in a handful of megacaps.

4. ETF flows will be chaotic

Strategas warns that ETFs tracking trillions will compete for a tiny float, making inclusion “frantic.” SpaceX is reportedly floating only ~5% of shares initially. That means forced buying at any price, followed by forced selling elsewhere.

5. After lockups expire (180 days), the second wave hits

SpaceX’s prospectus notes that selling pressure increases as lockups roll off in phases over 180 days. Expect a two‑stage impact:

  • Stage 1: violent index rebalancing
  • Stage 2: insider‑driven supply shock

So what happens to the S&P 500?

Short-term (0–3 months after IPOs):

  • Mild index-level dip as megacaps are sold to fund inclusion.
  • Volatility spike around rebalance windows.
  • Narrow leadership becomes even narrower temporarily.

This is consistent with historical mega‑IPO patterns (e.g., Tesla’s inclusion forced tens of billions in one-day flows).

Medium-term (3–12 months):

  • The S&P 500 becomes more top‑heavy, not less.
  • SpaceX, OpenAI, Anthropic quickly become meaningful index weights due to their trillion‑dollar valuations.
  • If AI earnings continue to dominate, the index likely recovers and re‑concentrates around the new entrants.

HSBC reportedly notes that stronger tech valuations—especially from high‑valuation IPOs—could push the S&P 500 above 8,000 if earnings broaden.

What about the Nasdaq?

The Nasdaq 100 is hit harder because:

  • It is more tech‑concentrated.
  • Fast‑entry rules force inclusion within 15 days.

Expect:

  • Sharper rotation, especially out of semiconductor and hyperscaler names.
  • Higher volatility as QQQ must buy the new entrants aggressively.
  • A structural reshaping: SpaceX, OpenAI and Anthropic could become low‑ to mid‑single‑digit weights almost immediately.

The contrarian view (Michael Burry)

Burry argues the IPOs won’t break the bull market, because IPOs float only a “small little bit” of shares, limiting true supply impact. He believes narrative > mechanics.

There’s truth in that: the story of AI and space‑compute may ultimately lift the indices after the initial turbulence.

My Opinion

Short-term: Expect a sell‑off in existing megacaps, a volatility spike, and mechanical downward pressure on both S&P 500 and Nasdaq.

Medium-term: Once the forced rotation is complete, the indices likely resume their upward trend, now with three new trillion‑dollar engines powering them.

Long-term: This is the biggest index‑composition shock since the dot‑com era. The S&P 500 and Nasdaq will become even more dominated by AI‑infrastructure and space‑compute giants.

In other words: the indices wobble, then re‑concentrate, then march higher—unless AI demand itself cracks.

If that happens then we’ll most likely witness a crash!