Stock market roundup of latest all-time highs! October 2025

Stocks hit all-time high

Scaling the Summit: Markets Hit Record Highs Amid Global Uncertainty led by the Nasdaq and S&P 500 reflecting the AI race

Global stock hit new highs October 2025

šŸŒ CountryšŸ“ˆ Index NamešŸ—“ļø DatešŸ” Closing Value
šŸ‡ŗšŸ‡ø United StatesS&P 500Oct 276,875.16
šŸ‡ŗšŸ‡ø United StatesDow JonesOct 2747,544.59
šŸ‡ŗšŸ‡ø United StatesNasdaq CompositeOct 2723,637.46
šŸ‡¬šŸ‡§ United KingdomFTSE 100Oct 249,662.00
šŸ‡³šŸ‡± NetherlandsAEX IndexOct 28966.82
šŸ‡®šŸ‡³ IndiaNifty 50Oct 2825,966
šŸ‡®šŸ‡³ IndiaSensexOct 2884,778.84
šŸ‡ÆšŸ‡µ JapanNikkei 225Oct 2850,342.25
šŸ‡ÆšŸ‡µ JapanTOPIXOct 283,285.87

These rallies were largely fueled by optimism over a potential U.S.–China trade deal, cooler inflation data, and expectations of interest rate cuts from the Fed.

Is there a market crash, correction or a pullback coming to a stock market near you soon?

Nikkei 225 Breaks 50,000: A Milestone Fueled by Tech Trade and Policy Optimism

Nikkei at new all-time high!

Japan’s benchmark Nikkei 225 index surged past the 50,000 mark for the first time in history, marking a symbolic milestone for Asia’s second-largest economy.

The rally reflects a potent mix of domestic resilience, global investor appetite, and strategic policy shifts that have redefined Japan’s market narrative.

The breakthrough comes amid renewed optimism surrounding U.S.-China trade negotiations, with President Trump signalling progress ahead of a key meeting with Japan’s Sanae Takaichi.

Investors are betting on a thaw in geopolitical tensions, which could unlock export growth for Japan’s tech-heavy industrial base.

Driving the rally are heavyweight stocks in semiconductors, robotics, and AI infrastructure—sectors buoyed by global demand and Japan’s push to become a regional data hub.

Nikkei 225 Index at new history high above 50,000

Companies like Tokyo Electron and SoftBank have seen double-digit gains, fuelled by bullish earnings and strategic pivots toward AI and automation.

Domestically, the Bank of Japan’s continued accommodative stance has kept borrowing costs low, while corporate governance reforms have attracted foreign capital.

The weaker yen has also boosted exporters, making Japanese goods more competitive abroad.

Symbolically, the 50,000 threshold represents more than just market exuberance—it’s a vote of confidence in Japan’s ability to adapt, innovate, and lead in a shifting global landscape.

While risks remain—from demographic headwinds to geopolitical flashpoints—the Nikkei’s ascent signals a new era of investor engagement with Japan’s evolving economic story.

Markets on a Hair Trigger: Trump’s Tariff Whiplash and the AI Bubble That Won’t Pop

Markets move as Trump tweets

U.S. stock markets are behaving like a mood ring in a thunderstorm—volatile, reactive, and oddly sentimental.

One moment, President Trump threatens a ‘massive increase’ in tariffs on Chinese imports, and nearly $2 trillion in market value evaporates.

The next, he posts that: ‘all will be fine‘, and futures rebound overnight. It’s not just policy—it’s theatre, and Wall Street is watching every act with bated breath.

This hypersensitivity isn’t new, but it’s been amplified by the precarious state of global trade and the towering expectations placed on artificial intelligence.

Trump’s recent comments about China’s rare earth export controls triggered a sell-off that saw the Nasdaq drop 3.6% and the S&P 500 fall 2.7%—the worst single-day performance since April.

Tech stocks, especially those reliant on semiconductors and AI infrastructure, were hit hardest. Nvidia alone lost nearly 5%.

Why so fickle? Because the market’s current rally is built on a foundation of hope and hype. AI has been the engine driving valuations to record highs, with companies like OpenAI and Anthropic reaching eye-watering valuations despite uncertain profitability.

The IMF and Bank of England have both warned that we may be in stage three of a classic bubble cycle6. Circular investment deals—where AI startups use funding to buy chips from their investors—have raised eyebrows and comparisons to the dot-com era.

Yet, the bubble hasn’t burst. Not yet. The ‘Buffett Indicator‘ sits at a historic 220%, and the S&P 500 trades at 188% of U.S. GDP. These are not numbers grounded in sober fundamentals—they’re fuelled by speculative fervour and a fear of missing out (FOMO).

But unlike the dot-com crash, today’s AI surge is backed by real infrastructure: data centres, chip fabrication, and enterprise adoption. Whether that’s enough to justify the valuations remains to be seen.

In the meantime, markets remain twitchy. Trump’s tariff threats are more than political posturing—they’re economic tremors that ripple through supply chains and investor sentiment.

And with AI valuations stretched to breaking point, even a modest correction could trigger a cascade.

So yes, the market is fickle. But it’s not irrational—it’s just balancing on a knife’s edge between technological optimism and geopolitical anxiety.

One tweet can tip the scales.

Fickle!

Nikkei surges past 48,000 as Japan embraces political shift

Nikkei index surges to record high!

Japan’s benchmark Nikkei 225 index soared past the symbolic 48,000 mark on Monday 6th October 2025 in intraday trading, marking a new all-time high and underscoring investor confidence in the country’s shifting political landscape.

The index closed at 47944.76, up approximately 4.15% from Friday’s session, driven by a wave of optimism surrounding the Liberal Democratic Party’s leadership transition.

Nikkei 225 smashes to new record high October 6th 2025

Sanae Takaichi, a staunch conservative with deep ties to former Prime Minister Shinzo Abe, has emerged as the frontrunner to lead the party—and potentially become Japan’s first female prime minister.

Her pro-growth stance, admiration for Margaret Thatcher, and commitment to industrial revitalisation have sparked hopes of continued economic liberalisation.

The yen weakened boosting export-heavy sectors such as automotive and electronics. Toyota and Sony led the charge, with gains of 5.1% and 4.8% respectively.

Analysts also pointed to easing U.S. bond yields and a rebound on Wall Street as contributing factors.

While the rally reflects renewed market enthusiasm, it also raises questions about Japan’s long-term structural challenges—from demographic decline to mounting public debt.

For now, however, the Nikkei’s ascent offers a potent symbol of investor faith in Japan’s evolving political and economic narrative.

Wall Street’s euphoric surge sparks warnings of imminent pullback

Wall Street market warning!

Despite a backdrop of economic uncertainty and a partial government shutdown, Wall Street’s three major indices—the S&P 500, Nasdaq Composite, and Dow Jones Industrial Average—closed at record highs on Thursday 2nd October 2025, fuelling concerns that investor confidence may be tipping into excess.

The S&P 500 edged up 0.06%, continuing its relentless climb, while the Nasdaq and Dow Jones followed suit, buoyed by gains in tech giants like Nvidia and Intel.

Nvidia, now the world’s most valuable company, hit an all-time high, and Intel surged over 50% in the past month thanks to strategic partnerships.

Yet beneath the surface of this bullish momentum, market analysts are sounding the alarm. Sector rotation data from the S&P 500 reveals a concentration of capital in high-growth tech and consumer discretionary stocks, suggesting a narrowing rally.

This kind of sector skew often precedes a correction, as it reflects overconfidence in a few outperformers while broader market fundamentals remain shaky.

Triple High, Thin Ice: Wall Street’s record rally masks sector fragility and looming potential pullback

Adding to the unease is the state of the U.S. labour market. Hiring is down 58% year-to-date compared to 2024, marking the lowest level since 2009.

Although the jobless rate remains stable at 4.34%, the Chicago Fed’s indicators reportedly paint a picture of an economy that’s ‘low fire, low hire’—a phrase echoed by Federal Reserve Chair Jerome Powell.

Treasury Secretary Scott Bessent warned that the ongoing government shutdown could dent economic growth, but investors appear unfazed.

Some analysts argue that this detachment from macroeconomic risks reflects a dangerous complacency. Fundstrat even reportedly projected the S&P 500 could reach 7,000 by year-end—a bold forecast that, while technically possible, may hinge more on sentiment than substance.

The Nasdaq’s surge has been particularly pronounced, driven by speculative enthusiasm around AI and semiconductor stocks.

Meanwhile, the Dow Jones, traditionally seen as a bellwether for industrial strength, has benefited from defensive plays and dividend-rich stocks, masking underlying fragilities.

In sum, while Thursday’s triple record close is a milestone worth noting, it may also be a warning sign. With sector gauges flashing ‘excessive’ confidence and economic indicators sending mixed signals, investors would do well to temper their optimism.

A pullback may not be imminent, but it’s certainly plausible—and perhaps overdue.

As the bull charges ahead, the question remains: how long can it run before the bear catches up?

Bleak news from U.S. doesn’t seem that bad for stocks – what’s going on?

Bleak Headlines vs. Market Optimism

It’s one of those classic Wall Street paradoxes—where bad news somehow fuels bullish momentum. What’s going on?

News round-up

S&P 500 closes above 6,700 after rising 0.34%. Samsung and SK Hynix join OpenAI’s Stargate. Taiwan rejects U.S. proposal to split chip production. Trump-linked crypto firm plans expansion. Some stocks that doubled in the third quarter.

Bleak Headlines vs. Market Optimism

U.S. Government Shutdown: The federal government ground to a halt, but markets didn’t flinch. In fact, the S&P 500 rose 0.34% and closed above 6,700 for the first time.

ADP Jobs Miss: Private payrolls fell by 32,000 in September 2025, a sharp miss – at least compared to the expected 45,000 gain. Yet traders shrugged it off as other bad news is shrugged off too!

Fed Rate Cut Hopes: Weak data often fuels expectations that the Federal Reserve will cut interest rates. Traders are now betting on a possible cut in October 2025, which tends to boost equities.

Historical Pattern: According to Bank of America, the S&P 500 typically rises ~1% in the week before and after a government shutdown. So, this isn’t unprecedented—it’s almost ritualistic at this point.

Why the Market’s Mood Diverges

Animal Spirits: Investors often trade on sentiment and positioning, not just fundamentals. If they believe the Fed will ease policy, they’ll buy risk assets—even in the face of grim news.

Data Gaps: With the Bureau of Labor Statistics’ official jobs report delayed due to the shutdown, the ADP report gains more weight. But it’s historically less reliable, so traders may discount it.

Tech Tailwinds: AI stocks and semiconductor news (e.g., Samsung and SK Hynix joining OpenAI’s Stargate) are buoying sentiment, especially in Asia-Pacific markets.

U.S. Government Shutdown October 2025

Prediction

Traders in prediction markets are betting the shutdown will last around two weeks. Nothing too radical, since that’s the average length it takes for the government to reopen, based on data going back to 1990.

The government stoppage isn’t putting the brakes on the stock market momentum. Are investors getting too adventurous?

History shows the pattern is not new. The S&P 500 has risen an average of 1% the week before and after a shutdown, according to data from BofA.

Even the ADP jobs report, which missed expectations by a wide margin, did little to subdue the animal spirits.

Private payrolls declined by 32,000 in September 2025, according to ADP, compared with a 45,000 increase reportedly estimated by a survey of economists.

Payroll data

The Bureau of Labor Statistics’ (BLS) official nonfarm payrolls report is now stuck in bureaucratic purgatory and likely not being released on time.

The U.S. Federal Reserve might place additional weight on the ADP report — though it’s not always moved in sync with the BLS numbers. Traders expect weak data would prompt the Fed to cut interest rates in October 2025.

It’s a bit like watching a storm roll in while the crowd cheers for sunshine—markets are forward-looking, and sometimes they see silver linings where others see clouds.

Summary

EventDetail
šŸ›ļø Government ShutdownBegan Oct 1, 2025. Traders expect ~2 weeks based on historical average
šŸ“‰ ADP Jobs ReportPrivate payrolls fell by 32,000 vs. expected +45,000
šŸ“ˆ S&P 500 CloseRose 0.34% to close above 6,700 for the first time
šŸ’ø Fed Rate Cut ExpectationsTraders now pricing in a possible October cut

U.S. indices hit fresh record closing highs 9th September 2025

U.S. indices hit new highs!

S&P 500 rose 0.3% to finish at 6,512.61, surpassing its previous record from last week.

Dow Jones Industrial Average climbed 0.4% to 45,711.34, beating its August 28 high.

Nasdaq Composite added 0.4%, closing at 21,879.49, marking its second consecutive record high.

The rally was fueled by strong performances in tech—especially chipmakers and AI infrastructure players like Nvidia and Oracle—and growing expectations of a Federal Reserve rate cut.

Negative news is not affecting the market as the Nasdaq hits a new high!

Nasdaq rockets to new high

The Nasdaq Composite closed at a record high of 21,798.70 on Monday, 8th September 2025. That 0.45% gain was driven largely by a rally in chip stocks—Broadcom surged 3.2%, and Nvidia added nearly 1%.

The broader market also joined the party:

  • S&P 500 rose 0.21% to 6,495.15
  • Dow Jones Industrial Average climbed 0.25% to 45,514.95

Investor optimism is swirling around potential Federal Reserve rate cuts, especially with inflation data due later this week. The market’s momentum seems to be riding a wave of AI infrastructure spending and tech sector strength.

Negative news is not affecting the market – but why?

  • The Nasdaq Composite closes at a record high on Monday 8th September 2025.
  • Refunds could hit $1 trillion if tariffs are deemed illegal.
  • China’s Xpeng eyes global launch of its Mona brand.
  • French Prime Minister Francois Bayrou loses no-confidence vote.
  • UK deputy PM resigns after tax scandal.

Stocks are rising despite August’s dismal jobs report because investors are interpreting the weak labor data as a signal that interest rate cuts may be on the horizon—and that’s bullish for equities.

šŸ“‰ The contradiction at the heart of the market The U.S. economy showed signs of slowing, with job numbers actually declining in June and August’s report falling short of expectations.

Normally, that would spook investors—fewer jobs mean less consumer spending, which hurts corporate earnings and stock prices.

šŸ“ˆ But here’s the twist Instead of panicking, markets rallied. The Nasdaq Composite hit a record high, and the S&P 500 and Dow Jones also posted gains.

Why? Because a weaker jobs market increases the likelihood that the Federal Reserve will cut interest rates to stimulate growth. Lower rates make borrowing cheaper and boost valuations—especially for tech stocks.

šŸ¤– AI’s role in the rally Tech firms, particularly those tied to artificial intelligence like Broadcom and Nvidia, led the charge.

The suggestion is that investors may be viewing job cuts as a sign that AI is ‘working as intended’—streamlining operations and improving margins. Salesforce and Klarna, for instance, have both reportedly cited AI as a reason for major workforce reductions.

Summary

IndicatorValue / ChangeInterpretation
Nasdaq CompositešŸ“ˆ 21,798.70 (Record High)Tech ledĀ rally,Ā 
investorĀ optimism
S&P 500āž• 6,495.15Broad market strength
Dow Jonesāž• 45,514.95Industrial resilience
August Jobs ReportšŸ“‰ Missed expectationsLabourĀ marketĀ weakness
Job Growth (June & Aug)šŸ“‰ NegativeEconomic slowdown
Investor Reaction🟢 Rate cuts expectedBullish for equities
AI Layoff NarrativešŸ¤–Ā ‘EfficiencyĀ gains’TechĀ streamliningĀ 
Featured StocksBroadcom +3.2%, Nvidia +0.9%AIĀ infrastructureĀ driving
Infographic summary

So, while the jobs report paints a gloomy picture for workers, the market sees a silver lining: rate relief and tech-driven efficiency.

It’s a classic case of Wall Street optimism—where bad news for Main Street can be good news for stock prices.

The career ladder is broken—but the Nasdaq is building a rocket.

The Fed up next to move the market.

Another new high for the S&P 500 as Wall Street keeps on giving

S&P 500 at new all-time high!

The S&P 500 has notched yet another all-time high, closing at 6501.86 on 28th August 2025

This surge reflects broad investor optimism, driven by strong corporate earnings and expectations of a more accommodative stance from the Federal Reserve.

With tech, healthcare, and financials all contributing to the rally and the indices continued momentum.

Wall Street keeps on giving

Another high for the S&P 500.Ā The index added 0.32% Thursday andĀ closed above the 6,500 levelĀ for the first time.Ā Asia-Pacific markets had a mixed performance on Friday 29th August 2025, with Japanese stocks declining as core consumer prices in Tokyo showed slower growth in August.

S&P 500 one-month cart as it hist new all-time high on 28th August 2025

U.S. second-quarter GDP – revised higher than expected.Ā The economy grew at an annualized rate of 3.3%, according to the Commerce Department’s second estimate, surpassing the initial estimate of 3.0% and the Dow Jones consensus forecast of 3.1%.

Two customers made up 39% of Nvidia’s second-quarter revenue.Ā According to Nvidia’s financial filing this week (August 2025), the customers could be either cloud providers or manufacturers, but not much else is known about their identities.

Global stocks indices flying high as new records broken – 12th August 2025

New records for global indices led by U.S. tech

In a sweeping rally that spanned continents and sectors, major global indices surged to fresh record highs yesterday, buoyed by cooling inflation data, renewed hopes of U.S. central bank rate cuts, and easing trade tensions.

U.S. inflation figures released 12th August 2025 for July came in at: 2.7% – helping to lift markets to new record highs!

U.S. Consumer Price Index — July 2025

MetricValue
Monthly CPI (seasonally adjusted)+0.2%
Annual CPI (headline)+2.7%
Core CPI (excl. food & energy)+0.3% monthly, +3.1% annual

Despite concerns over Trump’s sweeping tariffs, the U.S. July 2025 CPI came in slightly below expectations (forecast was 2.8% annual).

Economists noted that while tariffs are beginning to show up in certain categories, their broader inflationary impact remains modest — for now.

Global Indices Surged to Record Highs Amid Rate Cut Optimism and Tariff Relief

Tuesday, 12 August 2025 — Taking Stock

šŸ“ˆ S&P 500: Breaks Above 6,400 for First Time

  • Closing Level: 6,427.02
  • Gain: +1.1%
  • Catalyst: Softer-than-expected U.S. CPI data (+2.7% YoY) boosted bets on a September rate cut, with 94% of traders now expecting easing.
  • Sector Drivers: Large-cap tech stocks led the charge, with Microsoft, Meta, and Nvidia all contributing to the rally.

šŸ’» Nasdaq Composite & Nasdaq 100: Tech Titans Lead the Way

  • Nasdaq Composite: Closed at a record 21,457.48 (+1.55%)
  • Nasdaq 100: Hit a new intraday high of 23,849.50, closing at 23,839.20 (+1.33%)
  • Highlights:
    • Apple surged 4.2% after announcing a $600 billion U.S. investment plan.
    • AI optimism continues to fuel gains across the Magnificent Seven stocks.

Nasdaq 100 chart 12th August 2025

Nasdaq 100 chart 12th August 2025

🧠 Tech 100 (US Tech Index): Momentum Builds

  • Latest High: 23,849.50
  • Weekly Gain: Nearly +3.7%
  • Outlook: Traders eye a breakout above 24,000, with institutional buying accelerating. Analysts note a 112% surge in net long positions since late June.

šŸ‡ÆšŸ‡µ Nikkei 225: Japan Joins the Record Club

  • Closing Level: 42,718.17 (+2.2%)
  • Intraday High: 43,309.62
  • Drivers:
    • Relief over U.S. tariff revisions and a 90-day pause on Chinese levies.
    • Strong earnings from chipmakers like Kioxia and Micron.
    • Speculation of expanded fiscal stimulus following Japan’s recent election results.

🧮 Market Sentiment Snapshot

IndexRecord Level Reached% Gain YesterdayKey Driver
S&P 5006,427.02+1.1%CPI data, rate cut bets
Nasdaq Comp.21,457.48+1.55%AI optimism, Apple surge
Nasdaq 10023,849.50+1.33%Tech earnings, institutional buying
Tech 10023,849.50+1.06%Momentum, bullish sentiment
Nikkei 22543,309.62+2.2%Tariff relief, chip rally

šŸ“Š Editorial Note: While the rally reflects strong investor confidence, analysts caution that several indices are approaching technical overbought levels.

The Nikkei’s RSI, for instance, has breached 75, often a precursor to short-term pullbacks.

Technical Signals: Cracks beneath the surface – are U.S. stocks beginning to stumble?

Stock correction?

There are increasingly credible signs that U.S. stocks may be heading into a deeper adjustment phase.

Here’s a breakdown of the key indicators and risks that suggest the current stumble could be more than a seasonal wobble. It’s just a hypothesis, but…

  • S&P 500 clinging to its 200-day moving average: While the long-term trend remains intact, short-term averages (5-day and 20-day) have turned negative.
  • Volatility Index (VIX) rising: A 7.61% surge in the 20-day average VIX suggests growing unease, even as prices remain elevated.
  • Diverging ADX readings: The S&P 500’s ADX (trend strength) is weak at 7.57, while the VIX’s ADX is strong at 45.37—classic signs of instability brewing.

🧠 Sentiment & Positioning: Optimism with Defensive Undercurrents

  • Investor sentiment is bullish (40.3%), but rising put/call ratios and a complacent Fear & Greed Index hint at hidden caution.
  • Historical parallels: Similar sentiment setups preceded corrections in 2021 and 2009. We’re not at extremes yet, but the complacency is notable.

šŸŒ Macroeconomic Risks: Tariffs, Fed Policy, and Structural Headwinds

  • Tariff escalation: Trump’s recent executive order raised effective tariffs to 15–20%, with new duties on rare earths and tech-critical imports.
  • Labour market weakening: July’s jobs report showed just 73,000 new jobs, with massive downward revisions to prior months. Unemployment ticked up to 4.2%.
  • Fed indecision: The central bank is split, with no clear path on rate cuts. This uncertainty is amplifying volatility.
  • Structural drag: Reduced immigration and R&D funding are eroding long-term growth potential.
  • šŸ›”ļø Strategic Implications: How Investors Are Hedging
  • Defensive sectors like utilities, healthcare, and gold are gaining traction.
  • VIX futures and Treasury bonds are being used to hedge against volatility.
  • Emerging markets with trade deals (e.g., Vietnam, Japan) may outperform amid global realignment.
  • šŸ—“ļø Seasonal Weakness: August and September Historically Slump
  • August is the worst month for the Dow since 1988, and the second worst for the S&P 500 and Nasdaq.
  • Wolfe Research reportedly notes average declines of 0.3% (August) and 0.7% (September) since 1990.
  • Sahm Rule: Recession indicator.

Now what?

While the broader market still shows resilience—especially in mega-cap tech—the underlying signals point to fragility.

Elevated valuations, weakening macro data, and geopolitical uncertainty are converging. A deeper correction isn’t guaranteed, but the setup is increasingly asymmetric: limited upside, growing downside risk.

Wall Street surges: S&P 500 breaks 6300 as tech optimism outpaces tariff tensions

Record highs!

The S&P 500 closed above 6,300 for the first time in history on Monday 21st July 2025, while the Nasdaq Composite notched yet another record, finishing at 20,974.17.

Investor enthusiasm for upcoming tech earnings has eclipsed broader concerns over looming global tariffs, fuelling a rally in major indexes.

Despite marginal losses in the Dow Jones Industrial Average, the tech-heavy Nasdaq rose 0.38% while the S&P 500 climbed 0.14%, buoyed by gains in heavyweights like Meta Platforms, Alphabet, and Amazon.

With over 60 S&P 500 companies having reported so far this earnings season, more than 85% have exceeded expectations, according to FactSet.

S&P 500 and Nasdaq Comp at new record highs 21st July 2025

redo the charts side by side and correct the S&P 500 value
S&P 500 and Nasdaq Comp at new record highs 21st July 2025

Alphabet shares advanced over 2% ahead of Wednesday’s results, and Tesla headlines the ‘Magnificent Seven’ group expected to drive the bulk of earnings growth this quarter. And not necessarily for the right reason.

Analysts reportedly expect the group to deliver 14% growth year-on-year, far outpacing the remaining S&P constituents’ average of 3.4%.

S&P 500

Despite tariff tensions simmering — with the U.S. setting a 1st August deadline for levy enforcement — investor sentiment remains bullish.

Bank of America estimates Q2 earnings are tracking a 5% annual increase, suggesting resilience amid geopolitical headwinds.

Strategists warn of potential volatility, as earnings surprises or policy shifts could spark swift market reactions.

Still, some analysts see space for further upside, projecting a potential S&P climb to 6,600 before any meaningful pullback.

As the tech titans prepare to report, all eyes are on whether optimism can keep the rally alive — or if tariffs will return to centre stage.

From FANG stocks, MAG 7 stocks to AI – the tech titans just keep giving.

But when will it overload?

Trump tariff roll-back – a win for China? U.S. markets rejoice the ‘deal’

U.S. markets gain on U.S China tariff roll-back announcement

The U.S. stock market surged as investors cheered a breakthrough in trade negotiations between Washington and Beijing.

The rollback of tariffs, announced as part of a new trade agreement, sent the S&P 500, Dow Jones Industrial Average, and Nasdaq Composite soaring.

The deal, which slashes ‘reciprocal’ tariffs on both sides, is seen as a major de-escalation in the ongoing trade war that has rattled global markets for years.

Wall Street’s Reaction

Markets responded with enthusiasm as the Dow Jones Industrial Average jumped over 1,000 points, while the S&P 500 climbed more than 2.5%, and the Nasdaq surged by nearly 3%.

Investors had been wary of prolonged trade tensions, which had weighed heavily on corporate earnings and economic growth.

The tariff rollback signals a potential thaw in relations, boosting confidence across sectors, particularly in technology, retail, and manufacturing.

Tariff rollback

Under the agreement, U.S. tariffs on Chinese imports will be reduced from 145% to 30%, while China’s tariffs on American goods will drop from 125% to 10%. The reductions will be in effect for 90 days, allowing both nations to continue negotiations on a broader trade framework.

Treasury Secretary Scott Bessent emphasised that neither side wants a complete decoupling, and the rollback is intended to restore trade flows disrupted by years of economic brinkmanship.

China’s perspective: A strategic victory?

While the U.S. markets celebrated, China views the deal as a significant win. Beijing has sought relief from the steep tariffs imposed by Washington, which had strained its export-driven economy.

The agreement not only reduces financial pressure on Chinese manufacturers but also positions China as a key player in shaping future trade policies.

Some analysts argue that Beijing successfully leveraged its economic resilience to push Washington toward concessions, reinforcing its global influence.

Looking ahead

Despite the optimism, uncertainties remain. The 90-day window for negotiations suggests that further trade disputes could arise if talks stall. But will the U.S. allow that after the stock market turmoil Trump’s tariffs originally created?

Additionally, Federal Reserve Chair Jerome Powell cautioned that while sentiment has improved, the economic impact of previous tariffs has yet to fully materialise. Investors will be watching closely for signs of sustained progress, as any setbacks could trigger renewed volatility.

For now, Wall Street is basking in the relief of a tariff truce, with hopes that this momentum will lead to a more stable and predictable trade environment.

Whether this marks the beginning of a lasting resolution or just a temporary reprieve remains to be seen.

It is most likely now a platform for the U.S. to benefit from generally lower tariffs in the future.

There will again be cheap goods on U.S. shelves in time for Christmas.

Stock markets see three-day recovery as U.S. tech boost offsets trade worries – but for how long?

Tech gains

Global markets have shown resilience in the past three days, rebounding from recent downturns as technology stocks rally amid cautious optimism.

The boost in investor confidence follows strong earnings reports from major tech firms, highlighting their ability to weather economic uncertainty.

However, lingering concerns about international trade tensions raise questions about how sustainable this recovery truly is.

Technology stocks have led the charge, with companies in artificial intelligence, cloud computing, and semiconductor production posting better-than-expected growth figures.

Investors have flocked to these sectors, hoping that innovation will drive forward profitability even amid broader market volatility.

This renewed enthusiasm has helped offset concerns over ongoing global trade disputes, which have led to tariffs and economic slowdowns in key sectors such as manufacturing and consumer goods.

Yet, beneath this recovery, risks persist. Geopolitical uncertainties, including unresolved trade negotiations between major economies, continue to cast a shadow over financial markets.

Inflationary pressures, alongside tightening monetary policies by central banks, also threaten to cool investor enthusiasm. Analysts warn that without concrete progress on trade agreements; the rebound may be short-lived.

As investors weigh the competing forces of technological optimism and trade anxieties, the market remains in a delicate balance.

The question remains: Is this recovery a sign of renewed growth, or merely a temporary respite before further economic turbulence?

With the next wave of financial reports and policy decisions on the horizon, market makers will be closely monitoring whether the tech sector’s momentum can sustain broader economic confidence – or whether trade headwinds will ultimately pull markets back into uncertainty again.

Tech gains ground again


Stocks jumped Thursday 24th April 2024 thanks to strong gains in Mega Cap tech names.

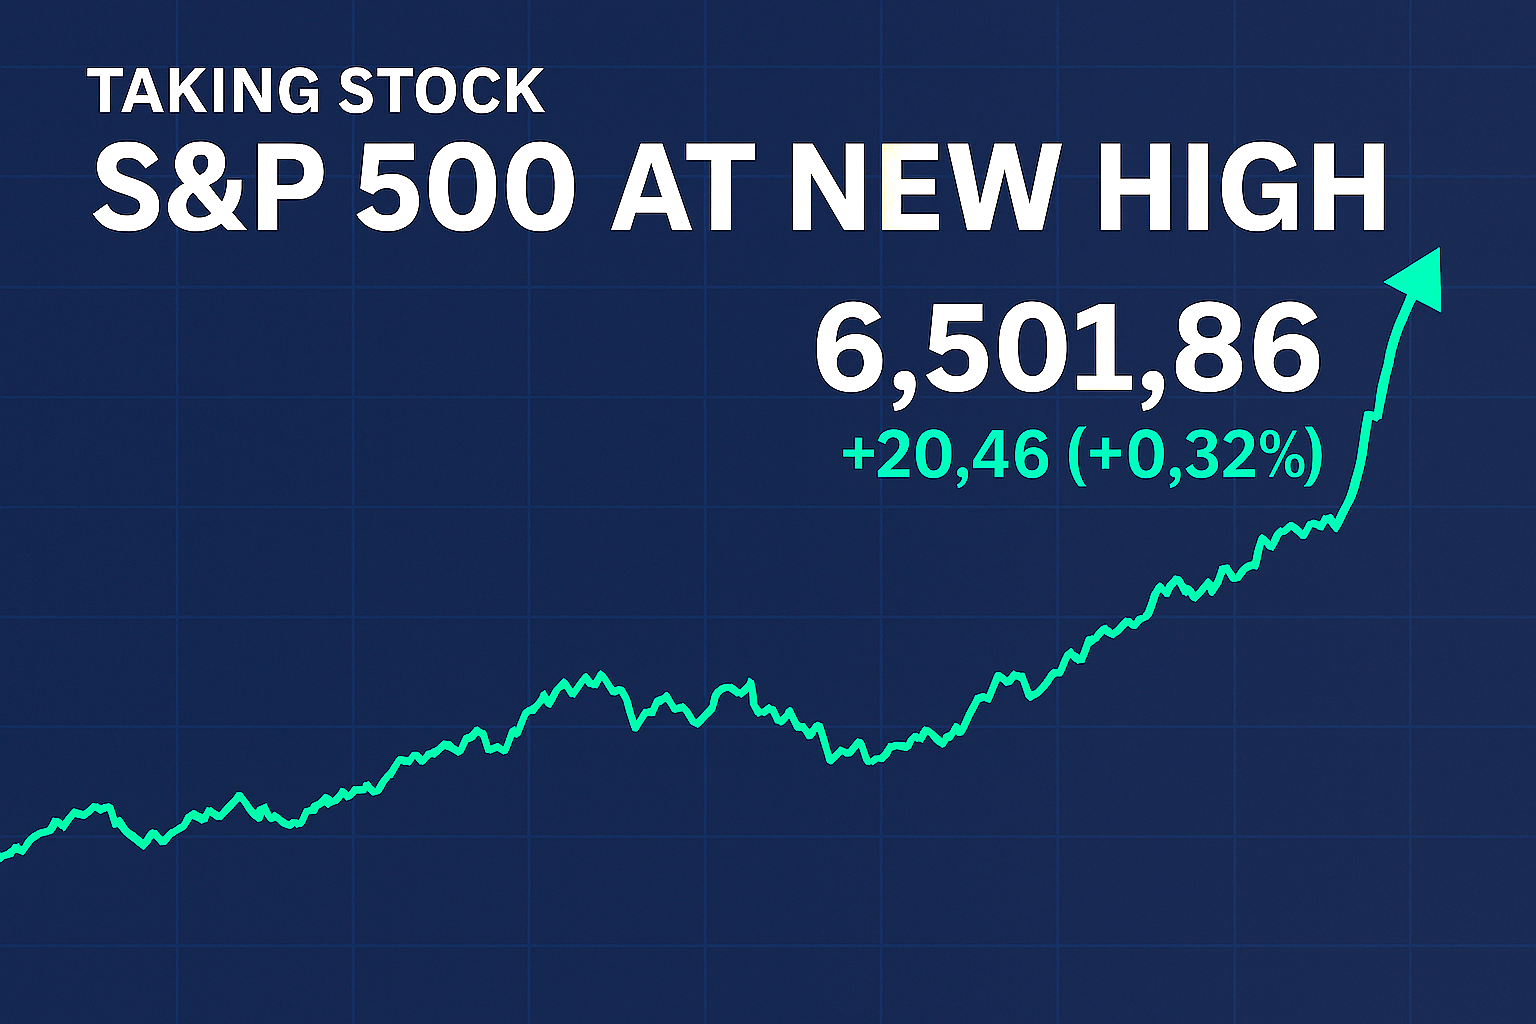
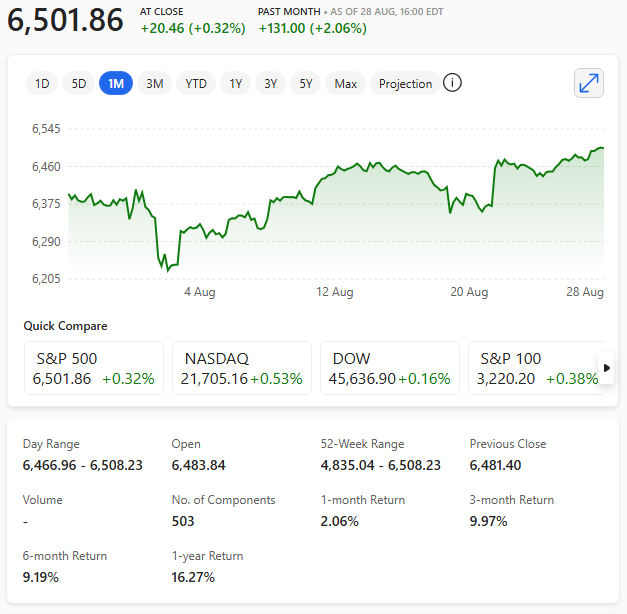
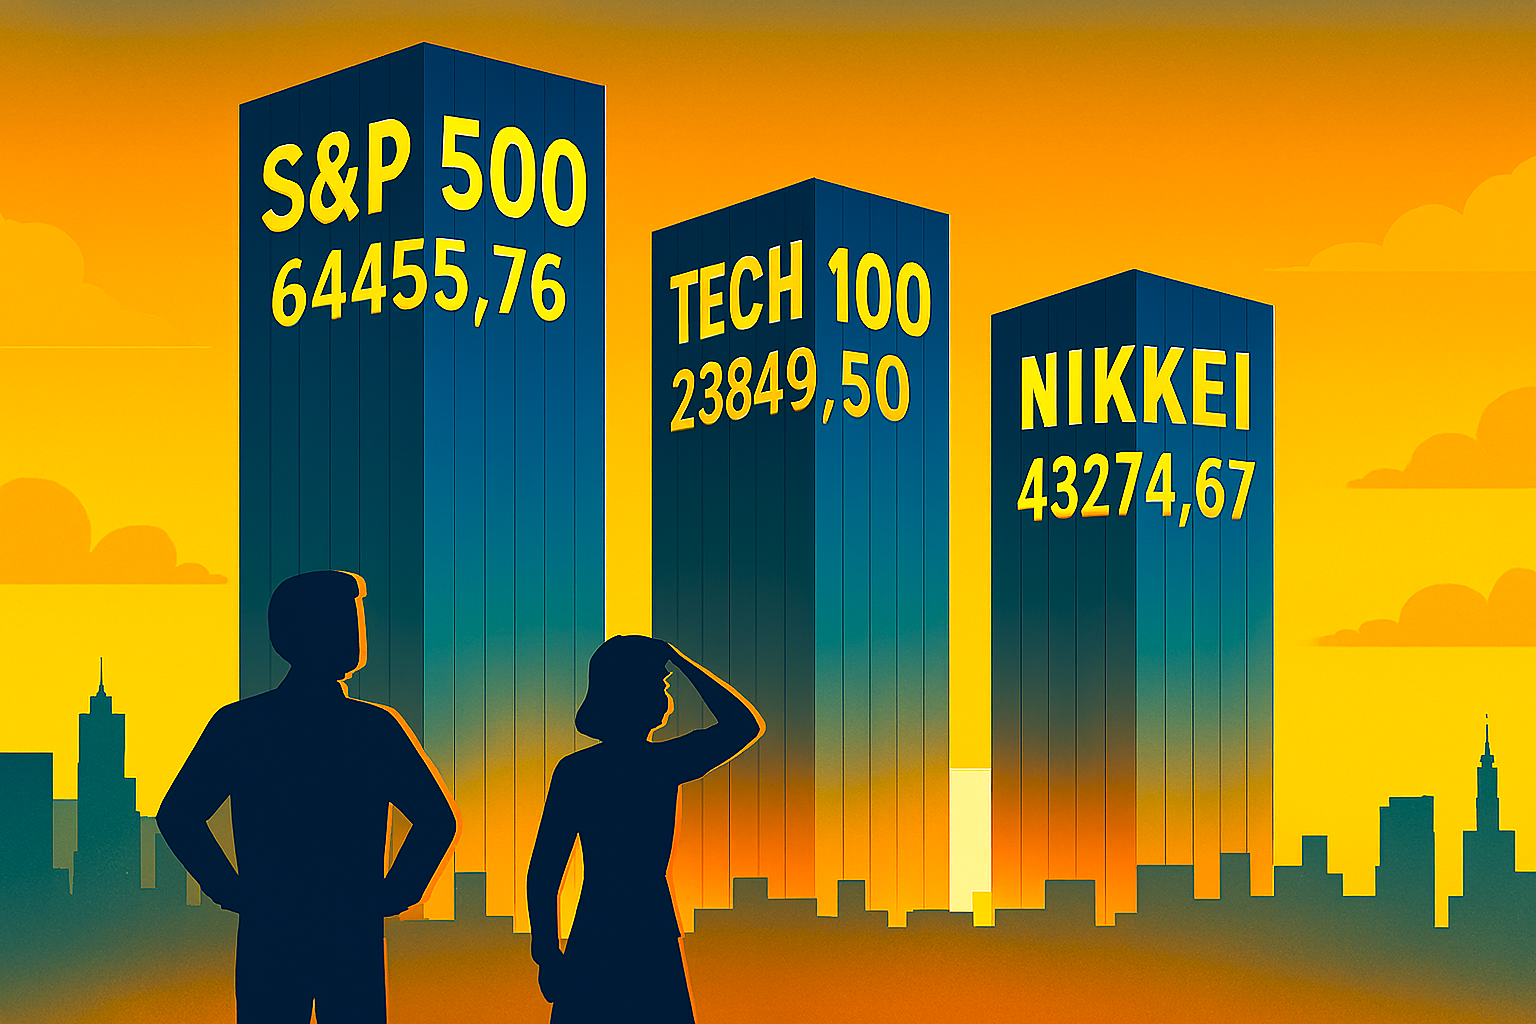
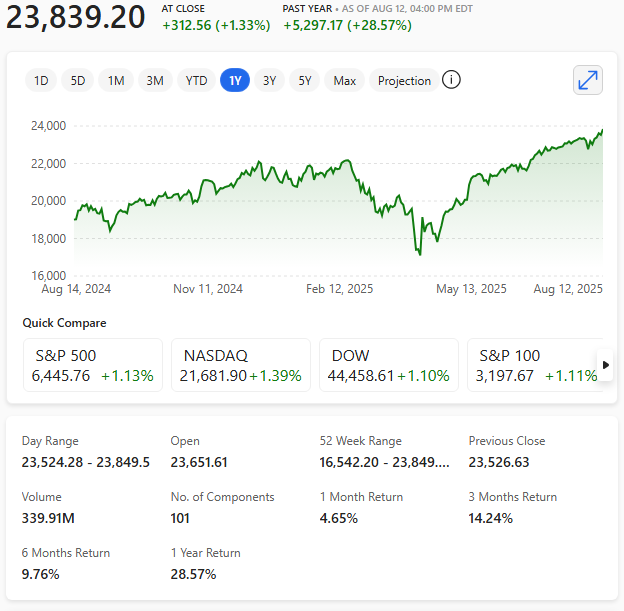
The S&P 500 ended up 2.03%, while the tech-heavy Nasdaq Composite added 2.74%.

The S&P 500 indexĀ was able to exit correction territory, ending at least 10% above its recent low set in the wake of President Donald Trump’s 2nd April 2025 ‘liberation day’ tariffs.

For the S&P 500 to maintain its rapid exit from correction territory – it now has to witness Trump’s tariff walk-back and the ‘cooling’ of a potential Fed fight.

Trump seems to be the first to have ‘blinked’ on his self-imposed tariffs suggesting the tariffs are too high and will not go any higher – thy are high enough!

China has reportedly said there are no ‘ongoing’ trade talks?

The Dow Jones Industrial Average lagged the other two indexes but still added 1.23% and retook the 40,000 for the first time since 15th April 2025.

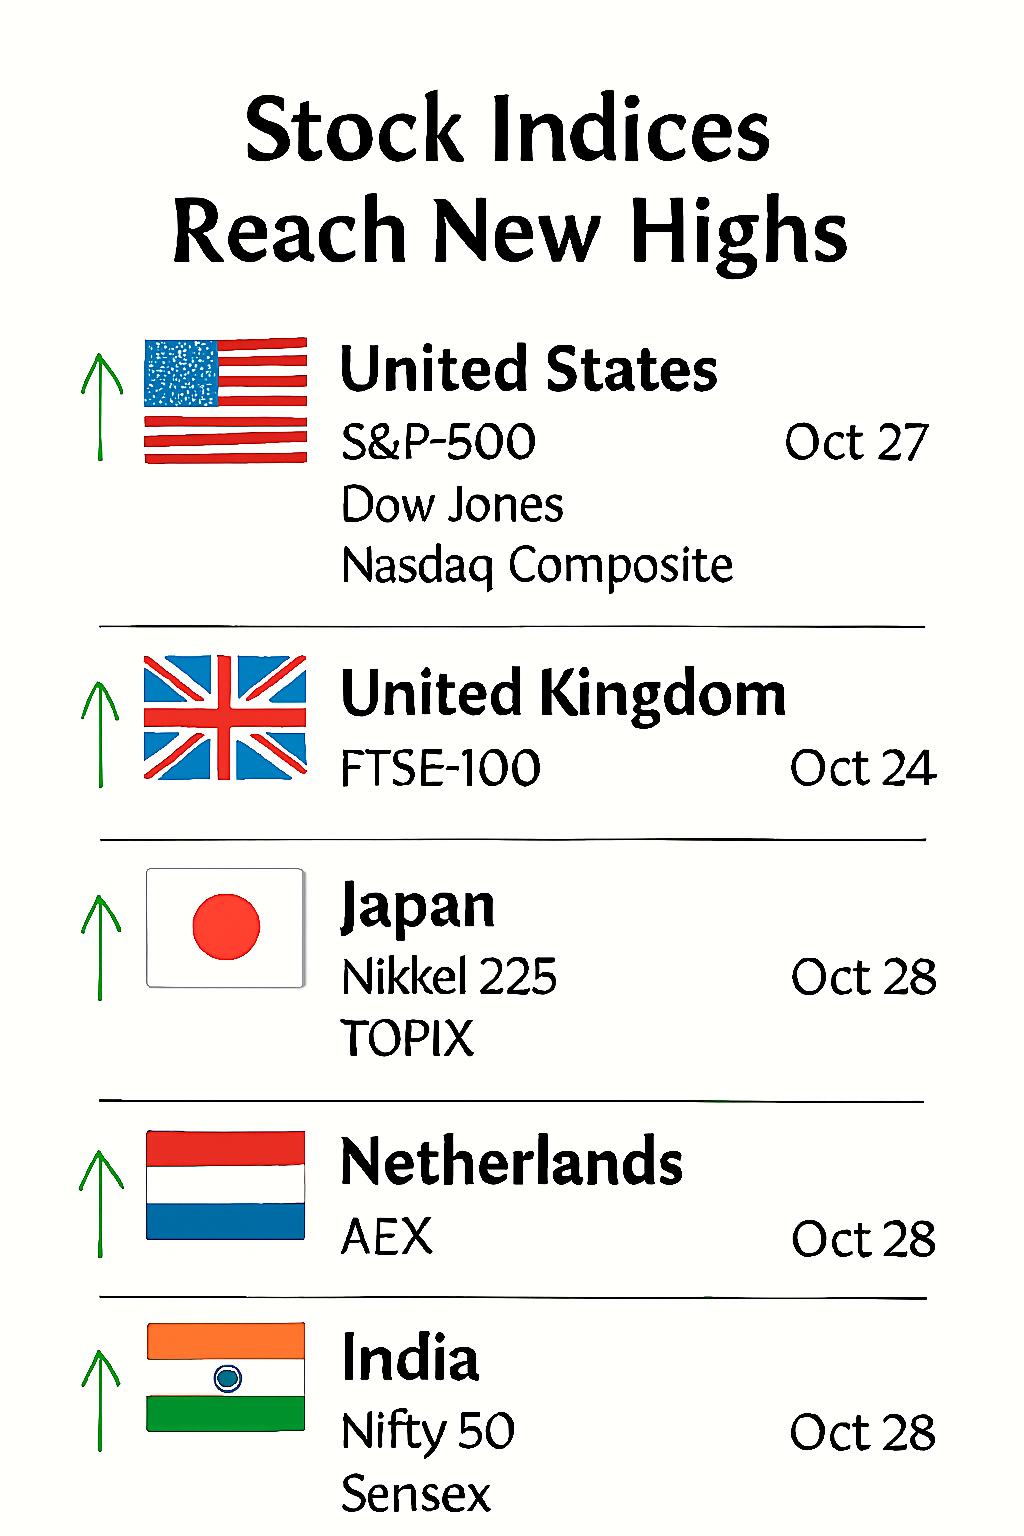
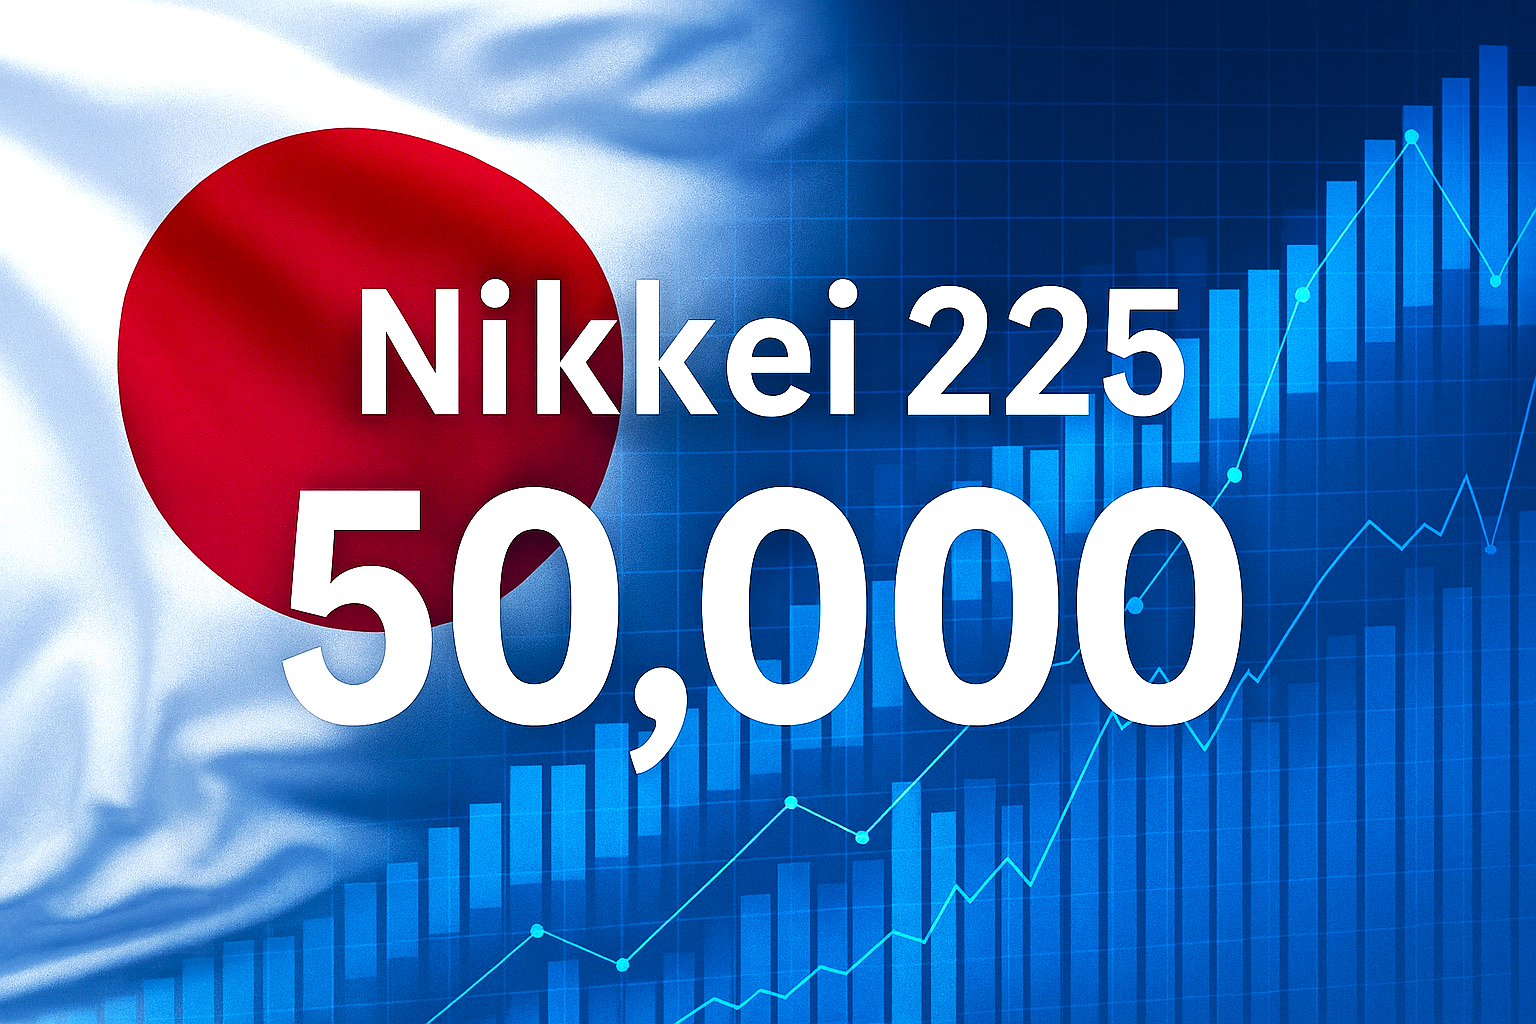
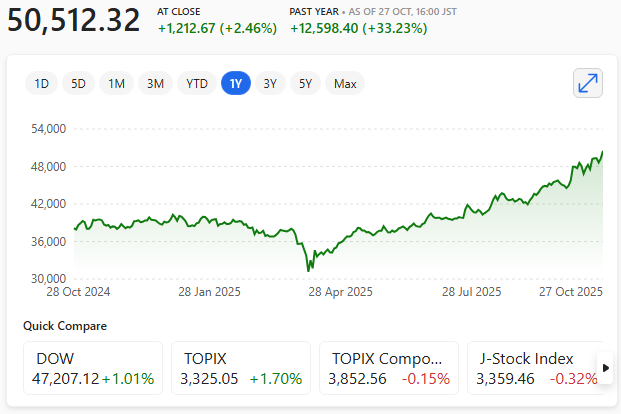
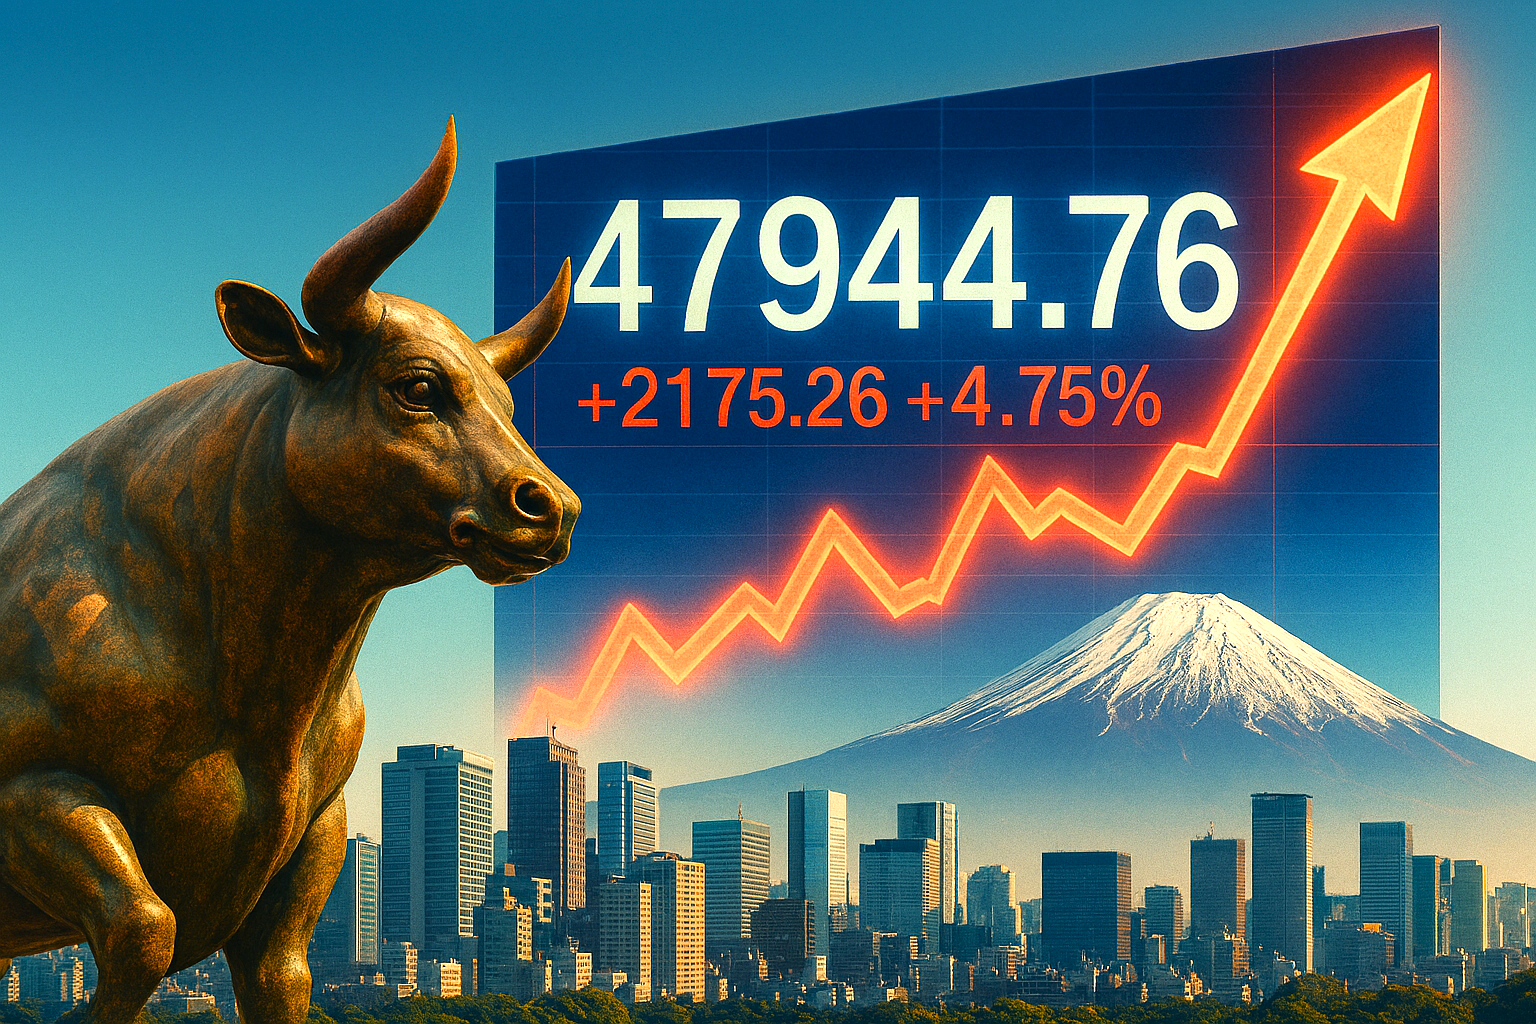
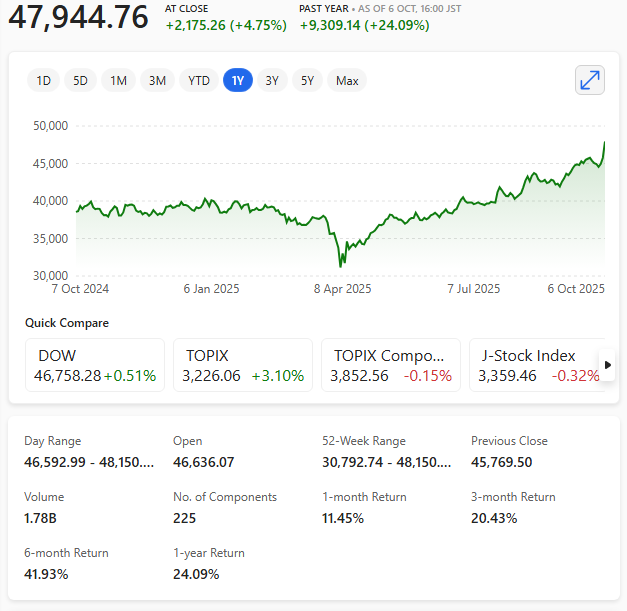
 Japan’s Nikkei 225 up almost 2% and leading gains.

Alphabet shares climb after better than expected results


Alphabet reported stronger-than-expected first-quarter growth on Thursday 24th April 2025.

Alphabet’s search and advertising units are still showing strong growth despite AI competition heating up, according to its first-quarter earnings report.

The company’s overall revenue grew 12% year-on-year, higher than the 10% Wall Street expected.

Shares rose more than 5% in after-hours trading. 

However, Alphabet reportedly indicated to expect ā€˜slight headwind’ to ads business this year.

Intel also posts results beat, but warns of tariff impact


Intel reported first-quarter results on 24th April 2025 that beat analysts’ estimates but also reportedly issued disappointing guidance. 

Second-quarter revenue will come in below estimates due to elevated uncertainty driven by the macro environment, the company warned.

Intel was reported saying that President Donald Trump’s tariffs and retaliation from other countries had increased the likelihood of a U.S. recession.

Big tech gains drive markets but the uncertainty surrounding Trump’s tariffs remain.

Tech driven sell-off gained at pace as Nasdaq dropped 3% and Dow Jones down 700 points

Tech in the red

The stock market experienced another sharp Trump tariff related downturn Wednesday 16th April 2025, driven by a tech-heavy sell-off continuing to rattle investors.

The Nasdaq Composite plunged by 3%, while the Dow Jones Industrial Average shed nearly 700 points, marking one of the most significant declines in recent months.

Concerns over tariffs and inflation were amplified by Federal Reserve Chair Jerome Powell’s remarks about the tariff uncertainty, which highlighted the challenging economic landscape.

Tech stocks bore the brunt of the sell-off, with semiconductor companies like Nvidia and AMD leading the decline. Nvidia’s announcement of a $5.5 billion quarterly charge related to export restrictions on its chips to China added to the sector’s woes.

The VanEck Semiconductor ETF dropped over 4%, reflecting broader uncertainty in the industry.

Powell’s comments on tariffs exacerbated market fears, as he warned of potential stagflation—a scenario where inflation rises while economic growth slows.

This sentiment was echoed across trading floors, with investors grappling with the implications of ongoing trade tensions and restrictive policies.

As the market inches closer to bear territory, the focus remains on navigating these turbulent times.

The sell-off underscores the fragility of investor confidence and the pivotal role of technology in shaping market dynamics

Russell 2000 goes into bear territory as Dow Jones – S&P 500 and Nasdaq hit correction!

Stocks fall

The Russell 2000, a key benchmark for small-cap U.S. stocks, has officially entered bear market territory.

This means the index has fallen more than 20% from its all-time high in late November 2024. The decline was accelerated by the recent rollout of President Donald Trump’s sweeping tariffs, which have raised concerns about rising costs, economic softening, and global supply chain disruptions3.

Small-cap stocks, which were initially seen as beneficiaries of Trump’s policies due to their domestic focus, are now facing significant challenges. Many of these companies are particularly vulnerable to input cost shocks and lack the financial flexibility of larger firms.

Analysts warn that the combination of higher costs and a slowing economy is squeezing profits, leaving small caps in a precarious position.

The Russell 2000’s downturn highlights the broader market volatility triggered by the tariff measures. While other major indices like the S&P 500 and Nasdaq are in correction territory, the Russell 2000 was the first to enter a bear market.

Russell 2000 index

Russell 2000 index

This development underscores the heightened risks for small-cap stocks in the current economic climate.

Despite the challenges, some strategists believe there could be opportunities for recovery, particularly if the Federal Reserve takes steps to cut interest rates.

However, Trump’s tariffs have introduced uncertainty into this policy, as inflation is likely to increase, casting doubt on the possibility of further interest rate cuts.

For now, the Russell 2000’s performance serves as a stark reminder of the delicate balance between protectionist policies and market stability.

The Russell 2000, a key benchmark for small-cap U.S. stocks, has officially entered bear market territory.

Dow Jones decline – the ripple effects of tariff policies

The Dow Jones Industrial Average has seen a sharp decline, falling from its all-time high of 45,073.63 points in December 2024 to its current level of 38,314.86 points—a drop of approximately 15%.

Dow Jones one-year chart

Dow Jones one-year chart

This downturn reflects a mix of economic challenges, including the impact of President Donald Trump’s tariff policies.

Trump’s sweeping tariffs, introduced as part of his ‘Liberation Day‘ initiative, aimed to bolster American manufacturing by imposing taxes on imported goods. While the policy sought to ‘level the playing field’, it triggered significant disruptions in global trade.

Retaliatory tariffs from key trading partners, including China and the European Union, compounded the issue, ultimately leading to higher costs for U.S. businesses and consumers.

The tariffs have also strained supply chains, particularly in industries reliant on international components. This has contributed to inflationary pressures, further dampening investor sentiment.

The tech sector, already grappling with regulatory scrutiny, has been hit hard, with companies facing increased production costs.

Nasdaq tech 100 one-year chart

Nasdaq tech 100 one-year chart

While some view the market’s decline as a natural correction, others warn of prolonged economic challenges, especially with the uncertainty surround Trump’s tariff agenda.

For investors, the key lies in navigating these turbulent times with caution and a focus on long-term fundamentals.

As the Dow adjusts to these pressures, its performance underscores the far-reaching consequences of trade policies on global markets.

S&P 500 one-year chart

S&P 500 one-year chart

Dow drops 2200 points Friday 4th April 2025 – S&P 500 loses 10% in 2 days as Trump’s tariff rout deepens – just two days after ‘Liberation Day!’

Stocks down

The stock market was smashed for a second day Friday 4th April 2025 after China retaliated withĀ new tariffsĀ on U.S. goods, sparking fears President Donald Trump has ignited a global trade war that will lead to a global recession.

Stock market damage

TheĀ Dow Jones Industrial AverageĀ dropped 2,231.07 points, or 5.5%, to 38,314.86 on Friday 4th April 2025, the biggest decline since June 2020 during the Covid-19 pandemic.

This follows a 1,679-point decline on Thursday 3rd April 2025 and marks the first time ever that it has shed more than 1,500 points on consecutive days.

TheĀ S&P 500Ā collapsed 5.97% to 5,074.08, the biggest decline since March 2020. The benchmark shed 4.84% on Thursday 3rd April 2025 and is now down more than 17% off its recent high.

TheĀ Nasdaq Composite, home to many well-known tech companies that sell to China and manufacture there as well, dropped 5.8%, to 15,587.79.

This follows a nearly 6% drop on Thursday 3rd April 2025 and takes the index down by 22% from its December 2024 record – pushing it into a bear market.

The selling was wide ranging with only 14 members of the S&P 500 higher on the day. Major market indexes closed at their lows of the session.

China’s commerce ministry said the countryĀ will imposeĀ a 34% levy on all U.S. products, disappointing investors who had hoped countries would negotiate with Trump before retaliating.

Technology stocks led the massive rout Friday

AppleĀ shares slumped 7%, bringing its loss for the week to 13%.

NvidiaĀ dropped 7% during the session.

TeslaĀ fell 10%.

All three companies have large exposure to China and are among the hardest hit from Beijing’s retaliatory tariffs.

The bull market is dead, and it was destroyed by self-inflicted wounds!

Dow closed 700 points lower Friday 28th March 2025 as inflation and tariff fears worsen

Dow down

Stocks sold off sharply on Friday 28th March 2025, pressured by growing uncertainty on U.S. trade policy as well as a grim outlook on inflation

The Dow Jones Industrial Average closed down 715 points at 41,583. The S&P 500 lost 1.97% to close 5,580 ending the week down for the fifth time in the last six weeks. The Nasdaq Composite plunged 2.7% to 17,322.

Shares of several technology giants also fell putting pressure on the broader market. Google-parent Alphabet lost 4.9%, while Meta and Amazon each shed 4.3%.

This week, the S&P 500 lost 1.53%, while the 30-stock Dow shed 0.96%. The Nasdaq declined by 2.59%. With this latest losing week, Nasdaq is now on pace for a more than 8% monthly decline, which would be its worst monthly performance since December 2022.

Dow Jones one-day chart (28th March 2025)

Dow Jones one-day chart (28th March 2025)

Stocks took a leg lower on Friday after the University of Michigan’s final read on consumer sentiment for March 2025 reflected the highest long-term inflation expectation since 1993.

Friday’s core personal consumption expenditures price index also came in hotter-than-expected, rising 2.8% in February and reflecting a 0.4% increase for the month, stoking concerns about persistent inflation.

Economists had reportedly been looking for respective numbers of 2.7% and 0.3%. Consumer spending accelerated 0.4% for the month, below the 0.5% forecast, according to fresh data from the Bureau of Economic Analysis.

The market is getting squeezed by both sides. There is uncertainty about reciprocal tariffs hitting the major exporting sectors like tech alongside concerns about a weakening consumer facing higher prices

Trump’s tariffs push will hit the U.S. harder than Europe in the short term, it has been reported.

Japan’s Nikkei enters correction as Trump’s tariff assault drives sell-off in Asia markets

S&P 500 slides into correction territory

S&P 500 enters correction

The S&P 500 has officially entered correction territory, marking a significant shift in market sentiment

The index, widely regarded as a benchmark for the health of large U.S. companies, has fallen over 10% from its February 2025 peak.

This downturn follows a series of escalating trade tensions, with President Donald Trump announcing a 200% tariff on European alcoholic products in response to the European Union’s levies on American whiskey.

The correction reflects growing investor concerns over the potential economic fallout of these trade disputes. The Nasdaq Composite, another major index, had already entered correction territory earlier, signaling broader market unease. The Dow Jones Industrial Average also experienced a decline, marking its fourth consecutive day of losses.

Economists warn that the ongoing trade war could exacerbate fears of a recession, as businesses face rising costs and uncertainty. The Federal Reserve’s recent inflation reports suggest price growth remains elevated, adding to the challenges.

While corrections are not uncommon, they often serve as a wake-up call for investors. Historically, only a fraction of corrections evolve into bear markets, but the current environment of trade tensions and inflationary pressures has heightened concerns.

As markets navigate these turbulent waters, all eyes remain on policymakers and their next moves to stabilise the economy.

U.S. markets tumble as Trump and his administration dismiss stock slump and economic concern

U.S. stocks fall

The Elon Musk-led Department of Government Efficiency claims to be streamlining the federal government’s spending

But it has so far sown confusion, with the Trump administration attempting to rehire employees it had previously fired.

DOGE presents a distorted reflection of the current state of the U.S. economy. U.S. President Trump has implemented a series of policies to try to stimulate effect, frequently modifying them mid-course, resulting in collateral damage within the country’s own borders.

U.S. markets have been on a downward trend and were significantly impacted on. Tesla shares have lost some 50% since Trump’s election. Consumers are also boycotting Tesla vehicles.

Tariffs, according to Trump, are meant to protect U.S. businesses and punish trade partners. But so far, it seems that the world’s biggest economy is the one suffering.

Dismal day in the markets

U.S. stocks experienced a rout Monday 10th March 2025Ā as fears of a recession gripped investors. TheĀ S&P 500Ā dropped 2.7%, theĀ Dow Jones Industrial AverageĀ lost 2.08% and theĀ Nasdaq CompositeĀ sank 4% in its worst session since September 2022.

The White House downplayed the market slump, saying it’sĀ not as ‘meaningful’ as business activity (what does that mean exactly)?Ā 

Asia markets also retreated Tuesday 11th March 2025. Japan’sĀ Nikkei 225Ā fell around 1% amid a weaker-than-expected showing for itsĀ fourth-quarter gross domestic product (GDP).

S&P 500 hits new record high

S&P 500 record

The S&P 500 closed at a record high Tuesday 18th February 2025 after investors shook off headwinds on the global trade and inflation

The S&P 500 index gained 0.24% to close at a record of 6129 on 18th February 2025. TheĀ Nasdaq CompositeĀ closed up at 20041 while theĀ Dow Jones Industrial AverageĀ added finished the day at 44556.

S&P 500 hits new record high to close at 6129 as of 18th February 2025

The energy sector was the top performer in the S&P 500, increasing by 1.9%. Halliburton and Valero Energy spearheaded the gains. Technology stocks also gained.

The general consensus is that the market is still trying to break out of the consolidation it’s been in since early December. This week we see retail earnings, but news on Trumps tariffs could continue to be a wild card for the markets.

Wall Street is coming off a winning week. The Dow Jones gained around 0.6% last week, while the S&P 500 advanced 1.5%. The Nasdaq rose 2.6%.

Much of last week’s gains occurred later in the week after President Donald Trump’s proposal for reciprocal tariffs on countries that impose levies on U.S. goods reassured investors who were concerned that the tariffs would be more severe.

Dow down again – falling for 10th consecutive day

Dow down

The Dow Industrial Average dropped 1,123 points to 42,326.87, marking its 10th consecutive day of decline and the longest since 1974.

The Dow is lining up for potentially its worst weekly performance since March 2023.

The S&P 500 fell 2.95% to 5,872.16, while the Nasdaq Composite decreased 3.56% 19,392.69 as losses in the tech-heavy index accelerated at the end of the session.

Both the 30-stock Dow and the S&P 500 recorded their largest one-day loss since August 2024.

The Dow and most other indices reacted badly to the Feds interest prediction for 2025 – suggesting ‘maybe’ only two more rates cuts to come.

Dow Jones one-day chart 18th December 2024 (after FOMC interest rate announcement)

Dow Jones one-day chart 18th December 2024 (after FOMC interest rate announcement)

Dow down in the doldrums after nine day losing streak

Dow Jones

On Tuesday 17th December 2024, the Dow Jones Industrial Average lost 0.61%, completing a nine-day losing streak.

The Dow Jones Industrial Average has recently experienced its longest losing streak since the 1970’s – 1978 to be precise.

The index has suffered nine consecutive days of declines. This downward trend began on 4th December, when the index closed above 45,000 for the first time, only to drop over 1,500 points since then.

However, it’s not a major fall for the 30-stock index, despite the concerning numbers – it has been a slow burn and not a ‘massive’ correction. It represents a little under around a 3.5% pullback.

Several factors contribute to this decline. Investors are bracing for the Federal Reserve’s final interest rate decision of the year, expectations of a 0.25% cut. However, stronger-than-expected retail sales in November have introduced uncertainty about the Fed’s future monetary policy. Additionally, concerns about the potential impacts of-E Donald Trump’s tariff plans have added to volatility.

Despite the Dow’s losses, the broader S&P 500 and Nasdaq Composite indices have demonstrated resilience, with the latter even achieving record highs. This divergence underscores the mixed sentiment among investors, with some rotating out of high-growth stocks like Nvidia and into other tech sectors.

Market analysts suggest that the Dow’s ‘adjustment’ may be a healthy pause, offering an opportunity for stocks to consolidate before potentially resuming their upward trajectory. Investors ought to remain vigilant, closely monitoring market trends and individual stock performance to navigate this dynamic environment effectively

The heaviest drag on the Dow is UnitedHealth, which has contributed to more than half of the index’s decline over this period.

Some of this money has likely rotated to crypto with Bitcoin notably blasting through the $100,000 mark to touch $107,000 in recent trading.

Nvidia in correction territory amid Nasdaq highs

AI microchip

Nvidia recently entered correction territory, with its stock falling over 10% from its peak. This decline comes after a robust rally fueled by investor excitement around AI technology.

Despite Nvidia’s slip, the Nasdaq Composite continues to soar to new highs, driven by strong performances from other tech giants like Apple, Microsoft, and Alphabet.

The market’s mixed signals reflect a broader trend of sector rotation. Investors are taking profits from Nvidia after its impressive gains and reallocating their capital to other promising tech stocks. This strategy allows investors to lock in profits while still capitalising on the overall bullish sentiment in the tech sector.

The Nasdaq’s resilience, despite Nvidia’s downturn, highlights the strength and diversity of the technology sector. While Nvidia’s correction is a reminder of the volatility inherent in high-growth stocks, the broader market remains optimistic about the future of technology and innovation.

Market analysts suggest that Nvidia’s correction may be a healthy pause, providing an opportunity for the stock to consolidate before potentially resuming its upward trajectory. As the tech landscape continues to evolve, both Nvidia and its peers remain at the forefront of driving the next wave of digital transformation.

Investors should stay vigilant, monitoring both market trends and individual stock performance to navigate this dynamic environment effectively.

Nvidia is still holding its $3.2 trillion market cap valuation reached this year.

Nvidia one month chart as of 16th December 2024

Nvidia one month chart as of 16th December 2024

U.S. stocks have a November to remember as Dow touches 45,000

High Dow

On Friday 29th November 2024, the Dow Jones reached a new record high, closing at 44,910 points after breaching 45,000 temporarily

This formed part of a wider market surge that led the S&P 500 and Nasdaq Composite to also hit record peaks. It concluded a remarkable month for the stock market, marked by the Dow achieving its most substantial monthly gain of the year, all thanks to Trump winning the U.S. election.

In November, the S&P 500 experienced a 5.73% rise, and the Dow Jones Industrial Average recorded a notable 7.54% increase, both marking their most robust monthly performances for the year. Concurrently, the Nasdaq Composite enjoyed a 6.21% surge, its largest monthly gain since May.

Recently, a host of factors have pumped up investors’ sentiment for stocks. 

The presidential election concluded with Donald Trump decisively securing the presidency. This eliminated any uncertainty, which is often disliked by investors. Additionally, Trump’s support for the stock market, tax cuts, cryptocurrency, and deregulation is well-received by investors.

The U.S. economy expanded at an annualised rate of 2.8% in the third quarter. Although the gross domestic product is projected to grow by 1.31% in the fourth quarter, this still signifies an expansion, countering concerns of a potential recession hitting the U.S. economy.

Even a slowing growth rate can have its advantages. It provides the U.S. Federal Reserve with greater motivation to implement a second rate cut this year at its December 2024 meeting, potentially boosting economic activity.

Moreover, the seasonal strength of stocks in November 2024 has infused investors with a sense of optimism.

Entering December 2024, it’s challenging to disregard the current bull market, given the favourable conditions.

U.S. stocks are experiencing a robust year-end rally, partly due to short sellers being compelled to purchase stocks to close their positions as the year concludes.

This surge of buying could propel the S&P 500 to reach 6,300, suggesting a 5% increase for December 2024 and a 32.1% rise throughout 2024, surpassing the 24.2% gain seen in 2023.

Additionally, there’s the significant boost in cryptocurrency values, often referred to as the ‘Trump pump,’ – and this too is currently underway.

Dow Jones one-day chart as of 29th November 2024

Dow Jones one-day chart as of 29th November 2024

S&P 500 and Nasdaq close at new records again as Fed cuts rates

U.S> stocks up

More new records set in extended U.S. post-election rally

The S&P 500 and Nasdaq climbed on Thursday 7th November 2024, extending the rally following the victory of President-elect Donald Trump, while traders considered the implications of the Federal Reserve’s recent rate reduction.

The S&P 500 rose to close at an all-time high of 5,973.10, while the Nasdaq Composite increased by to end at 19,269.46, marking its first finish above 19,000.

The Dow Jones Industrial Average remained virtually unchanged, dipping slightly by less than one point to 43,729.34. During the trading session, all three indices reached new intraday highs.

Following President Trump’s electoral victory, the stock market experienced a significant rally on Wednesday 6th November 2024, with the Dow soaring by 1,500 points. The S&P 500 surged recording its best post-election day performance ever.

Post-election, the bond market has seen considerable fluctuations, with Treasury yields declining on Thursday after a sharp increase the previous day.