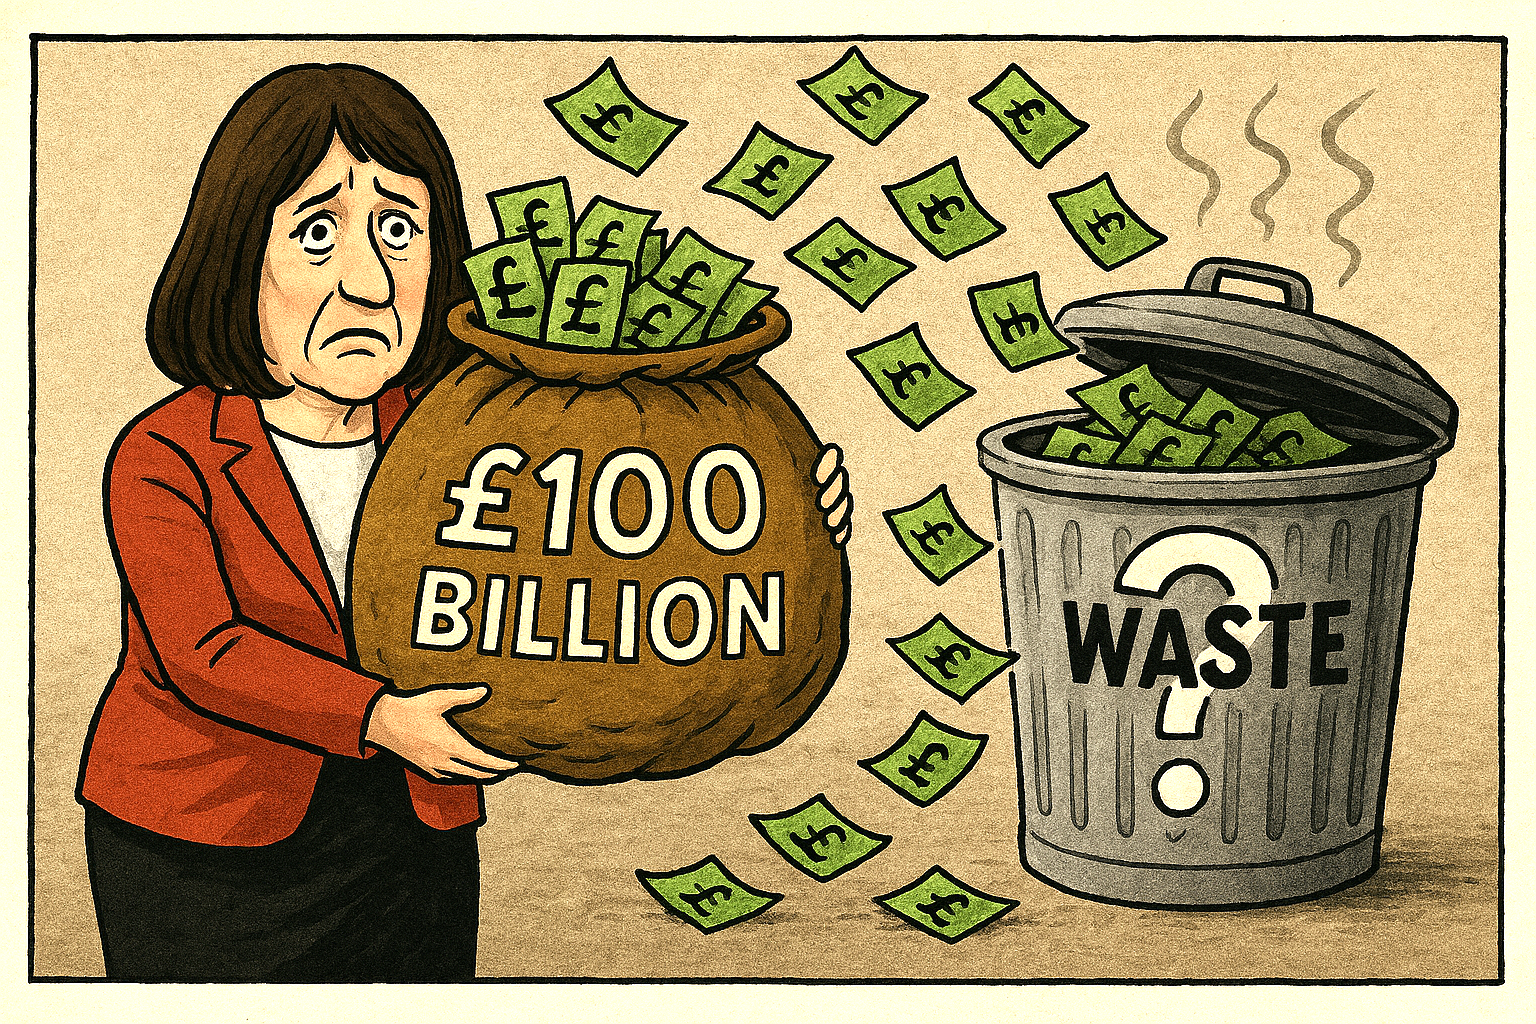
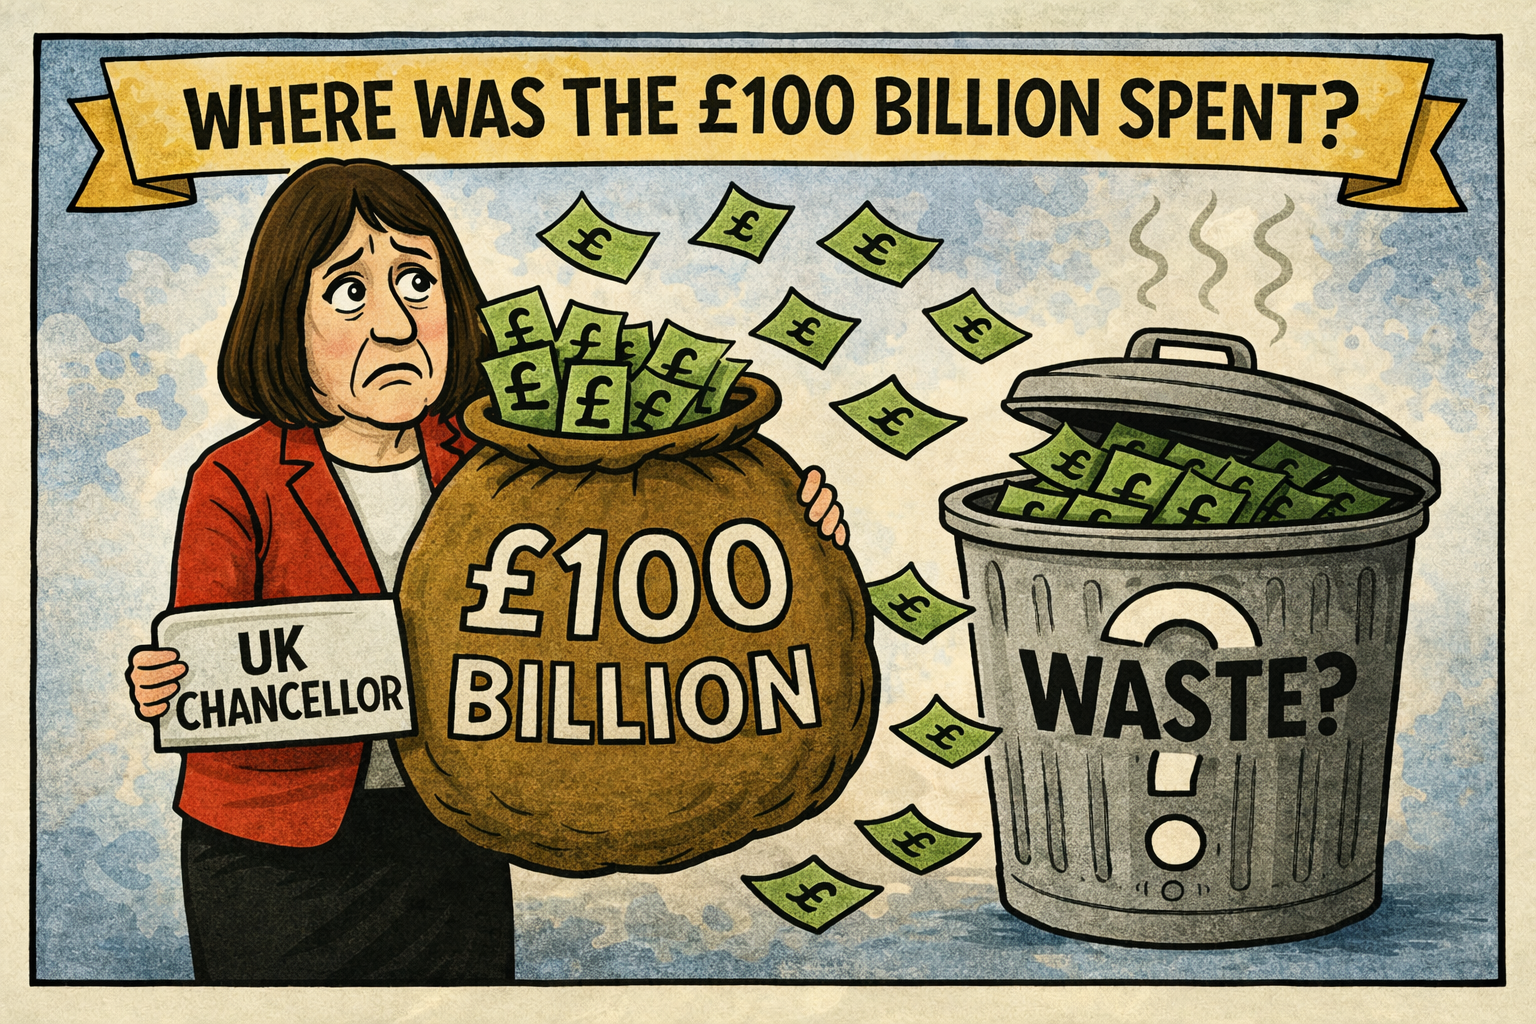
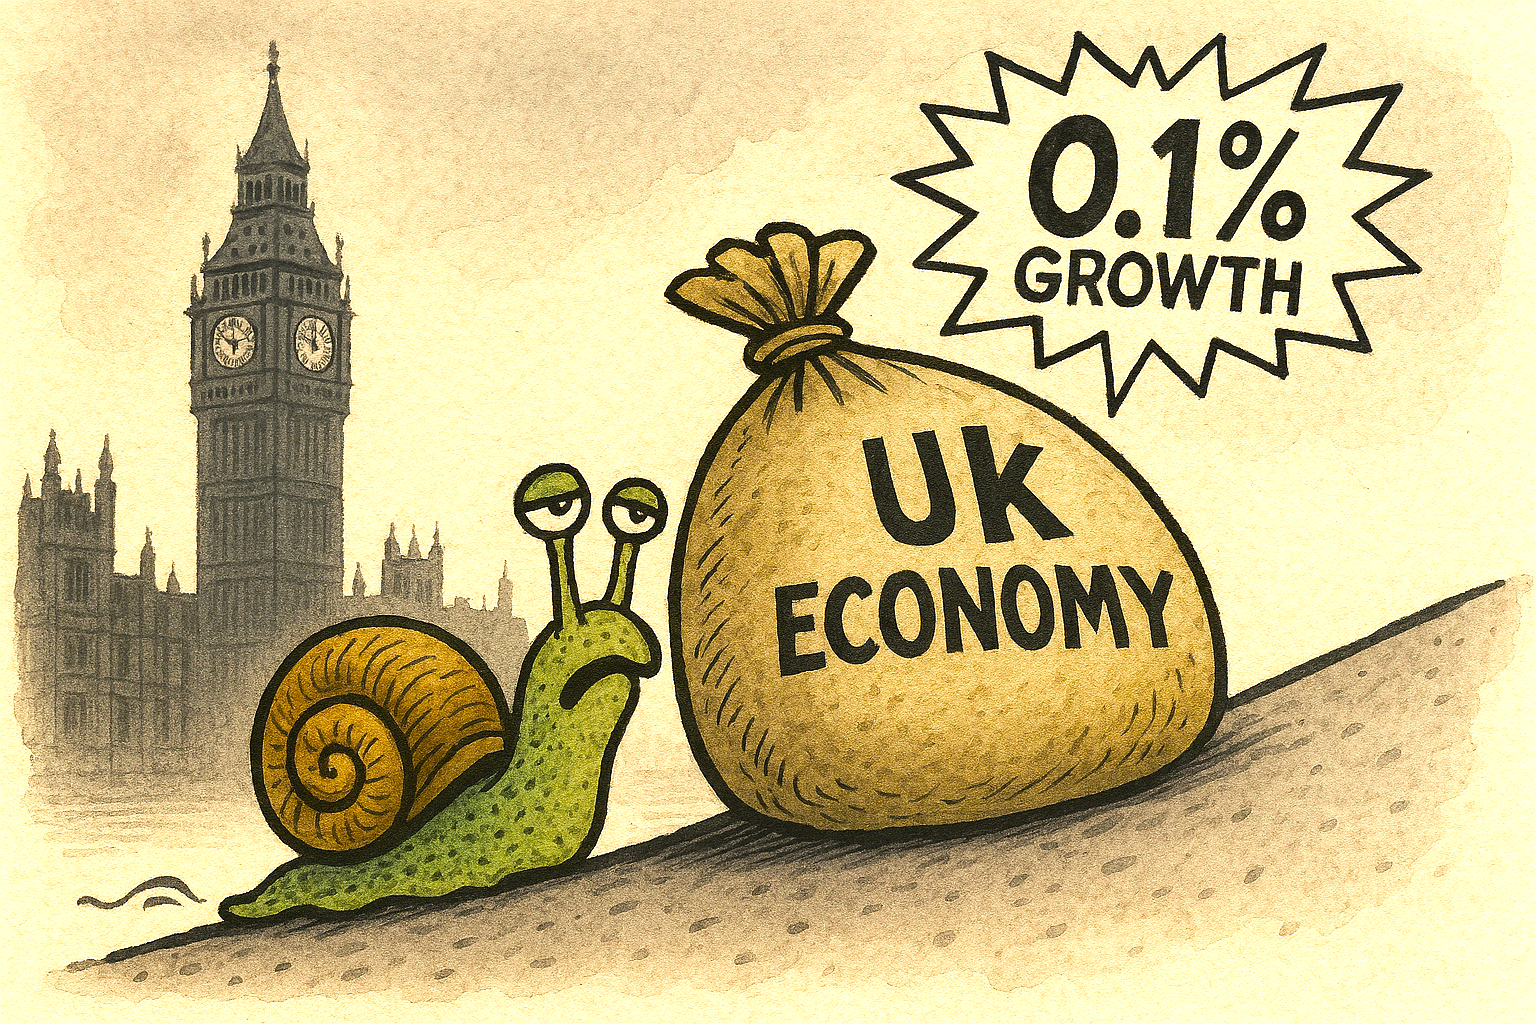
The Treasury’s latest figures reveal that the UK government collected more than £100 billion in taxes in a single month — a staggering sum that ought to signal a nation investing confidently in its future.
Yet the public mood tells a different story. For many households and businesses, the question is simple: if the money is flowing in at record levels, why does so little feel improved?
High Tax = Stable Economy?
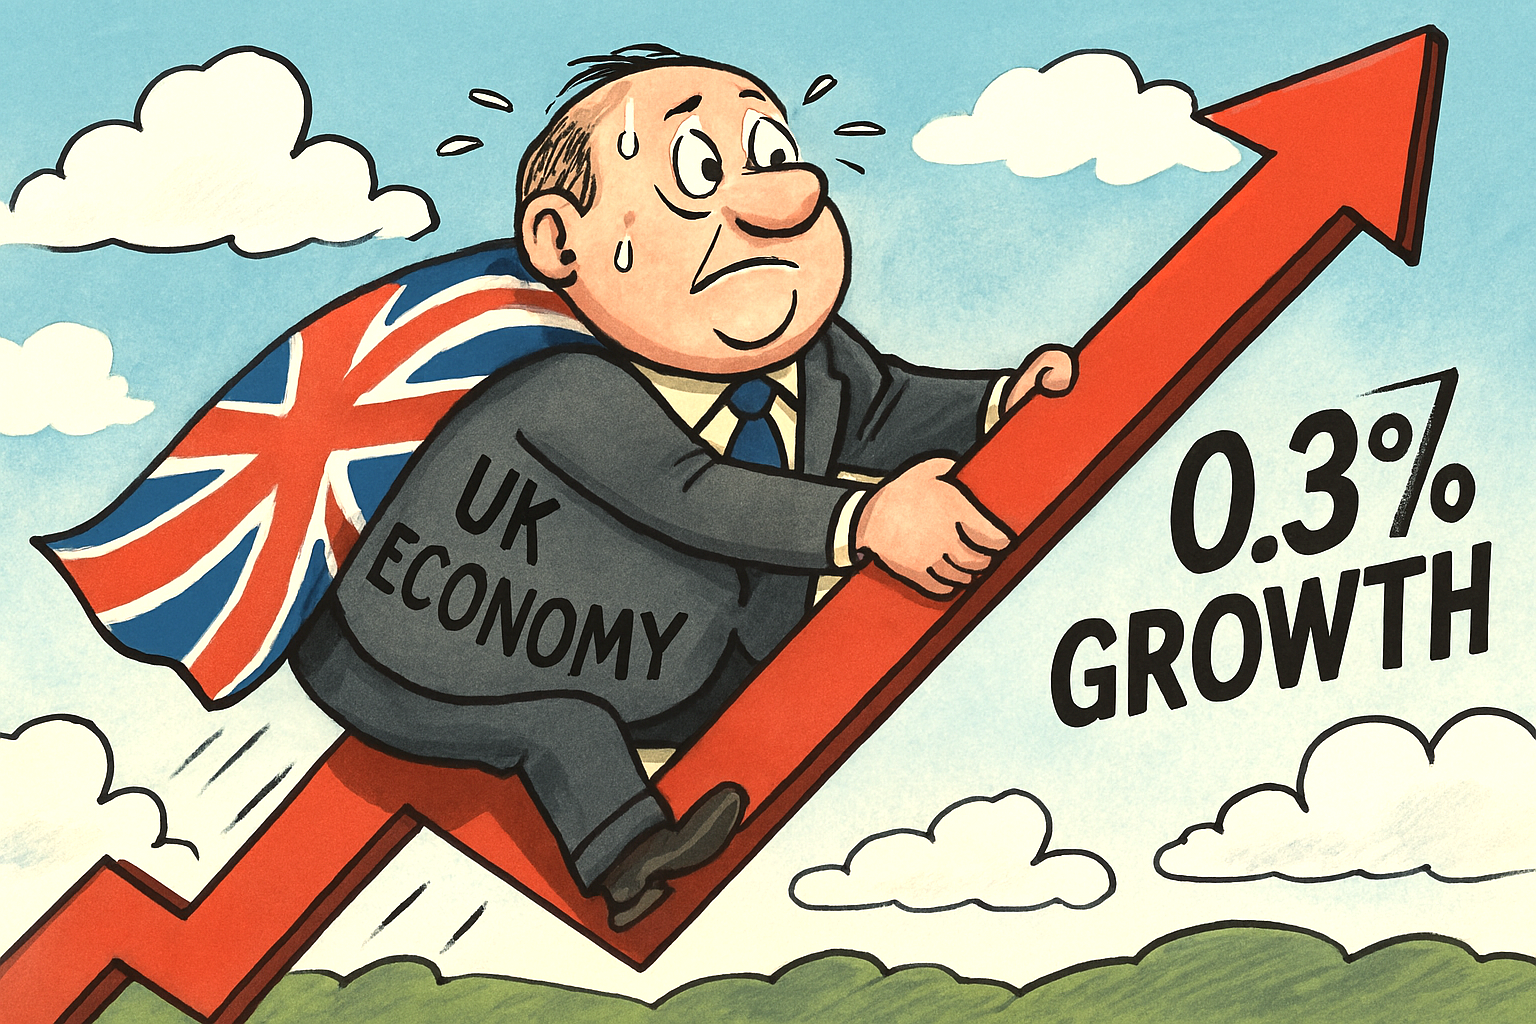
Chancellor Rachel Reeves has repeatedly argued that high tax receipts reflect a stabilising economy and the early impact of Labour’s ‘growth-first’ strategy.
(It could be argued that her first budget didn’t exactly help growth – remember higher employer N.I. changes)?
Income tax, corporation tax and VAT all contributed to the surge, boosted by wage inflation, fiscal drag, and stronger-than-expected corporate profits.
On paper, the numbers look impressive. In practice, the lived experience across the country is far less reassuring.
Public Services Stretched
Public services remain stretched to breaking point. NHS waiting lists have barely shifted, local councils warn of insolvency, and the school estate continues to creak under decades of underinvestment.
Commuters still face unreliable rail services, potholes remain a national embarrassment, and the promised acceleration of green infrastructure has yet to materialise in any visible way. For a government that insists it is rebuilding Britain, the early evidence is thin.
Reeves’ defenders argue that structural repair takes time. After years of fiscal instability, they say, the priority is stabilisation: paying down expensive debt, restoring credibility with markets, and creating the conditions for long-term investment.
More to Come
The UK Chancellor has also signalled that major spending commitments — particularly on housing, energy and industrial strategy — will ramp up later in the Parliament.
But this patience is wearing thin. Voters were promised renewal, not a holding pattern. When tax levels are at a post-war high, the public expects tangible returns: shorter hospital queues, safer streets, better transport, and a sense that the country is moving forward rather than treading water. Instead, many feel they are paying more for the same — or, in some cases, less.
The political risk for Reeves is clear. A £100 billion monthly tax take is a powerful headline, but it becomes a liability if people cannot see where the money is going.
Frustration?
Unless the government can convert revenue into visible progress — quickly and convincingly — the Chancellor may find that record receipts only fuel record frustration.
It’s a striking contradiction: a nation pulling in more than £100 billion in tax in a single month yet seeing almost none of the visible improvements such a windfall ought to deliver.
The reality is that much of this revenue is immediately swallowed by structural pressures — servicing an enormous debt pile, propping up struggling local authorities, covering inflation‑driven public‑sector pay settlements, and patching holes left by years of underinvestment.
What remains is too thinly spread to transform services that are already operating in crisis mode.
Slow Pace
High receipts don’t automatically translate into better outcomes when the state is effectively running just to stand still, and until the government can shift from firefighting to genuine renewal, even record‑breaking tax months will feel like money disappearing into a system that can no longer convert revenue into results.
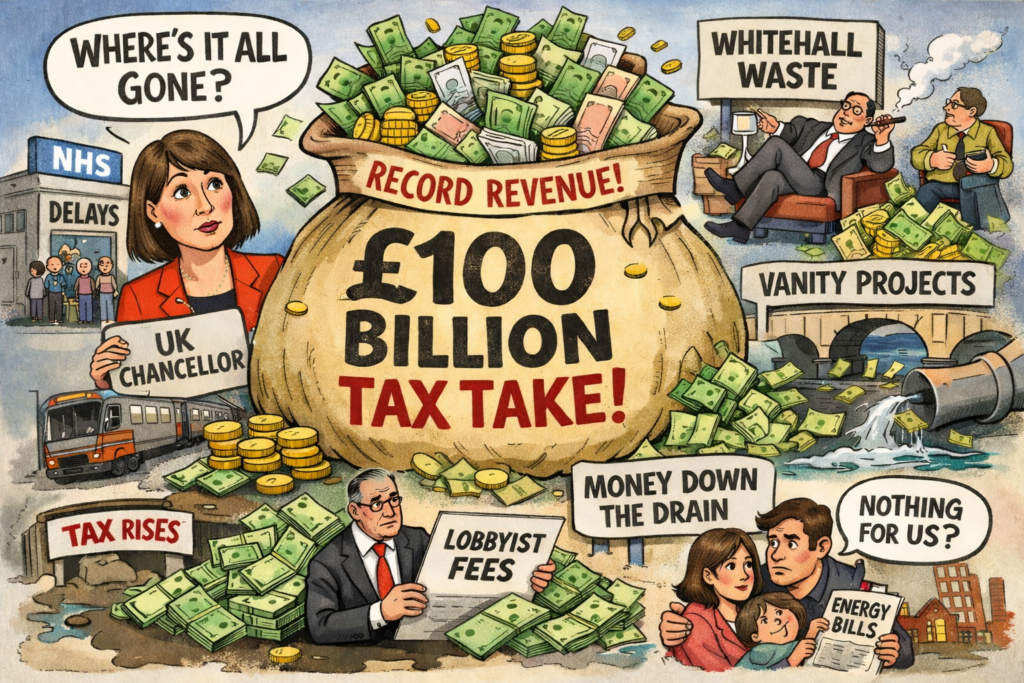
First, it’s important to understand that a £100+ billion month (largely January, when self-assessment and corporation tax payments fall due) does not mean the government suddenly has £100 billion spare to spend. Most of it is absorbed by existing commitments.
Here’s broadly where UK tax revenue goes:
So, just how has the £100 billion tax haul likely been apportioned?
1. Health – The NHS
The National Health Service is the single largest area of public spending.
Funding covers:
- Hospitals and GP services
- Staff wages (doctors, nurses, support staff)
- Medicines and equipment
- Reducing waiting lists
Health alone consumes well over £180 billion annually.
2. Welfare & Pensions
The biggest slice of all is often social protection:
- State pensions
- Universal Credit
- Disability benefits
- Housing support
An ageing population means pension spending continues to rise.
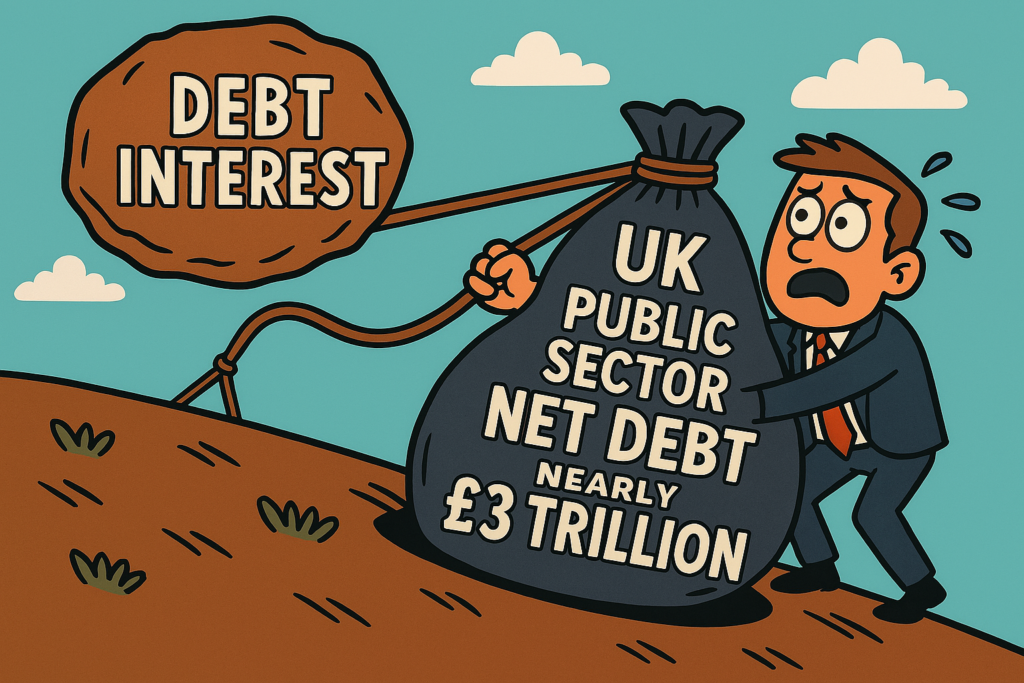
3. Debt Interest
Servicing national debt is expensive.
With higher interest rates over the past two years, billions go purely on interest payments, not new services.
4. Education
Funding for:
- Schools
- Colleges
- Universities
- Early years provision
Teacher pay settlements and school building repairs are major costs.
5. Defence & Security
Including:
- Armed forces
- Intelligence services
- Support for Ukraine
- Nuclear deterrent maintenance
6. Transport & Infrastructure
Rail subsidies, road maintenance, major capital projects, and support during strikes or restructuring.
7. Local Government
Councils rely heavily on central funding for:
- Social care
- Waste collection
- Housing services
So Why Doesn’t It Feel Like £100 Billion?
Because….
- January is a seasonal spike, not a monthly average.
- The UK still runs a large annual deficit.
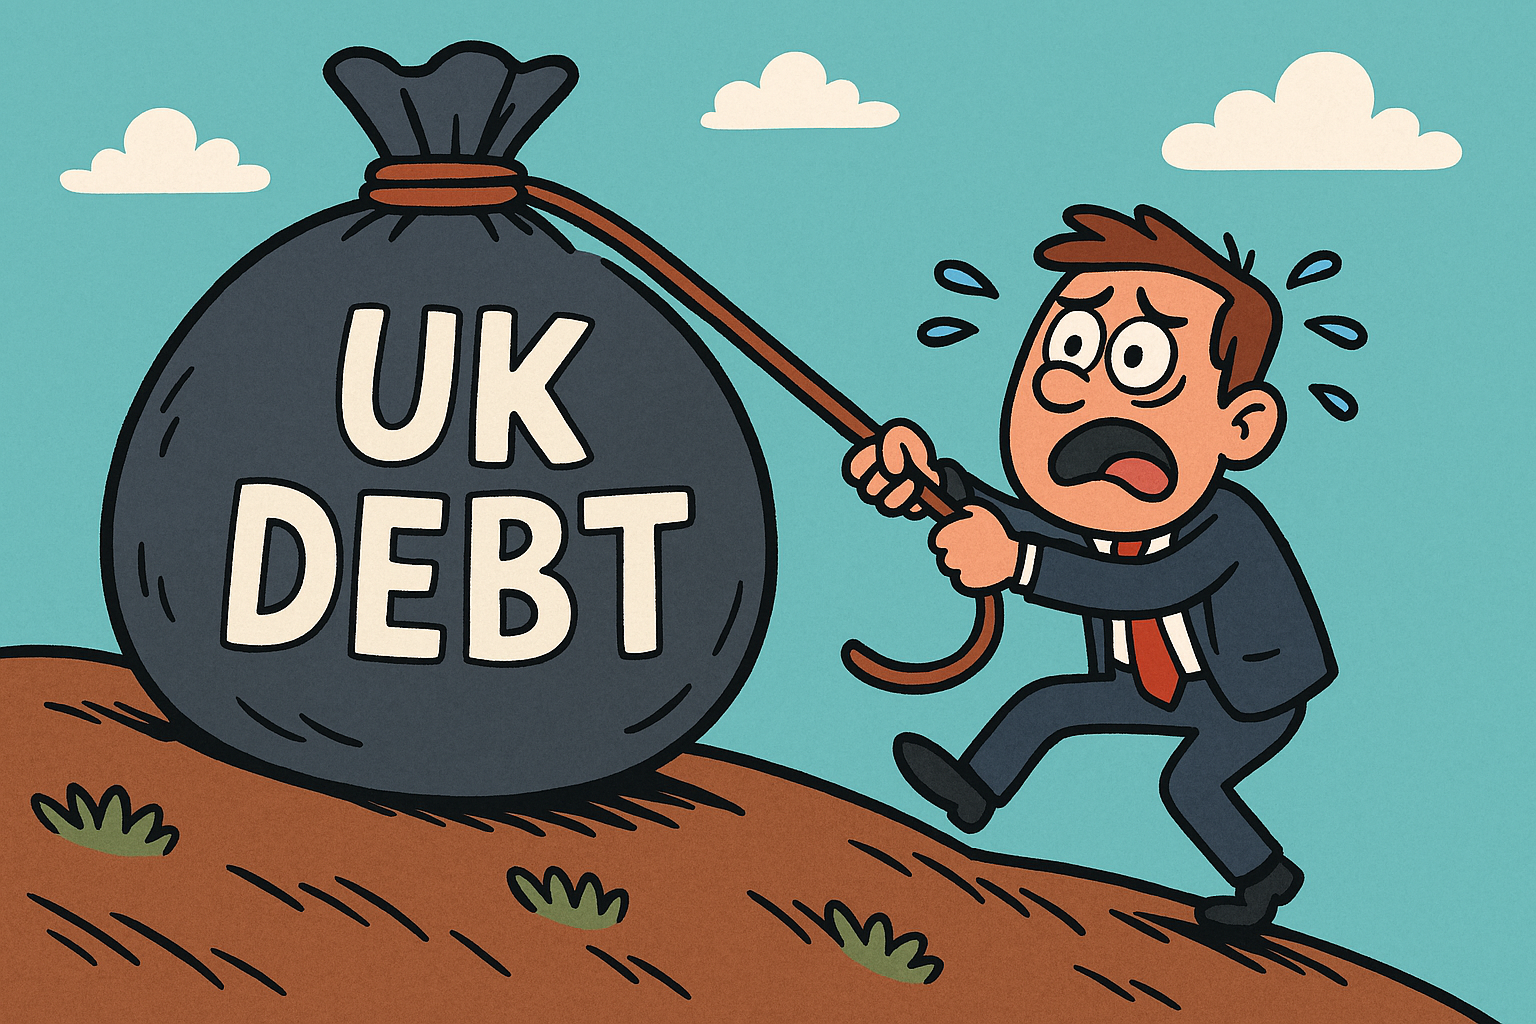
- Public debt is above £2.6 trillion.
- Much of the revenue replaces borrowing rather than funds new projects.
In short, the money hasn’t vanished — it is largely sustaining an already over stretched ‘FAT’ state, servicing debt, and maintaining core services rather than delivering visible ‘new’ benefits.
As of January 2026, the Office for National Statistics (ONS) reported that public sector net debt excluding public sector banks stood at £2.65 trillion, which is approximately 96.5% of GDP.
While January 2026 saw a record monthly surplus of £30.4 billion — driven by strong self-assessed tax receipts — the overall debt burden remains historically high.
This level of debt reflects years of accumulated borrowing, pandemic-era spending, inflation-linked interest payments, and structural deficits.
Even with strong tax intake, the scale of the debt means that progress on reducing it is slow and incremental.