Japan’s Nikkei 225 index has surged to an unprecedented milestone, closing at 54341 on 14th January 2026.
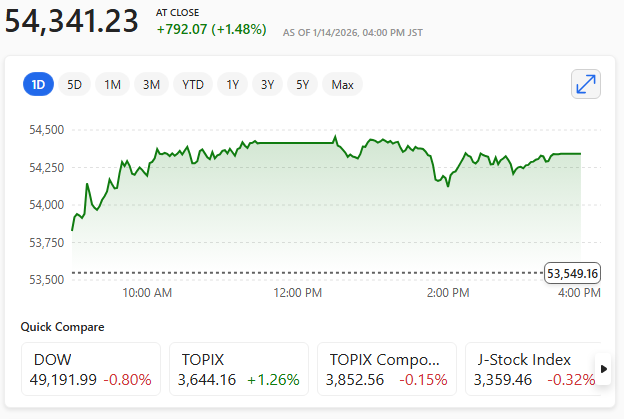
This new record marks a defining moment for the world’s third‑largest economy. It signals a profound shift in how global investors view Japan’s prospects after decades of stagnation.
The latest rally has been fuelled by a combination of political momentum and renewed enthusiasm for Japan’s technology and industrial sectors.
Takaichi trade surge
Much of the current surge has been attributed to the so‑called Takaichi trade. Aawave of investor confidence linked to Prime Minister Sanae Takaichi’s popularity and the growing expectation of a snap election.
Markets often respond favourably to political clarity, and the possibility of a strengthened mandate for pro‑growth policies has added fresh energy to Japanese equities.
A weakening yen has also played a central role. With the currency recently touching its softest levels against the U.S. dollar since mid‑2024, exporters have enjoyed a competitive boost.
This currency tailwind, combined with robust global demand for semiconductors and advanced manufacturing, has helped propel the Nikkei beyond levels once considered unreachable.
50,000
The psychological significance of crossing the 50,000 mark only months ago has not been lost on analysts.
Many now argue that Japan is no longer merely a ‘value play’ but a genuine engine of global growth, supported by structural reforms, corporate governance improvements, and a renewed appetite for innovation.
While risks remain — from geopolitical tensions to the possibility of market overextension — the latest record suggests a market rediscovering its confidence.
Timeline Breakdown
It’s taken 36 years to get here
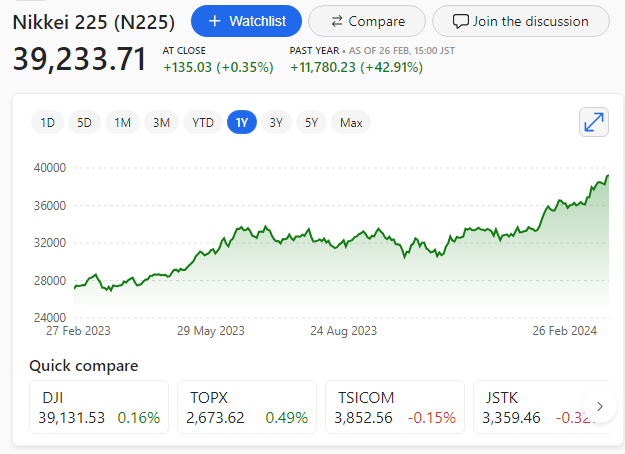
December 1989: The Nikkei 225 peaked at around 38,915, marking the height of Japan’s asset bubble.
1990s–2010s: The index entered a prolonged period of stagnation and decline, bottoming out below 8,000 in 2009.
December 2024: Closed at around 39,894, finally surpassing its 1989 peak.
October 2025: Broke through 50,000 for the first time in history.
December 2025: Closed the year at around 50,339 its highest year-end finish