Bulls and Bubbles: The stock market euphoria

Bubbles and Bulls

In the world of stock markets, few phenomena are as captivating—or as perilous—as bull runs and speculative bubbles.

Though often conflated, these two forces represent distinct psychological and financial dynamics that shape investor behaviour and market outcomes.

Bull Markets: Confidence with Momentum

A bull market is defined by sustained price increases across major indices. Typically driven by strong economic fundamentals, corporate earnings growth, and investor optimism.

In the U.S., iconic bull runs include the post-World War II expansion. The 1980s Reagan-era boom, and the tech-fuelled rally of the 2010s. The Dot-Com bull run, and subsequesnt crash is probably the most famous.

Bull markets feed on confidence: low interest rates, rising employment, and technological innovation often act as catalysts. Investors pile in, believing the upward trajectory will continue—sometimes for years.

But even bulls can lose their footing. When valuations stretch beyond reasonable earnings expectations, the line between bullish enthusiasm and irrational exuberance begins to blur.

Bubbles: Euphoria Untethered from Reality

A bubble occurs when asset prices inflate far beyond their intrinsic value. This is fuelled not by fundamentals but by speculation and herd mentality.

The dot-com bubble of the late 1990s is a textbook example. Companies with no profits—or even products—saw their valuations soar simply for having ‘.com’ in their name.

Similarly, the U.S. housing bubble of the mid-2000s was driven by easy credit and the belief that property prices could only go up.

Bubbles often follow a predictable arc: stealth accumulation, media attention, public enthusiasm, and finally, a euphoric peak.

When reality sets in—be it through disappointing earnings, regulatory shifts, or macroeconomic shocks—the bubble bursts! Leaving behind financial wreckage and a trail of disillusioned investors.

Spotting the Difference

While bull markets can be healthy and sustainable, bubbles are inherently unstable. The key distinction lies in valuation discipline.

Bulls are supported by earnings and growth; bubbles are driven by hype and fear of missing out (FOMO).

Tools like the cyclically adjusted price-to-earnings (CAPE) ratio and historical trend analysis can help investors discern whether they’re riding a bull or inflating a bubble.

📉 The Aftermath and Opportunity Ironically, the collapse of a bubble often sows the seeds for the next bull market. As excesses are purged and valuations reset, long-term investors find opportunities in the rubble.

The challenge lies in resisting the emotional extremes—greed during the rise, panic during the fall—and maintaining a clear-eyed view of value.

In markets, as in life, not every rise is rational, and not every fall is fatal

As of October 2025, many analysts argue that the U.S. stock market is exhibiting classic signs of a bubble. Valuations stretched across major indices and speculative behaviour intensifying—particularly in mega-cap tech stocks and passive index funds.

The S&P 500 recently hit record highs despite a backdrop of political gridlock and a government shutdown. This suggests a disconnect between price momentum and underlying economic risks.

Indicators like Market Cap to Gross Value Added (GVA) and excessive investor sentiment point to a speculative mania. Some experts are calling it the largest asset bubble in U.S. history.

While a full-blown crash hasn’t materialised yet, the market’s frothy conditions and historical October volatility have many bracing for a potential correction.

Is the resilient stock market keeping the U.S. economy out of a recession and if so – is that a bad thing?

U.S. recession looming?

The Resilient Stock Market: A Double-Edged Shield Against Recession

In a year marked by political volatility, Trumps tariff war, soft labour data, and persistent inflation anxieties, one pillar of the economy has stood tall: the stock market.

Defying expectations, major indices like the Nasdaq, Dow Jones and S&P 500 have surged, buoyed by AI-driven optimism and industrial strength. This resilience has helped stave off a technical recession—but not without raising deeper concerns about economic fragility and inequality.

At the heart of this phenomenon lies the ‘wealth effect’. As equity portfolios swell, high-net-worth households feel richer and spend more freely.

This consumer activity props up GDP figures and masks underlying weaknesses in wage growth, job creation, and productivity.

August’s economic data showed surprising strength in consumer spending and housing, despite lacklustre employment figures and fading stimulus support.

But here’s the rub: this buoyancy is not broadly shared. According to the University of Michigan’s sentiment index, confidence has declined sharply since January, especially among those without significant stock holdings.

Balance

The U.S. economy, in effect, is being held aloft by a narrow slice of the population—those with the means to benefit from rising asset prices. For everyone else, the recovery feels distant, even illusory.

This divergence creates a dangerous illusion of stability. Policymakers may hesitate to intervene—whether through fiscal support or monetary easing—because headline indicators look healthy. Yet beneath the surface, vulnerabilities abound.

If the market were to correct sharply, the spending it fuels could evaporate overnight, exposing the economy’s dependence on asset inflation.

Moreover, the market’s resilience may be distorting capital allocation. Companies flush with investor cash are prioritising stock buybacks and speculative ventures over wage growth or long-term investment. This can exacerbate inequality and erode the foundations of sustainable growth.

In short, while the stock market’s strength has delayed a recession, it has also deepened the disconnect between Wall Street and Main Street.

The danger lies not in the market’s success, but in mistaking it for economic health. A resilient market may be a shield—but it’s not a cure. And if that shield cracks, the consequences could be swift and severe.

The challenge now is to look beyond the indices and ask harder questions: Who is benefitting? What are we neglecting?

And how do we build an economy that’s resilient not just in numbers, but in substance, regardless of nation.

Buffett Indicator surges past 200% – raising alarm bells on market valuation

Warren Buffett

The so-called ‘Buffett Indicator’—a stock market valuation metric championed by Warren Buffett—has surged past 200%, reigniting concerns that equities may be dangerously overvalued.

The ratio, which compares the total market capitalisation of U.S. stocks to the country’s gross domestic product (GDP), now sits well above the threshold Buffett once described as “playing with fire”.

Historically, the Buffett Indicator has served as a broad gauge of whether the market is trading at a premium or discount to the underlying economy.

100%

A reading of 100% suggests that the market is fairly valued. But when the ratio climbs significantly above that level, it implies that investor optimism may be outpacing economic fundamentals.

200%

At over 200%, the current reading suggests that the market is valued at more than twice the size of the U.S. economy. This level is not only unprecedented—it’s also well above the peak seen during the dot-com bubble, which ended in a dramatic crash in the early 2000s.

Buffett himself has warned in the past that when the indicator reaches extreme levels, it should serve as a ‘very strong warning signal’. While he has not commented on the current spike, the metric’s ascent has prompted renewed scrutiny from analysts and investors alike.

Some argue that the indicator may be distorted by structural changes in the economy, such as the rise of intangible assets and global revenue streams that aren’t captured by GDP alone.

Others point to low interest rates and persistent liquidity as reasons why valuations have remained elevated.

Do not ignore the warning

Still, the psychological impact of the 200% mark is hard to ignore. It suggests that investors may be pricing in perfection—expecting strong earnings growth, low inflation, and continued central bank support. Any deviation from this ideal scenario could trigger a sharp revaluation.

For long-term investors, the Buffett Indicator’s warning may not signal an immediate crash, but it does suggest caution. Diversification, disciplined risk management, and a clear understanding of valuation metrics are more important than ever.

As markets continue to defy gravity, the Buffett Indicator stands as a quiet sentinel—reminding investors that even the most exuberant rallies are tethered to economic reality. Whether this is a moment of irrational exuberance or a new normal remains to be seen.

But as Buffett once said, ‘The stock market is a device for transferring money from the impatient to the patient’.

It’s just a matter of ‘time’

🔍 How It Works

Formula:

Buffett Indicator=Total MarketCap/GDP

Interpretation:

Below 100%: Market may be undervalued

100%–135%: Fairly valued

Above 135%: Overvalued

Above 200%: Historically considered ‘playing with fire’, according to Buffett himself

🚨 Current Status (as of late September 2025)

The Buffett Indicator has surged to 218%, breaking records set during the Dotcom bubble and the COVID-era rally.

This extreme level suggests that equity values are growing much faster than the economy, raising concerns about a potential market bubble.

The surge is largely driven by mega-cap tech firms investing heavily in AI, which has inflated valuations.

🧠 Why It Matters

Buffett once called this “probably the best single measure of where valuations stand at any given moment.”

While some argue the metric may be outdated due to shifts in the economy (e.g., rise of intangible assets like software and data), it still serves as a powerful warning signal when valuations soar far above GDP.

Stock market pullback in 4th quarter… how likely is it?

Taking Stock

While many investors are hoping for a year-end rally, several analysts are warning that a fourth-quarter pullback remains a real possibility.

Valuation concerns: Large-cap stocks are trading at historically high valuations, reminiscent of the 2021 peak. That leaves little room for error if economic data disappoints.

Tariff aftershocks: April’s ‘Liberation Day’ tariffs triggered a sharp sell-off, and although markets rebounded, strategists at Stifel expect an ‘echo’ effect—potentially a 14% drop in the S&P 500 before year-end.

Economic slowdown: Consumer spending is showing signs of strain, and real wage growth may not keep pace with rising prices. That could dampen demand and corporate earnings.

Trade uncertainty: The 90-day tariff pause expired in July 2025 (with adjustments), leaving markets to navigate the fallout—valuation echoes, trade uncertainty, and investor psychology now collide in Q4’s shadow. This could lead to headline-driven volatility through Q4.

Mixed sentiment: Some strategists remain cautiously optimistic, citing resilient labour data and hopes for more Fed rate cuts. But others warn that investors may be wishful thinking!

A U.S. stock market pullback is likely due in Q4 2025

The fourth quarter (Q4) of the calendar year runs from 1st October to 31st December. In financial and editorial contexts, it often carries symbolic weight—year-end reckonings, holiday spending, and final earnings reports all converge here.

A pullback is due, but when?

Japan’s Nikkei surges to historic highs amid reform momentum

Japan's share soar to new highs!

Japanese equities are enjoying a remarkable rally, with the Nikkei 225 and broader Topix indices repeatedly breaking record highs throughout September 2025.

This surge reflects a potent mix of domestic reform, foreign investment, and a growing belief that Japan’s corporate landscape is undergoing a long-overdue transformation.

At the heart of the rally is Prime Minister Kishida’s push for structural reform, including corporate governance improvements and incentives for companies to boost shareholder returns.

These measures have resonated with global investors, who are increasingly viewing Japan as a stable alternative to more volatile markets. Foreign inflows have accelerated, with analysts noting that the momentum is built on solid economic fundamentals rather than speculative hype.

Despite the optimism, risks remain. Political instability, a potential spike in the yen, and ripple effects from a U.S. market downturn could all dampen the rally.

Yet, for now, these concerns are being outweighed by Japan’s reform narrative and its relative insulation from global tech bubbles and geopolitical tensions.

The Nikkei’s consistent climb is also symbolic. For decades, Japan’s stock market was seen as stagnant and haunted by the burst of its 1980s asset bubble.

Nikkei one year chart

Today, the narrative is shifting. Investors are no longer just betting on Japan’s past resilience; they’re buying into its future potential.

This bullish sentiment marks a turning point not just for Japanese equities, but for how global markets perceive Japan’s role in the 21st-century economy.

If reforms continue and foreign confidence holds, the Nikkei’s ascent may be more than a fleeting high—it could signal a new era of Japanese financial leadership.

It is very high! Will a U.S. stock market pullback dampen the Nikkei party?

Fed flags elevated stock valuations amid market euphoria

Fed suggest stock market overvalued

In a candid assessment that sent ripples through global markets, Federal Reserve Chair Jerome Powell has acknowledged that U.S. stock prices appear ‘fairly highly valued’ by several measures.

Speaking at a recent event in Providence, Rhode Island, Powell reportedly responded to questions about the Fed’s tolerance for elevated asset prices, noting that financial conditions—including equity valuations—are closely monitored to ensure they align with the central bank’s policy goals.

The remarks come at a time when major indices such as the S&P 500 and Nasdaq have been flirting with record highs, fuelled by investor enthusiasm around artificial intelligence and expectations of continued monetary easing.

Powell’s comments, however, injected a dose of caution, suggesting that the Fed is wary of froth building in the markets.

While Powell stopped short of calling current valuations unsustainable, his phrasing echoed past warnings from central bankers about speculative excess. ‘Markets listen to us and make estimations about where they think rates are going’, he reportedly said, adding that the Fed’s policies are designed to influence broader financial conditions—not just interest rates.

The timing of Powell’s remarks is notable. The Fed recently (September 2025) cut its benchmark rate by 0.25 percentage points, a move that had bolstered investor sentiment.

Yet Powell also highlighted the ‘two-sided risks’ facing the economy: inflation remains sticky, while the labour market shows signs of softening. This balancing act, he implied, leaves little room for complacency.

Markets reacted swiftly. Tech stocks, which have led the recent rally, saw sharp declines, with Nvidia and Amazon among the hardest hit.

Powell’s warning may not signal an imminent correction, but it does suggest the Fed is keeping a watchful eye on valuations—and won’t hesitate to act if financial stability is threatened

From Missiles to Tariffs: A desensitised stock market faces Trump’s new world

Markets desensitised to U.S. policy making

In years past, the mere hint of U.S. airstrikes or heightened geopolitical tension would send global stock markets into panic mode.

Yet, following President Trump’s re-election and his increasingly aggressive foreign policy stance, investor reactions have become notably muted.

From missile strikes on Iranian nuclear sites to an orchestrated ceasefire between Iran and Israel, markets have barely flinched. The question arises: are investors becoming desensitised to Trump’s geopolitical theatre?

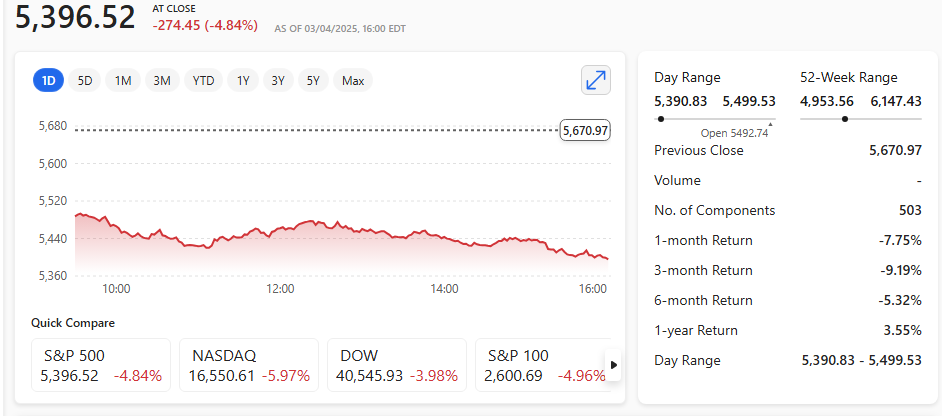
Take the latest skirmish between Iran and Israel. After nearly two weeks of missile exchanges, Trump’s announcement of a ‘complete and total ceasefire’ barely nudged the S&P 500.

That calm came despite the U.S. launching pre-emptive strikes on Iranian facilities and absorbing retaliatory attacks on its military base in Qatar.

In another era, or under a different administration even, such developments might have triggered a broad risk-off sentiment. Instead, Wall Street just shrugged.

One reason may be fatigue. Trump’s approach – rife with tariffs, sanctions, and sudden reversals – has bred a kind of market immunity.

Investors, well-versed in the rhythm of Trump’s provocations, have begun treating them as background noise. His revived tariff agenda, particularly the threats aimed once again at China and EU auto imports, has likewise failed to prompt major selloffs.

Similarly, the ongoing Russia-Ukraine conflict, once a source of intense volatility, now registers as a strategic stalemate in the market’s eyes.

While Trump’s rhetoric surrounding Ukraine has shifted unpredictably, investors appear more focused on earnings, inflation data, and central bank signals than on diplomatic fallout and war!

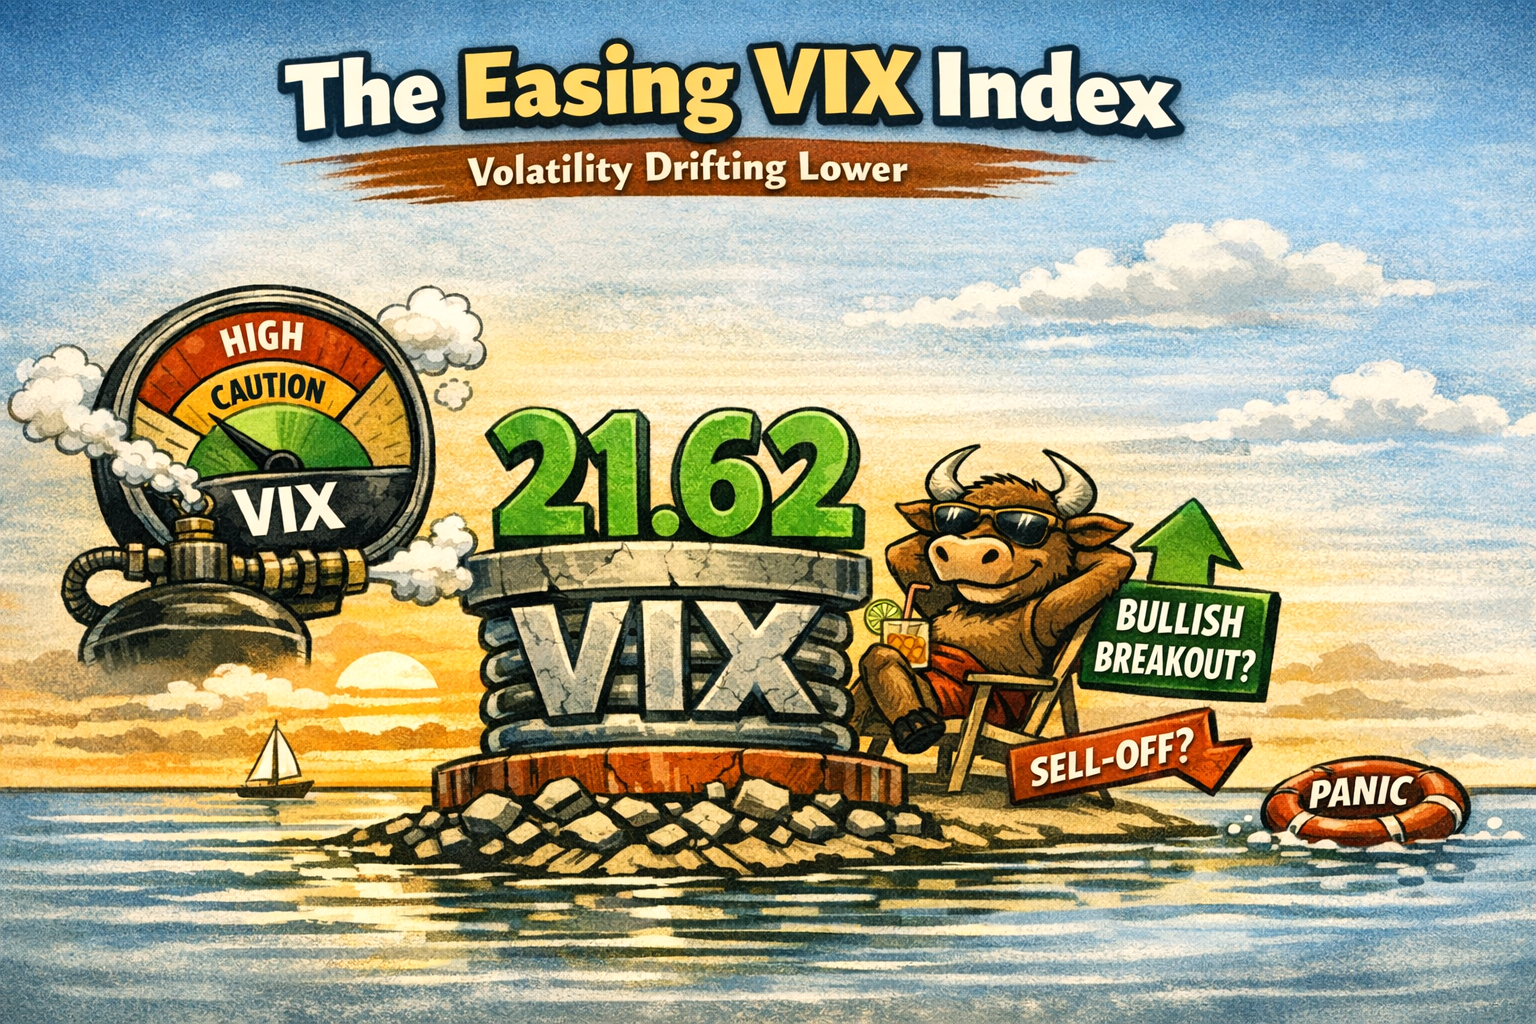
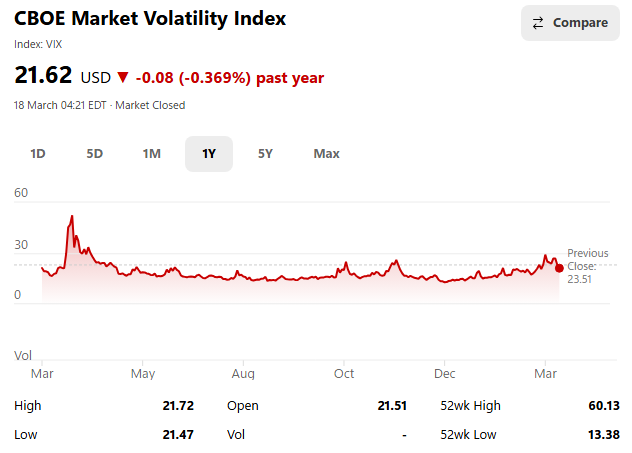
This is not to suggest markets are indifferent to geopolitical risk, but rather that they’ve adapted. Algorithmic trading models may be increasingly geared to discount Trump’s headline-grabbing tactics, while institutional investors hedge through gold, volatility indices, or energy plays without dumping equities outright.

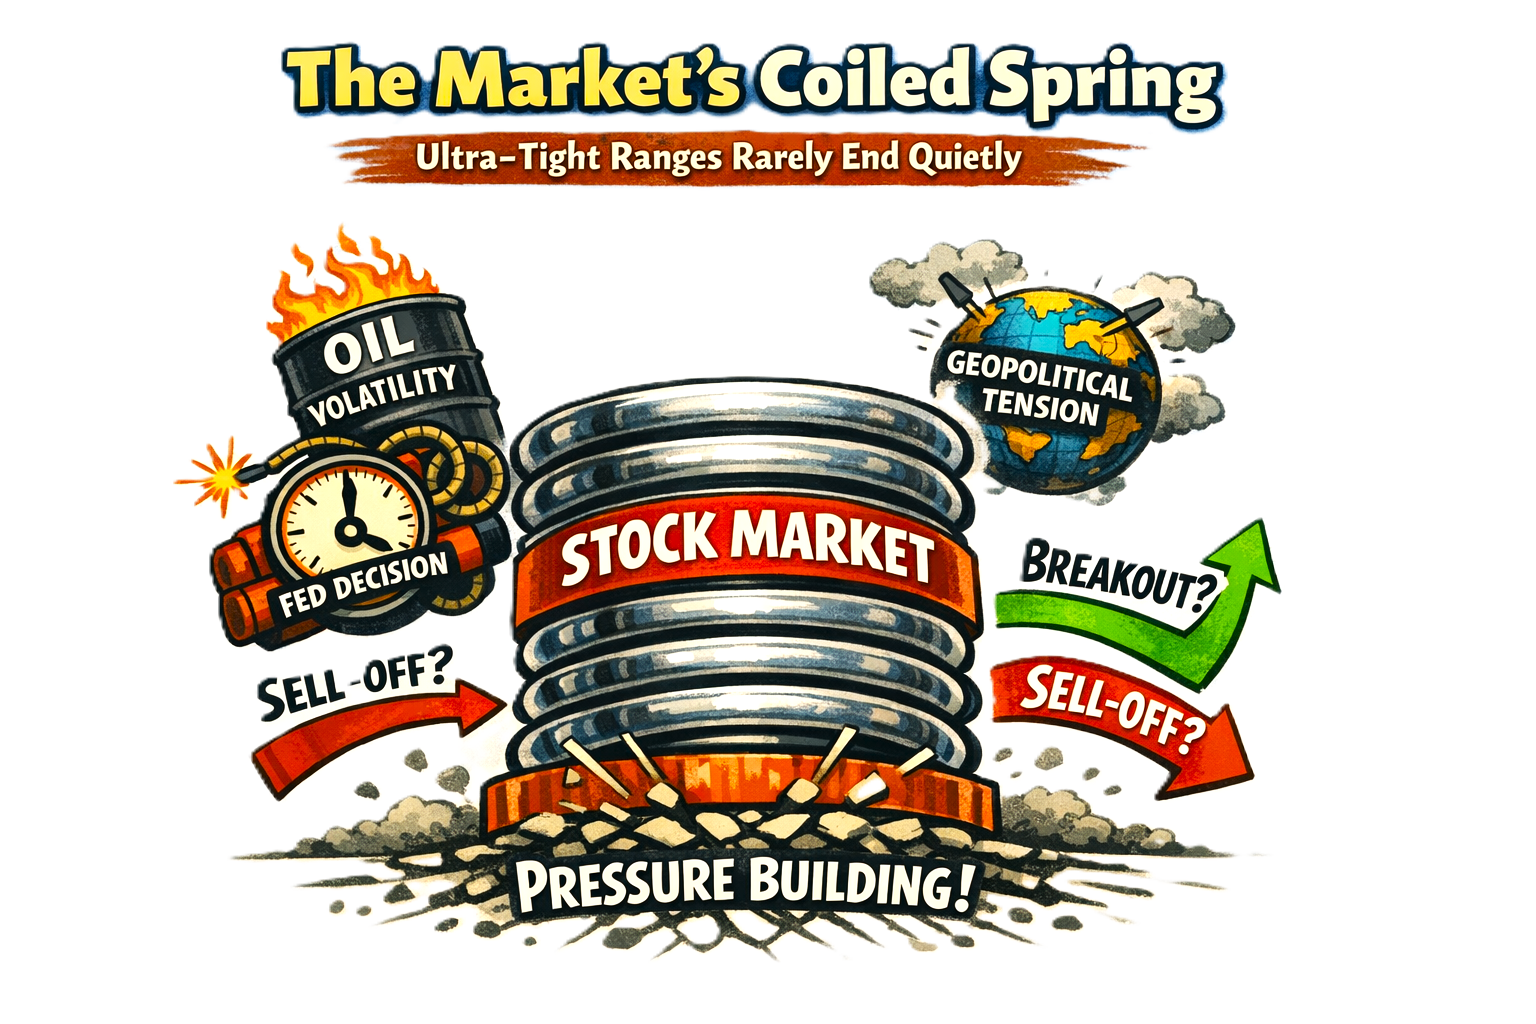
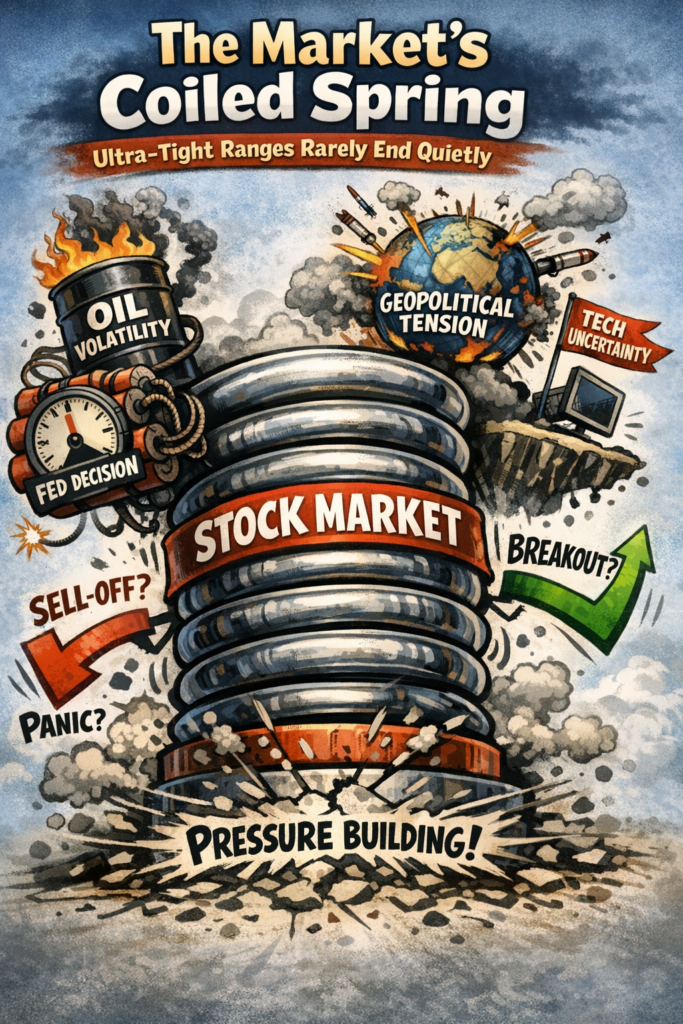
Critics argue this detachment is dangerous. Should a flashpoint spiral out of control, be it over Hormuz, Ukraine, or Taiwan, the slow-boiling complacency could leave portfolios badly exposed.

Still, for now, Trump’s policies are being priced in not with panic, but with complacency maybe.

The real story may not be what Trump does next, but how long the markets can continue to look away.

Trump announces he had brokered ceasefire between Israel and Iran?

Tensions between Israel and Iran reached a boiling point after 12 days of cross-border missile and drone strikes.

The situation escalated further when U.S. forces under President Trump launched targeted airstrikes on key Iranian nuclear sites, Fordow, Natanz, and Isfahan, prompting a direct Iranian missile response on a U.S. base in Qatar.

In a dramatic turn, President Trump announced what he called a ‘Complete and Total CEASEFIRE‘ – announced on Truth Social. According to Trump’s plan, Iran would begin the ceasefire immediately, with Israel to follow 12 hours later.

The truce would reportedly be considered complete after 24 hours if all attacks stopped.

While Trump touted the ceasefire as a triumph of ‘peace through strength’, analysts questioned the ceasefire’s enforceability – especially since missile exchanges reportedly continued despite the announcement.

Nonetheless, Trump claimed credit for halting the region’s slide into all-out war without committing to prolonged U.S. military involvement.

Critics argue Trump’s strategy relies more on military pressure and media theatrics than diplomatic engagement.

Supporters counter that his boldness forced both sides to the table. Either way, the world is watching to see whether this fragile peace endures – or erupts again in fire.

If this turns out to be a masterstroke in political brinkmanship – hats off to Trump, I guess. Whichever way you look at it, the precision U.S. strike on Iran was exactly that – precision. And, you have to take note.

Iran has been weakened, and this may even influence Russia’s war on Ukraine. Hopefully Israel with Palestine too – regardless of stock market reaction.

And that has to be a good thing!

But has Israel finished their war?

Despite all the noise regarding stock market reaction, one thing is for certain – the anxiety and worry for the people of the Middle East is unquestionable.

It’s not a happy time.

FTSE 100 achieves longest unbroken run since inception in 1984 – how significant is this record?

Longest FTSE 100 consecutive daily gains since 1984

The FTSE 100 has made history, recording 15 consecutive days of gains—its longest winning streak since its inception in 1984.

The index closed at 8,596.35 points, marking a 1.17% rise on the final day of the streak.

This remarkable run comes amid the potential of easing trade tensions between the U.S. and China, with signs that tariff negotiations may commence.

Investors have responded positively, driving up stock prices across multiple sectors. Financial stocks, including Barclays and HSBC, have surged following strong earnings reports, while industrial and mining stocks – such as Rolls-Royce and Rio Tinto – have rebounded.

Despite the impressive streak, analysts caution that uncertainty remains. The FTSE 100 has yet to reclaim its record high from March 2025, and concerns over global trade policies could limit further gains.

However, the index has still outperformed expectations, rising 4.9% over six months and 5.1% over the past year.

FTSE 100 one-month chart

FTSE 100 one-month chart

As investors celebrate this milestone, the question remains: can the FTSE 100 sustain its momentum, or is a market correction on the horizon?

Either way, this winning streak has cemented its place in financial history.

Market pessimism – a contrarian’s opportunity?

Investing

The stock market is no stranger to volatility, and recent events have left investors grappling with uncertainty.

However, for those who embrace a contrarian mindset, the current wave of pessimism might just be the golden opportunity they’ve been waiting for.

Historically, extreme market pessimism has often preceded significant rebounds. The contrarian philosophy – buying when others are selling – rests on the belief that markets tend to overreact to negative news.

This overreaction creates opportunities for savvy investors to capitalise on undervalued assets.

Recent market turbulence, fueled by concerns over global trade policies and economic slowdowns, has pushed sentiment to new lows. Yet, history suggests that such moments of despair often mark the beginning of recovery.

For instance, during similar periods of heightened pessimism, indices like the S&P 500 have shown remarkable gains in subsequent months.

The last time stock investors were so pessimistic was in October 2023, and then the S&P 500 rose 19% over the next three months

While risks remain, including the potential for prolonged economic challenges, the contrarian approach offers a glimmer of hope. By focusing on long-term fundamentals and resisting the urge to follow the herd, investors may find themselves well-positioned to benefit from the market’s eventual rebound.

In the end, the key lies in patience and perspective. As the saying goes, ‘Fortune favours the bold’ – and in the world of investing, boldness often means going against the grain.

However, this market shock has been created by the introduction of Trump’s tariffs and the real unknown is just how far the U.S. President with push his tariff agenda.

Dow dives 1600 points after Trump’s tariff attack – S&P 500 and Nasdaq drop the most since 2020

Stocks markets fall

The U.S. stock market experienced a dramatic plunge following President Donald Trump’s announcement of sweeping tariffs, marking one of the most significant market downturns since 2020.

On 3rd April 2025, the Dow Jones Industrial Average plummeted by 1,600 points, a staggering 4% drop, closing at 40,546.

Dow Jones one day chart

The S&P 500 fell by 4.8%, while the tech-heavy Nasdaq Composite suffered a 6% decline, reflecting widespread investor anxiety.

S&P 500 one day chart

Trump’s tariffs, which include a baseline 10% levy on imports from all trading partners and higher rates for specific countries, have sparked fears of a global trade war.

The effective tariff rate for China, for instance, has risen to 54%, raising concerns about supply chain disruptions and inflation. Major industries, including technology, retail, and manufacturing, were hit hard.

Apple shares dropped nearly 10%, while companies like Nike and Nvidia saw significant losses.

Apple one day chart

The market reaction underscores the uncertainty surrounding the economic impact of these tariffs. Analysts warn that the measures could dampen consumer spending, increase inflation, and slow economic growth.

The ripple effects were felt globally, with European and Asian markets also experiencing declines. The Nikkei index declined a further 3%.

Nikkei Index five-day chart

Despite the turmoil, Trump defended the tariffs, likening them to a necessary ‘operation’ for the economy. He expressed confidence that the markets would eventually rebound, emphasising the long-term benefits of reshoring manufacturing and generating federal revenue.

As investors grapple with the implications of these policies, the focus remains on potential retaliatory measures from affected countries and the broader impact on global trade dynamics.

The sharp market sell-off serves as a stark reminder of the delicate balance between protectionist policies and economic stability in an interconnected world.

The coming weeks will be crucial in determining whether these tariffs lead to lasting economic shifts or temporary market volatility.

U.S. companies are experiencing more harm from Trump’s tariffs. He wants manufacturing to come back to America – but after decades of globalization fine tuning – that is no easy task.

Are markets underestimating the impact of the tariffs on inflation?

Are markets pricing in the fact that Trump’s tariff policy will not be fully followed through?

The U.S. would be lucky to see a single rate cut from the Federal Reserve this year – and that will unsettle investors.

The U.S. economy could now only expand by between 1% and 1.5% this year – this would be a significant change in the growth outlook when compared with the International Monetary Fund’s (IMF) projection of 2.7% U.S. growth made earlier this year.

If we get close to 1%, we get close to ‘stall’ speed and then it could just stop – and that will mean recession or worse for the U.S.

Waning enthusiasm around Trump – AI and crypto

Lack of enthusiasm

As we progress through 2025, it’s evident that the initial excitement surrounding Donald Trump’s election win, artificial intelligence (AI), and cryptocurrency has begun to wane – but for how long?

Investors and the general public seem to be growing more cautious, reflecting a shift in sentiment towards these once highly anticipated topics.

Trump’s tariffs

In the realm of politics, Trump’s influence on the stock market has been notably erratic. His tariff threats and new policies have created uncertainty and volatility, leading investors to react negatively. Trump’s riviera suggestion for the Gaza strip, his interest in Canada and fixation for Greenland ownership have all tilted ‘standard’ political logic.

Recent announcements of additional tariffs on steel and aluminum imports have only heightened concerns, causing stock market fluctuations and dampening investor enthusiasm. The initial optimism that Trump’s policies would bolster the economy has been replaced by a more cautious outlook.

AI

Artificial intelligence, once hailed as the technological revolution of the century, is also experiencing a cooling of enthusiasm. While AI continues to make strides in various industries, the initial hype has given way to a more measured perspective.

Investors are now more wary of the long-term potential and the substantial investments required to develop AI technologies. Companies like DeepSeek, which have claimed cost efficiencies, are causing big tech firms to reevaluate their spending on AI projects, leading to a more tempered approach.

Crypto

Cryptocurrency, too, has seen mixed sentiments. Despite ongoing enthusiasm from dedicated supporters, the market’s volatility and regulatory challenges have tempered the initial excitement.

The dramatic price swings and uncertain regulatory landscape have made investors more cautious. While there are still significant investments and innovations in the crypto space, the euphoria that once surrounded it has subdued.

The excitement around Trump, AI, and cryptocurrency is not as fervent as it once was. The reality of market volatility, regulatory challenges, and the substantial investments required has led to a more cautious and measured approach.

As we move forward, it will be interesting to see how these areas evolve and whether they regain the heightened enthusiasm they once enjoyed.

Warning issued for stock market bubble

AI bubble

Howard Marks, a widely respected value investor and co-founder of Oaktree Capital Management, recently issued a memo highlighting several cautionary signs of a potential bubble in the stock market.

Marks, who famously foresaw the dot-com bubble, pointed out that today’s high market valuations could lead to poor returns over the long term or even sharp declines in the near term.

Marks reportedly noted that the S&P 500’s current price-to-earnings (P/E) ratio is around 22, which is near the top of the historical range. He explained that higher P/E ratios have historically led to lower returns in the long run.

Marks also expressed concern about the enthusiasm surrounding new technologies like AI, which has driven up the prices of companies like Nvidia.

Marks emphasized that investors should not be indifferent to today’s market valuations and should be cautious about the potential for a market correction.

He also raised questions about the role of automated buying from passive investors and the presumption that the largest companies will always succeed.

Dividend stocks in the FTSE 100 and FTSE 250 – a basic overview

Passive income from dividend stocks

The FTSE 100 index comprises the 100 largest companies by market capitalisation. These companies are typically well-established and financially stable, making them reliable dividend payers. 

The average dividend yield for the FTSE 100 is around 3.97%.

Here are ten dividend stocks in the FTSE 100

British American Tobacco (BATS) – Known for its high dividend yield, often exceeding 7%. Not an ethical choice.

Rio Tinto (RIO) – A mining giant with a strong dividend history.

Imperial Brands (IMB) – Another tobacco company with a robust dividend yield. Not an ethical choice.

Legal & General Group (LGEN) – A financial services company with a consistent dividend payout.

GlaxoSmithKline (GSK) – A pharmaceutical company with a reliable dividend.

Vodafone Group (VOD) – A telecommunications company with a solid dividend yield.

HSBC Holdings (HSBA) – One of the largest banking institutions with a strong dividend.

BP (BP) – An oil and gas company known for its high dividend yield.

Unilever (ULVR) – A consumer goods company with a consistent dividend payout.

National Grid (NG) – An energy company with a reliable dividend history.

FTSE 250 Dividend Stocks

The FTSE 250 index includes the next 250 largest companies after the FTSE 100. These mid-cap companies often offer higher growth potential and, in some cases, higher dividend yields. The average dividend yield for the FTSE 250 is around 3.30%.

Here are ten dividend stocks in the FTSE 250

Harbour Energy (HBR) – An oil and gas company with a yield of 7.24%.

Tritax Big Box REIT (BBOX) – A real estate investment trust with a yield of 4.76%.

Investec (INVP) – A financial services company with a yield of 6.21%.

Greencoat UK Wind (UKW) – A renewable energy company with a yield of 7.48%.

IG Group Holdings (IGG) – A financial services company with a yield of 5.02%.

ITV (ITV) – A media company with a yield of 6.43%.

Abrdn (ABDN) – An investment company with a yield of 9.45%.

HICL Infrastructure (HICL) – An infrastructure investment company with a yield of 6.37%.

Direct Line Insurance Group (DLG) – An insurance company with a yield of 3.30%.

Drax Group (DRX) – An energy company with a yield of 3.81%.

Passive dividend income

Passive income from dividends
Dividend stocks in the FTSE 100 and FTSE 250 – a basic overview

Buying dividend stocks can offer several benefits to investors – key advantages are…

Regular Income

Dividend stocks provide a steady stream of income through regular dividend payments. This can be particularly appealing for retirees or those seeking passive income.

Potential for Capital Appreciation

In addition to dividends, these stocks can also appreciate in value over time, offering the potential for capital gains. This dual benefit can enhance overall returns.

Reinvestment Opportunities

Dividends can be reinvested to purchase more shares, a strategy known as dividend reinvestment. This can compound returns over time, significantly boosting the value of your investment.

Lower Volatility

Dividend-paying stocks tend to be less volatile than non-dividend-paying stocks. Companies that pay dividends are often more established and financially stable, which can provide a cushion during market downturns.

Tax Advantages

In many jurisdictions, dividends are taxed at a lower rate than regular income. This can make dividend stocks a tax-efficient investment option.

Inflation Hedge

Dividend growth can help protect against inflation. Companies that consistently increase their dividends can provide a rising income stream that keeps pace with or exceeds inflation.

Signal of Financial Health

A company that pays regular dividends is often seen as financially healthy and confident in its future earnings. This can be a positive signal to investors about the company’s stability and profitability.

Diversification

Including dividend stocks in your portfolio can add diversification. They often belong to various sectors, providing exposure to different parts of the economy.

Compounding Effect

The combination of regular dividends and potential capital gains can create a powerful compounding effect over time, significantly enhancing long-term returns.

Psychological Benefits

Receiving regular dividends can provide psychological comfort, especially during market volatility. Knowing that you are earning income regardless of market conditions can help maintain a long-term investment perspective.

Investing in dividend stocks can be a strategic way to build wealth and generate income. However, it’s important to research and choose companies with a strong track record of dividend payments and financial stability. 

Conclusion

Investing in dividend stocks from the FTSE 100 and FTSE 250 can be a strategic way to generate passive income while also benefiting from potential capital gains. These indices offer a diverse range of companies, each with its own strengths and dividend yields, making them attractive options for income-focused investors.

These are NOT recommendations – just observations. Go do your research. Interest rates will/do change quickly – go check. Thanks.

Remember to ALWAYS do your own careful and considered research…

RESEARCH! RESEARCH! RESEARCH!

Prices listed as of 9th October 2024

London is again Europe’s best stock market!

UK stock market

The London Stock Market has recently been hailed as Europe’s best stock market! 

According to a survey by Bank of America, Wall Street says that the UK is now the most preferred equity market in Europe. 

This positive sentiment comes as the FTSE 100 hit recent highs, reflecting a shift in investor confidence towards the UK stock market.

It’s quite a turnaround, especially considering the challenges the UK market has faced in recent years.

Does the stock market reflect the state of the U.S. economy?

Stock market health monitor

The stock market is often seen as a barometer of economic health, but its relationship with the broader U.S. economy is more nuanced than it might appear.

Although there are links between the two, they do not always correlate. The intricacies of this relationship and its implications for investors and the general public are multifaceted.

The stock market – A snapshot of investor sentiment

The stock market is largely a reflection of investor sentiment and their expectations for future economic performance. When investors feel optimistic, stock prices generally increase. On the other hand, when they are pessimistic, stock prices are likely to decrease. Because the market is driven by sentiment, it can react to factors that don’t immediately affect the real economy, like geopolitical events, interest rate changes, or corporate earnings announcements.

Economic indicators: The real economy

The well-being of the U.S. economy is often assessed using various indicators such as Gross Domestic Product (GDP) growth, unemployment rates, consumer spending, and inflation. These metrics offer a broader perspective on the economic climate. For example, an expanding GDP coupled with low unemployment usually indicates a robust economy, despite any fluctuations in the stock market.

Divergence between the stock market and the economy

Occasionally, the stock market and the economy may move in different directions. For instance, during the COVID-19 pandemic, the stock market swiftly recovered from an initial downturn due to extraordinary fiscal and monetary stimulus measures. In contrast, the wider economy’s recovery was more protracted, marked by persistent high unemployment and substantial disruptions across numerous industries.

Likewise, the stock market might fall even amidst positive economic indicators. This occurs when investors foresee impending difficulties, such as possible increases in interest rates or geopolitical conflicts, that could affect corporate earnings.

Short-term vs. long-term perspectives

The stock market frequently responds to short-term factors and investor behaviours, such as speculation and market sentiment, leading to volatility that may not align with the underlying economic fundamentals. Conversely, economic indicators generally offer a more long-term perspective on the economy’s health.

The broader impact of the stock market

Although the stock market’s performance can influence the economy via wealth effects and corporate investments, it is not the only indicator of economic vitality. The performance of the stock market is significant to many U.S. citizens, especially those with investments through retirement plans.

However, the real economy, as measured by employment, production, and consumption, often has a more direct impact on people’s daily lives.

Conclusion

In conclusion, although the stock market is linked to the U.S. economy, they do not always move in tandem. The stock market reflects investor sentiment and anticipations for the future, yet it may not fully represent the present economic conditions.

Hence, for a thorough assessment of economic health, it is crucial to evaluate various economic indicators in addition to the performance of the stock market.

What evidence is there that the U.S. stock market is overvalued right now?

U.S. overvalued stocks

High Price-to-Earnings (P/E) ratio

The P/E ratio of the market is a common measure of valuation. Currently, the P/E ratio is significantly higher than historical averages, indicating that stocks are priced much higher relative to their earnings.

Rapid price increases without corresponding earnings growth

When stock prices rise rapidly without a corresponding increase in earnings, it often signals overvaluation. This has been observed recently, especially with some of the major tech stocks.

Comparison to historical market tops

The current market valuations are almost as high as they were at the peak in January 2022, which was followed by a significant correction.

Buffet valuation metric

Metrics like the Buffett Indicator (market capitalisation to GDP ratio) and Tobin’s Q (market value of assets divided by replacement cost) also suggest that the market is overvalued.

While these indicators point towards overvaluation, it’s important to note that markets can remain overvalued for extended periods, and other factors like strong earnings growth can sustain high valuations for some time

U.S. stock market could be overvalued by as much as 68%

The U.S. stock market, according to some analysts suggests that the current market appears to be overvalued by around 68%.

By comparison, at the peak of the Dot-com bubble, on 24th March 2000, the market was 89.5% overvalued. When the market bottomed out 2.5 years later, it had dropped around 50% from its previous all-time high and was undervalued by nearly 21%.

The fact that the market currently appears overvalued does not necessarily mean it will correct any time soon. The forces pulling the market toward the long-run equilibrium are relatively weak and allow the market to stay over or undervalued for extended periods of time.

From 1954 to 1970, the market stayed continuously overvalued for over some 15 years, and from 1973 until 1987, it stayed undervalued for about 14 years.

The analysis clearly suggests that U.S. stocks are overvalued – but that doesn’t necessarily mean a downturn any time soon – but it will, in time, adjust.

Nvidia briefly surpassed the individual stock market values of Germany, France and the UK

Market Cap up

The little-known company, Nvidia, now stands alongside Apple and Microsoft in market cap valuation thanks to AI.

In just a little over a year it has all but tripled its market valuation and become a go to investment on Wall Street and around the world.

Nvidia’s market capitalization has recently individually surpassed the total value of the German, French, and U.K. stock markets.

With a market cap exceeding $3.4 trillion, Nvidia now stands above these significant European stock markets in valuation.

S&P 500 and Nasdaq close at new all-time highs again

S&P 500 and Nasdaq all at new highs!

The S&P 500 and Nasdaq Composite reached new closing highs on Tuesday 11th June 2024, propelled by Apple as the tech giant’s stock hit a record itself.

The S&P 500 index climbed to a new high to close at 5375, while the Nasdaq Composite finished the day at 17343. Both indices also hit new intraday highs. However, the Dow Jones Industrial Average fell by around 120 points to close at 38747.

S&P 500 reaches new all-time high on 11th June 2024

S&P 500 reaches new all-time high on 11th June 2024

Nasdaq Composite hits new all-time high on 11th June 2024

Investors seemed to be cashing in on Nvidia, a leader in artificial intelligence, and shifting focus to Apple, which recently introduced new features likely to drive a surge in iPhone upgrades.

Apple’s stock reached a new high during the trading session, its first since December 2023, with around a 7% increase. Nvidia’s stock declined by 0.7% as some profit taking ensued.

Bad economic news can be good for stocks

Bad news and good news

Bad economic news appears to have had an interesting impact on the stock market recently.

Traditionally, negative economic data might be anticipated to result in falling stock prices; however, recent trends have diverged from this norm.

News trend

In the past two months, negative economic news has had a paradoxically positive effect on equities. Investors have responded well to poor economic indicators, partly due to the belief that these could lead the Federal Reserve to begin reducing interest rates.

Dollar and the stock market

In recent times, the S&P 500, a large-cap equity index, and the U.S. dollar have exhibited a nearly perfect correlation. As the dollar has seen a gradual decline, the stock market has conversely experienced a rise. Typically, investors flock to the security of cash, and consequently the dollar, in times of uncertainty, yet they also channel investments into stocks upon the arrival of favourable news.

Economic data

Despite the upbeat trend in the stock market, real economic data has frequently fallen short of Wall Street’s predictions. The Citi Economic Surprise Index, a gauge that compares data to expectations, has been on a downward trajectory. This suggests that expectations have been surpassing the actual economic conditions, signalling that the economic situation may not be as favorable as previously thought.

Dilemma for the Fed

The Federal Reserve methodically reviews economic indicators to influence their interest rate decisions. Typically, unfavorable economic reports might prompt the Fed to reduce rates, unless there’s an uptick in inflation. Escalating inflation generally nudges the Fed towards a tighter monetary policy.

Monthly data roll-out

Data concerning the U.S. labour market presented to the Fed and markets may create that ‘pivotal’ moment – it often does – markets move of Fed comments and ‘awaited’ news. Reports detailing job openings, private sector job creation, and the Bureau of Labour Statistics’ nonfarm payrolls will shed light on the economy’s condition.

If job growth remains within the ‘Goldilocks range’ (neither too strong nor too weak), it may preserve the fragile equilibrium where unfavourable economic news has paradoxically favoured stock prices, while preventing excessive gloom.

Conclusion

To summarize, although adverse economic news has lately been advantageous for stock markets, monitoring this precarious balance is crucial. Excessive pessimism could be a harbinger of impending difficulties, despite its current benefits.

Note about Citigroup Economic Surprise Index

The Citigroup Economic Surprise Index is the sum of the difference between the actual value of various economic data and their consensus forecast. If the index is greater than zero, it means that the overall economic performance is generally better than expected, and the S&P 500 has a high probability of strengthening, and vice versa.

What is the Hindenburg Omen? A recent report suggests it has been triggered…

Red Stock market

The Hindenburg Omen is a technical indicator that signals a higher likelihood of a stock market crash.

It measures the percentage of new 52-week highs and lows against a set reference percentage. The simultaneous occurrence of new highs and lows suggests a statistical anomaly from the norm, potentially foreshadowing a stock market downturn.

The four main criteria for a Hindenburg Omen signal

  • The daily number of new 52-week highs and 52-week lows in a stock market index must be greater than a threshold amount (typically around 2.2%).
  • The ratio of 52-week highs to 52-week lows cannot be more than two times.
  • The stock market index must still be in an uptrend (determined using a 10-week moving average or the 50-day rate of change indicator).
  • The McClellan Oscillator (MCO), which measures the shift in market sentiment, must be negative.

Once the criteria are satisfied, the Hindenburg Omen remains active for 30 trading days, and any subsequent signals within this time frame should be disregarded.

Confirmation of the Hindenburg Omen occurs if the McClellan Oscillator (MCO) stays negative throughout this period, while a positive MCO invalidates it.

Traders typically employ this indicator alongside other technical analysis methods to determine optimal selling times. However, it’s crucial to remember that the Hindenburg Omen is not infallible and should be used in conjunction with other market factors.

Some of the stock market’s biggest gains in 2023 came not from crypto but from crypto related businesses

Cryptocurrency

For true cryptocurrency bulls, the most lucrative investments in 2023 were in the stock market.

While Bitcoin rallied over 150% for the year, shares of Coinbase, Marathon Digital, MicroStrategy and the Grayscale Bitcoin Trust, which are all tied closely to the digital currency, did substantially better, rising more than 300% in value. Bitcoin miner Marathon Digital soared some 688%.

Outperform

Not only have these stocks outperformed primary cryptocurrency, but they’ve been among the biggest gainers across the whole U.S. stock market. In the universe of publicly traded U.S. businesses with a market value of at least $5 billion, the four Bitcoin-tied stocks were among the eight best performers, according to analysts.

Boom or bust?

The crypto boom represents a major recovery from 2022, when coin prices plummeted, taking related equities down with them. A year highlighted by hedge fund collapses, crypto lender failures and crippling losses at miners was punctuated in November 2022, when crypto exchange FTX spiralled into bankruptcy, leading to the arrest of founder Sam Bankman-Fried on fraud charges.

Guilty of fraud
A jury in New York convicted Bankman-Fried on seven criminal counts

Bankman-Fried conviction

In 2023, a New York jury convicted Bankman-Fried on seven criminal counts, setting the 31-year-old former billionaire up for a possible long-stretch behind bars. Weeks later, Changpeng Zhao (CZ), founder of crypto exchange Binance, pleaded guilty and stepped down as the company’s CEO as part of a $4.3 billion settlement with the Department of Justice. He faces a possible prison sentence of 18 months or longer.

By the time of Bankman-Fried’s conviction and Zhao’s plea deal, the damage to the broader crypto market had mostly been realised, and investors were looking to the future. One of the biggest drivers for bitcoin this year was an easing of the Federal Reserve’s interest rate hikes, which created a more attractive case for riskier assets, but only marginally.

Bitcoin halving due May 2024 & ETF’s

Prices were also bolstered by the upcoming Bitcoin halving, which takes place every four years and is scheduled for May 2024. In the halving process, the reward for mining is cut in half, capping the supply of bitcoin.

Additional buying was sparked by the potential for a flurry of bitcoin exchange-traded funds popping up in the new year.

Marathon

Among companies closely tied to Bitcoin, the best-performing stock this year was Marathon, a mining firm that just eclipsed that market cap level last week thanks to a 125% surge in December as of Tuesday’s close. On Wednesday, the shares surged another 15%.

Last year at this time, Marathon was hanging on by a thread. The company was in the midst of a quarter that ended with a loss of almost $400 million on sales of just $28.4 million because of tumbling bitcoin prices

Mining

Bitcoin mining is an expensive operation because of the high energy costs required to operate the supercomputers. A drop in bitcoin prices means a sharp reduction in the money producers make selling the coins they mine, even as their energy bills get little relief.

Outside of the mining universe, the best-performing crypto stock in the U.S. this year is Coinbase, which has soared some 386% into 2023 year end.

Coinbase

As the only major publicly traded crypto exchange in the U.S., Coinbase has long been a popular way to buy and trade cryptocurrencies in its home market. But with the struggles at Binance, the largest exchange in the world, Coinbase picked up useful market share during non-U.S. trading hours, according to a report from research firm Kaiko in late November 2023.

Crypto
Binance is still open for business (Art illustration of a fictitious crypto trading room)

Shortly after Zhao’s plea deal, Coinbase CEO Brian Armstrong reportedly said that the news amounted to ‘a vindication of the long-term strategy that we’ve taken to focus on compliance, make sure we were building a trusted company.’

Coinbase’s revenue and stock price are still way below where they were during the heyday of crypto trading in 2021, when retail investors were jumping into the market to buy all sorts of digital currencies, including gimmicks like Dogecoin.

But the business has stabilized following drastic cost-cutting measures starting last year and extending into early 2023.

Will 2024 be an outstanding year for crypto?

Santa rally likely this December 2023?

Sata rally 2023?

Santa rally is a term that refers to the tendency of the stock market to rise in the last week of December and the first two days of January.

This is not a guaranteed or consistent pattern, and it may depend on many and various factors that affect the market performance.

However, the stock market trends in December are historically positive, according to some resources. 

When it’s cold outside sometimes the market get hot

The term ‘Santa rally’ refers to the tendency of the stock market to rise in the last week of December and the first two days of January. 

Some possible explanations for this phenomenon are tax considerations, increased holiday spending, optimism and goodwill, and institutional investors adjusting their portfolios before the year end.

But it can get cold too

However, the stock market performance in December may vary depending on the economic and political conditions of the year. For example, in 2022, the stock market had its worst year since 2008, and many major indices were negative for December. The coronavirus pandemic, the trade war with China, the Brexit uncertainty, and the U.S. presidential election (2020) and problems that followed that election were some of the factors that contributed to the market volatility and decline.

Therefore, the stock momentum going into December 2023 may depend on how the current issues and events are resolved or at least managed. The market for 2023 and right now is in a general upward trend.

Some of the key factors that may influence the market are geo-political issues, the wars between Ukraine and Russia – Israel and Palestine, inflation rates, interest rates, budgets, corporate earnings, fiscal news, central bank interventions and other brewing world tensions.

Impossible to predict, but we can make an educated guess

It is not possible to predict with certainty how the market will behave at this time of year (or any for that matter), but looking at historical data, technical analysis, fundamentals, stock market movements in general and the overall news pattern – it is possible to make a more ‘informed’ decision.

Warning!

Don’t rely on it though – ‘nothing’ is, absolutely ‘NOTHING‘ is definite in the stock market.

Trade carefully and enjoy the holiday.

Does the stock market think the Fed is going to start cutting rates aggressively any time soon?

Fed cuts any time soon?

Probably not, any time soon…

Observing the data available at CME FedWatch the stock market does not seem to expect the Fed to start cutting rates aggressively anytime soon, this opinion is based on the current pricing data of the fed-funds futures market. 

According to the CME FedWatch Tool, the probability of a rate cut in the next FOMC meeting on 13th December 2023 is very low. It is likely interest rates will be left unchanged.

The market seems to expect the Fed will hold the current rate of 5.25% until at least March 2024, but will then gradually lower it to 4.75% by December 2024. 

The market seems to be more optimistic about the U.S. economic outlook and the Fed’s ability to control inflation. The mood on rates has been buoyed recently with inflation data coming in better than expected.

It is highly likely that the Fed will have to cut rates more aggressively in 2024 and 2025 to stimulate the economy and avoid a potential prolonged recession.

South Korea stocks climb over 5% after short-selling ban

Shorth selling stocks

South Korea stocks surged on Monday, 6th November 2023 after the country imposed a ban on short selling, while most Asia-Pacific markets took the lead from a lighter than expected U.S. jobs report that helped reduce interest rate expectations.

Financial decision makers in South Korea said short selling will be banned until the end of June 2024. Short selling is when a trader sells borrowed shares to buy back at a lower price and pocket the difference.

U.S. 10-year Treasury yield hits 5% for the first time since 2007 – Dow closes down nearly 300 points

Dow

Stocks retreated Friday as a surge in the 10-year Treasury yield prompted broader concerns about the state of the economy.

The Dow Jones Industrial Average (DJIA) is one of the most widely followed stock market indices in the world. It tracks the performance of 30 large U.S. companies from various sectors, such as Boeing, Coca-Cola, Apple and Walmart.

The DJIA is often used as a proxy for the overall health of the U.S. economy and investor sentiment.

Market pressure

Lately, the DJIA has been under pressure as U.S. Treasury yields have climbed to their highest levels in over sixteen years.

Treasury yields are the interest rates that the U.S. government pays to borrow money by issuing bonds. When Treasury yields rise, it means that investors are demanding higher returns to lend money to the government, which reflects their expectations of higher inflation and economic growth.

Treasury yields

Higher Treasury yields can have a negative impact on the stock market for several reasons. Firstly, they increase the borrowing costs for companies and consumers, which can affect spending and profits.

Secondly, they make bonds more attractive as an alternative investment to stocks, which can reduce the demand for equities.

Thirdly, they can signal that the Federal Reserve may tighten its monetary policy sooner than expected, which can also dampen the stock market’s momentum.

The DJIA has fallen by more than 300 points in recent days as Treasury yields climbed above 5%, a level not seen since 2007. The rise in yields was driven by strong economic data, such as the September 2023 consumer price index (CPI), which showed that inflation remained elevated at 3.7% year-over-year. But only 1.7% off the Fed target of 2%.

Dow Johns Industrial Average close 20th September 2023

U.S. 10-year Treasury yield hits 5% for the first time since 2007 – Dow closes down nearly 300 points

The S&P 500 lost 1.26% to 4,224. The Nasdaq dropped 1.53% to 12,984. The Dow Jones Industrial Average lost 287 points, or 0.86%, to end at 33,127.28.

The yield on the benchmark 10-year Treasury crossed 5% for the first time in 16 years on Thursday 19th October 2023, a level that could easily spread through the economy by raising rates on mortgages, credit cards, vehicle loans and more. It retreated slightly from this value on Friday 20th October 2023.

Not to mention, it offers investors an attractive alternative to stocks.