We’re already seeing multiple classic bubble indicators: extreme valuations (Buffett Indicator, Shiller CAPE), record retail participation, AI-driven hype, and surging margin debt—all pointing to elevated risk.
Key Bubble Indicators Already Present
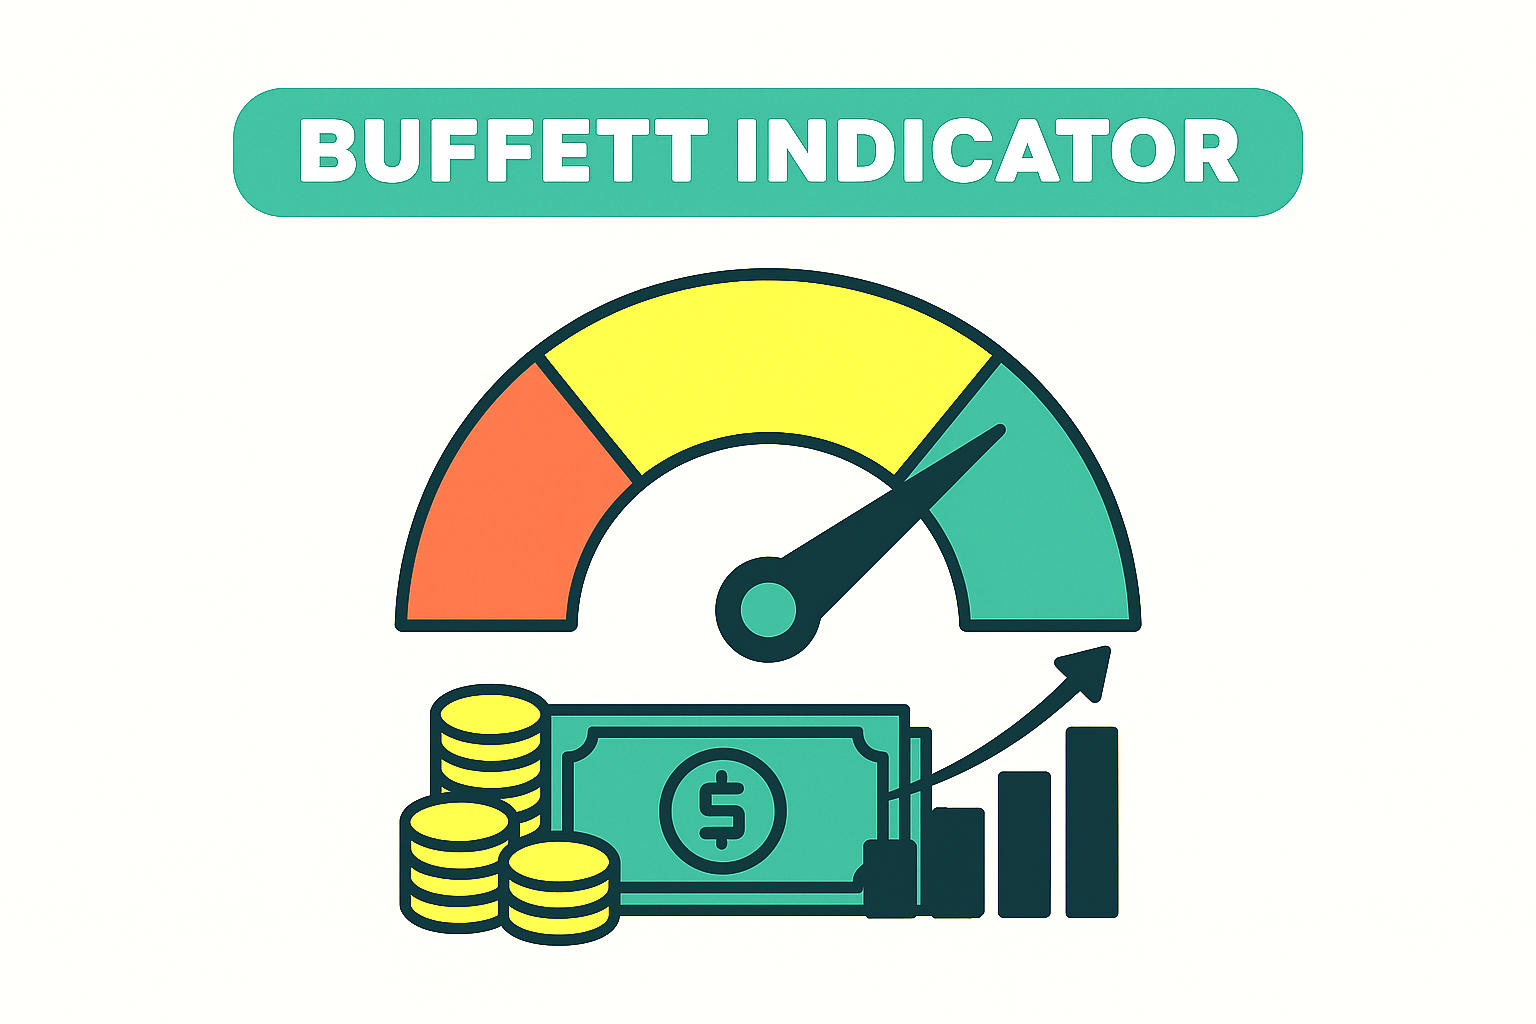
📈 Buffett Indicator (Market Cap to GDP) This ratio is at historically high levels, suggesting stocks are significantly overvalued relative to the economy. Warren Buffett himself has warned investors may be “playing with fire”.
📊 Shiller CAPE Ratio Another respected valuation metric, the cyclically adjusted price-to-earnings ratio, is also elevated—indicating unsustainable earnings multiples and potential for correction.
🧠 AI-driven speculation The rally is heavily concentrated in AI and tech stocks, with some analysts calling it a “toxic calm” before a crash. Search volume for ‘AI bubble‘ is at record highs, and billionaire Paul Tudor Jones has issued warnings.
📉 Retail investor frenzy A record 62% of Americans now own stocks, with $51 trillion at stake. This surge in retail participation is reminiscent of past bubbles, where optimism outpaces caution.
📌 New market highs The Nasdaq, S&P 500, and Dow have hit dozens of new highs in recent months. While bullish on the surface, this pace of gains often precedes sharp reversals.
💸 Margin debt and risk appetite Risk-taking is accelerating, with margin debt climbing and speculative behavior increasing. Analysts note this as a historically bad sign when paired with euphoric sentiment.
What’s Not Yet Peaking (But Worth Watching)
IPO and SPAC volume: While not at 2021 levels, any surge here could signal speculative excess.
Corporate earnings vs. valuations: Some firms still show strong earnings, but the disconnect is widening.
Narrative dominance: AI optimism is strong, but hasn’t fully eclipsed fundamentals—yet.
How far away are we from the AI bubble popping?
Will it deflate slowly or burst?