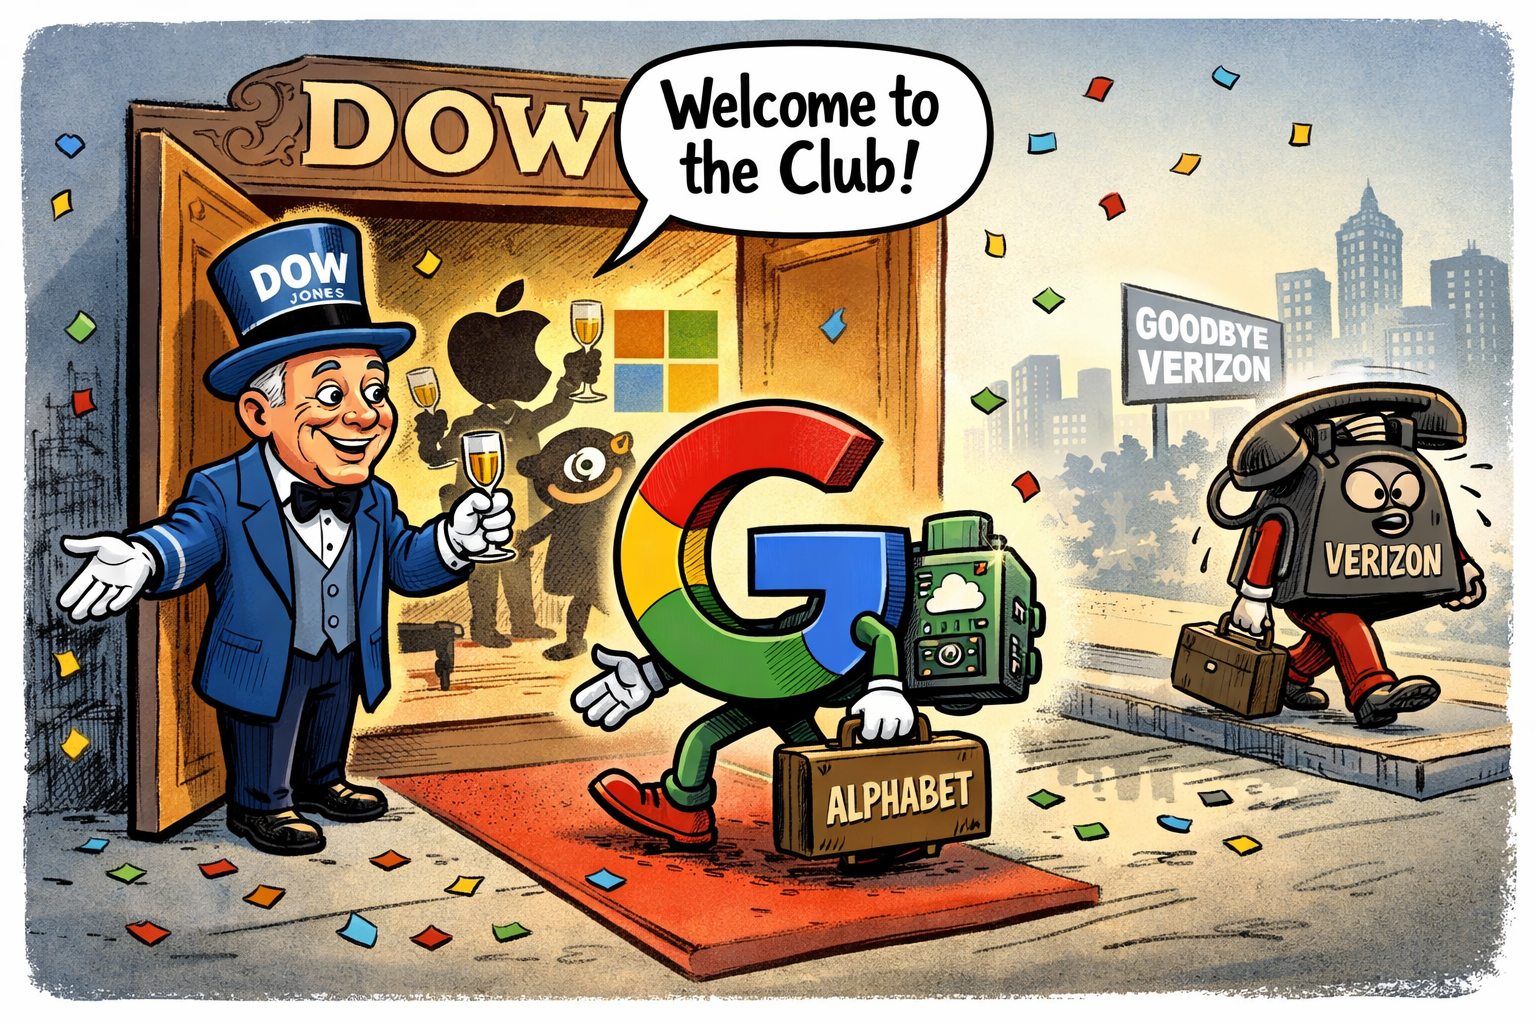
Alphabet’s entry into the Dow Jones Industrial Average this week is more than a routine reshuffle; it is a symbolic acknowledgement that the modern U.S. economy is now defined by data, cloud infrastructure and artificial intelligence rather than legacy telecommunications.
The change took effect on 29 June 2026, placing Google’s parent company among the 30 blue‑chip names that represent the industrial and corporate backbone of the United States.
Keeping up with the Joneses
Alphabet replaces Verizon, which leaves the index after more than two decades. The Dow is a price‑weighted index, meaning companies with higher share prices exert greater influence on its movements.
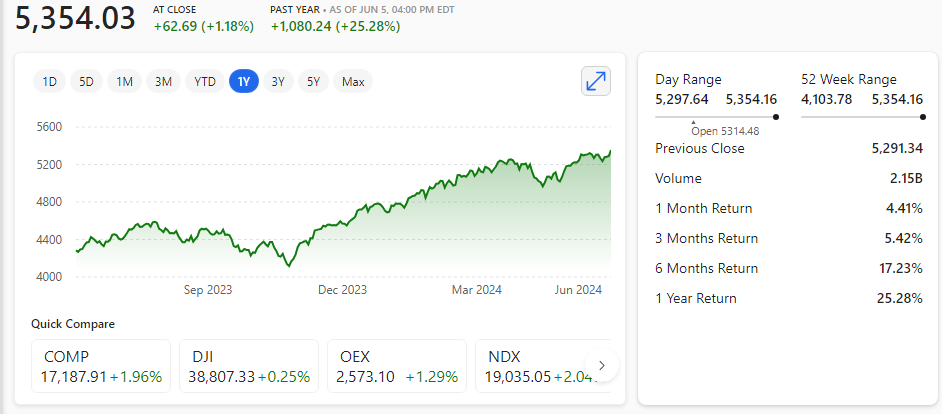
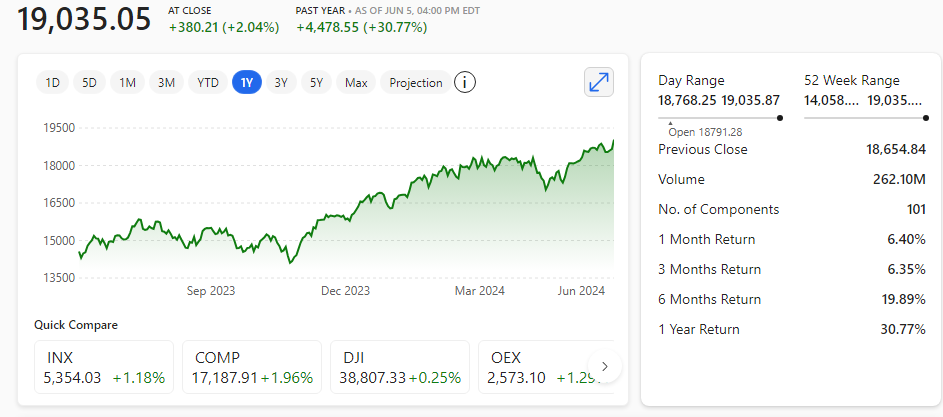
Verizon’s comparatively low share price had steadily reduced its mechanical impact, while Alphabet’s share price—hovering around $350—immediately makes it one of the Dow’s most consequential components.
This weighting logic, rather than any judgement on business quality, is the primary reason behind the switch.
The inclusion also reflects a broader structural shift. Alphabet brings significant exposure to AI, cloud computing, digital advertising and autonomous systems, areas that now dominate corporate investment and market leadership.
Five of the Mag Seven now in club Dow – 9 of the Dow are Tech related Companies
Its arrival means the Dow now contains five members of the so‑called Magnificent Seven, aligning the index more closely with the forces driving U.S. equity performance.
Verizon’s departure underscores how the Dow evolves to remain representative of the economy it tracks.
Alphabet’s addition signals that the digital era is not merely influencing markets—it is now embedded at the heart of America’s oldest stock benchmark.
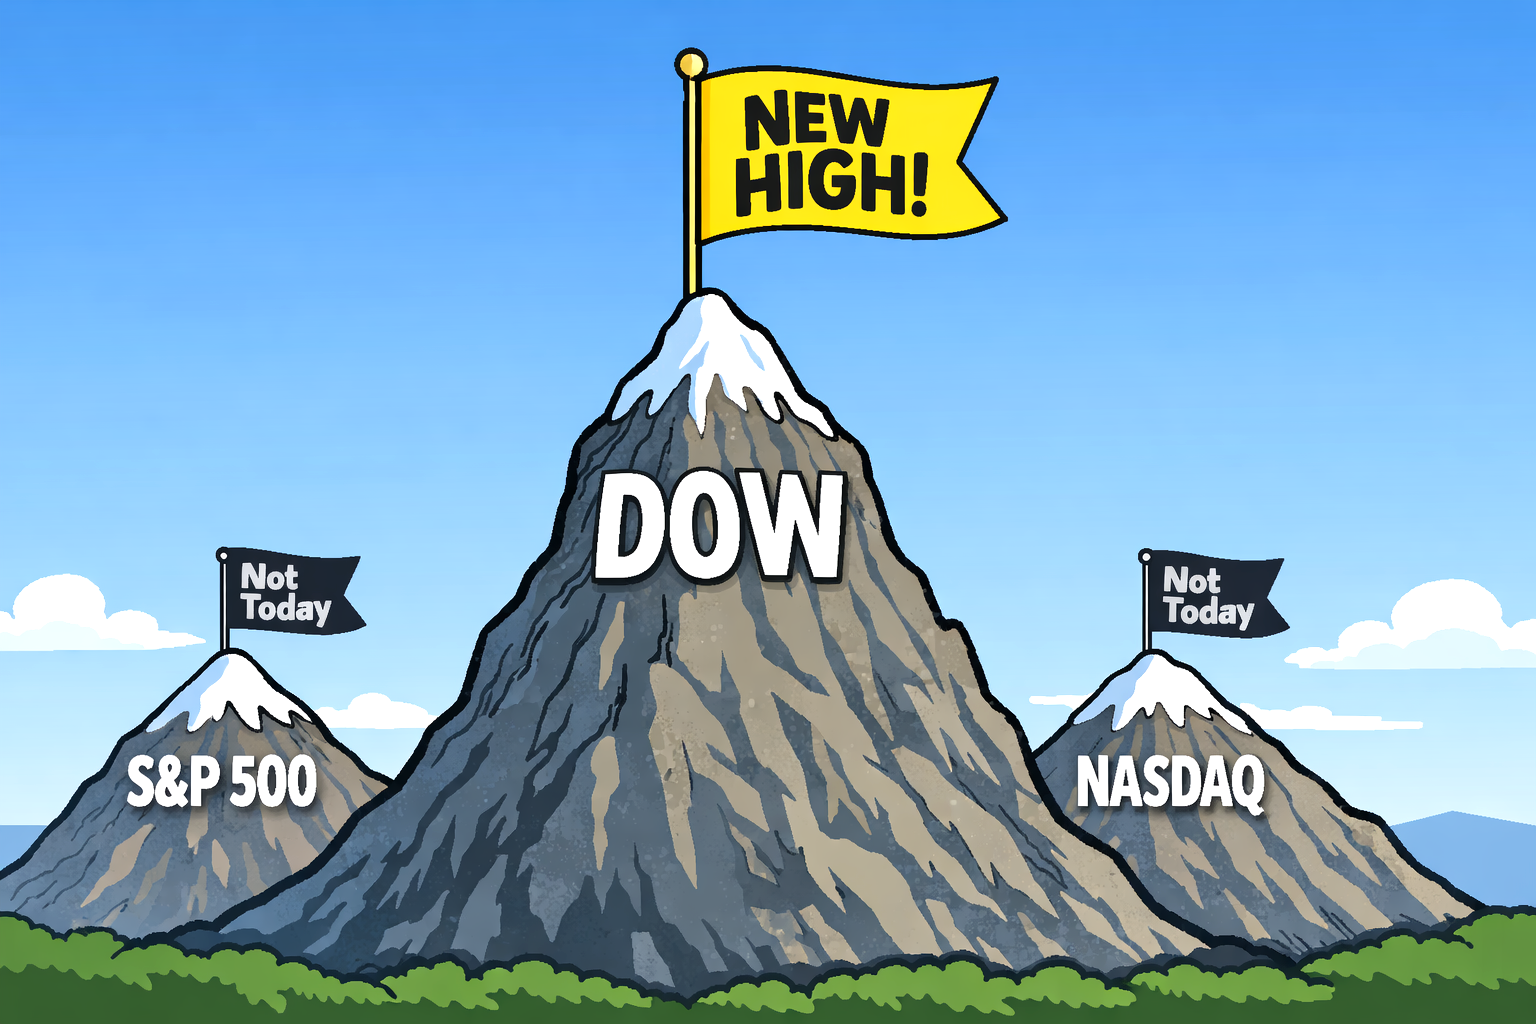
But does this spell potential danger for the Dow in the future as the balance of power is weighted more towards tech?
Should the markets crash because of the overreach of AI tech’ then the Dow will fall hard.
| Sector | Companies |
|---|---|
| Technology | Apple, Microsoft, Amazon, Alphabet, Nvidia, Cisco Systems, Intel, IBM, Salesforce |
| Financials | Goldman Sachs, JPMorgan Chase, American Express, Travelers, Visa |
| Industrials | Boeing, Caterpillar, Honeywell, 3M, UnitedHealth Group |
| Consumer | McDonald’s, Coca‑Cola, Procter & Gamble, Nike, Walmart |
| Healthcare | Johnson & Johnson, Merck, Amgen |
| Energy | Chevron |
| Communications | Walt Disney |
| Materials | Dow Inc. |