Wall Street’s Fear Gauge Surges: What the Spike in Volatility Signals

VIX Fear gauge

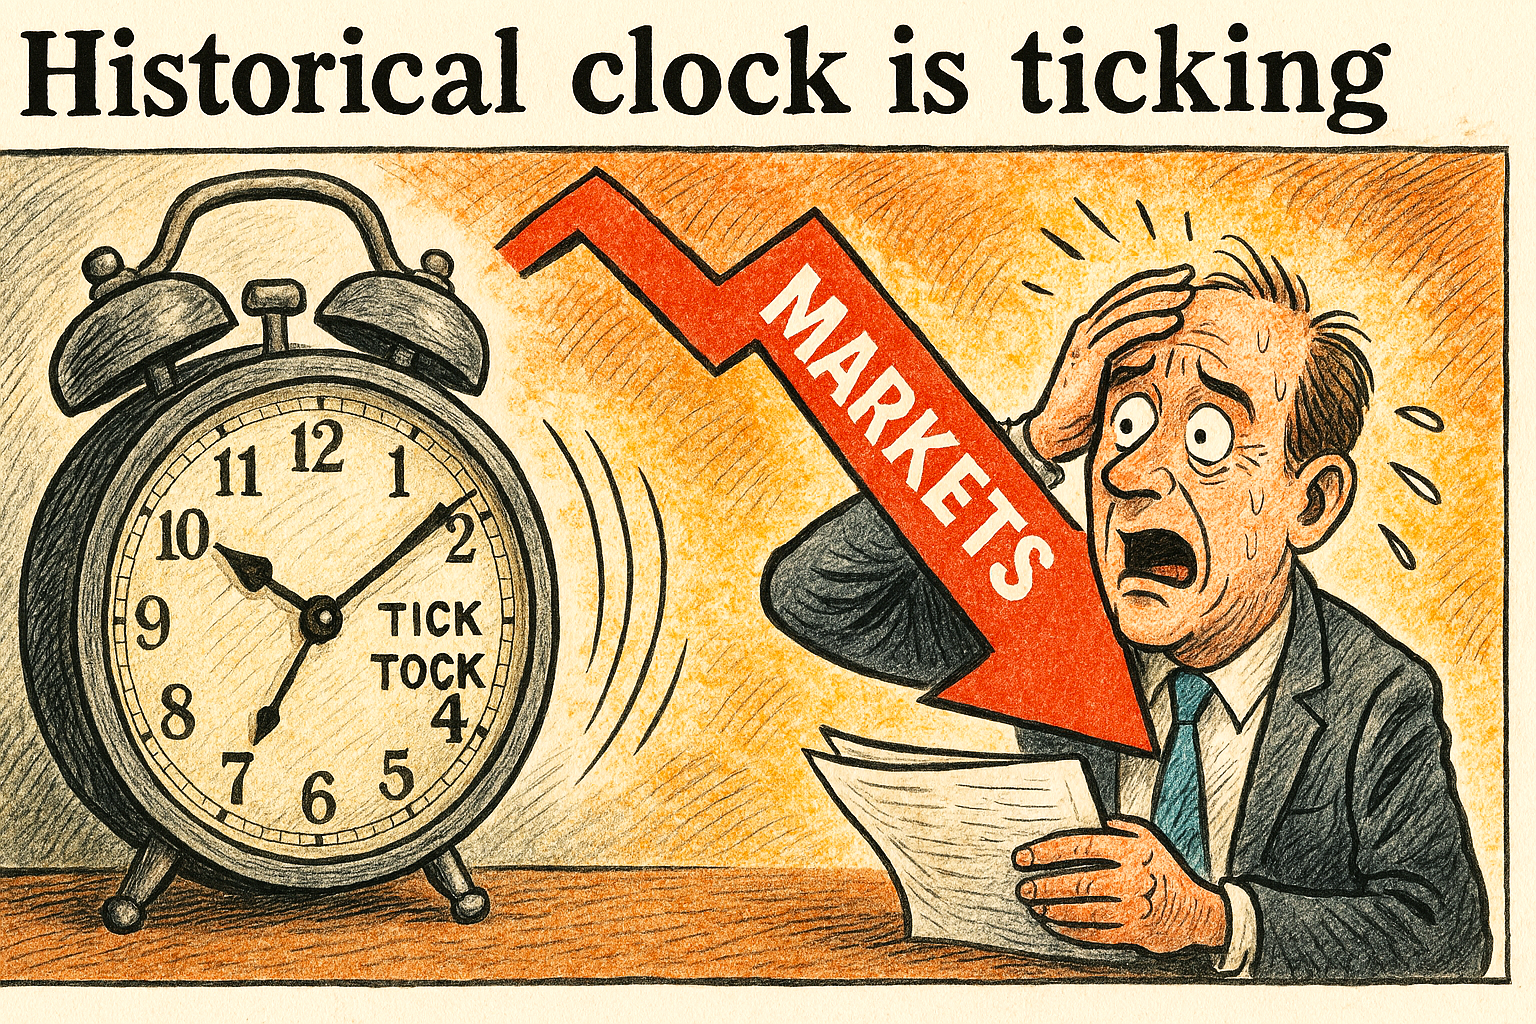
Wall Street’s so-called ‘fear gauge’—officially known as the CBOE Volatility Index (VIX)—has surged to its highest level since April 2025, jolting investors out of a months-long lull and reigniting concerns about market stability.

On 14th October 2025, the VIX briefly spiked above 22.9 before settling near 19.70, a sharp rise from recent lows that had hovered below 14.

The VIX is a real-time market index that reflects investors’ expectations for volatility over the next 30 days. Often dubbed the ‘fear gauge’, it’s derived from S&P 500 options pricing and tends to rise when traders seek protection against sharp market declines.

CBOE (VIX Index) slowly creeping up again October 2025 – So called Fear Index

A reading above 20 typically signals heightened anxiety and increased demand for hedging strategies.

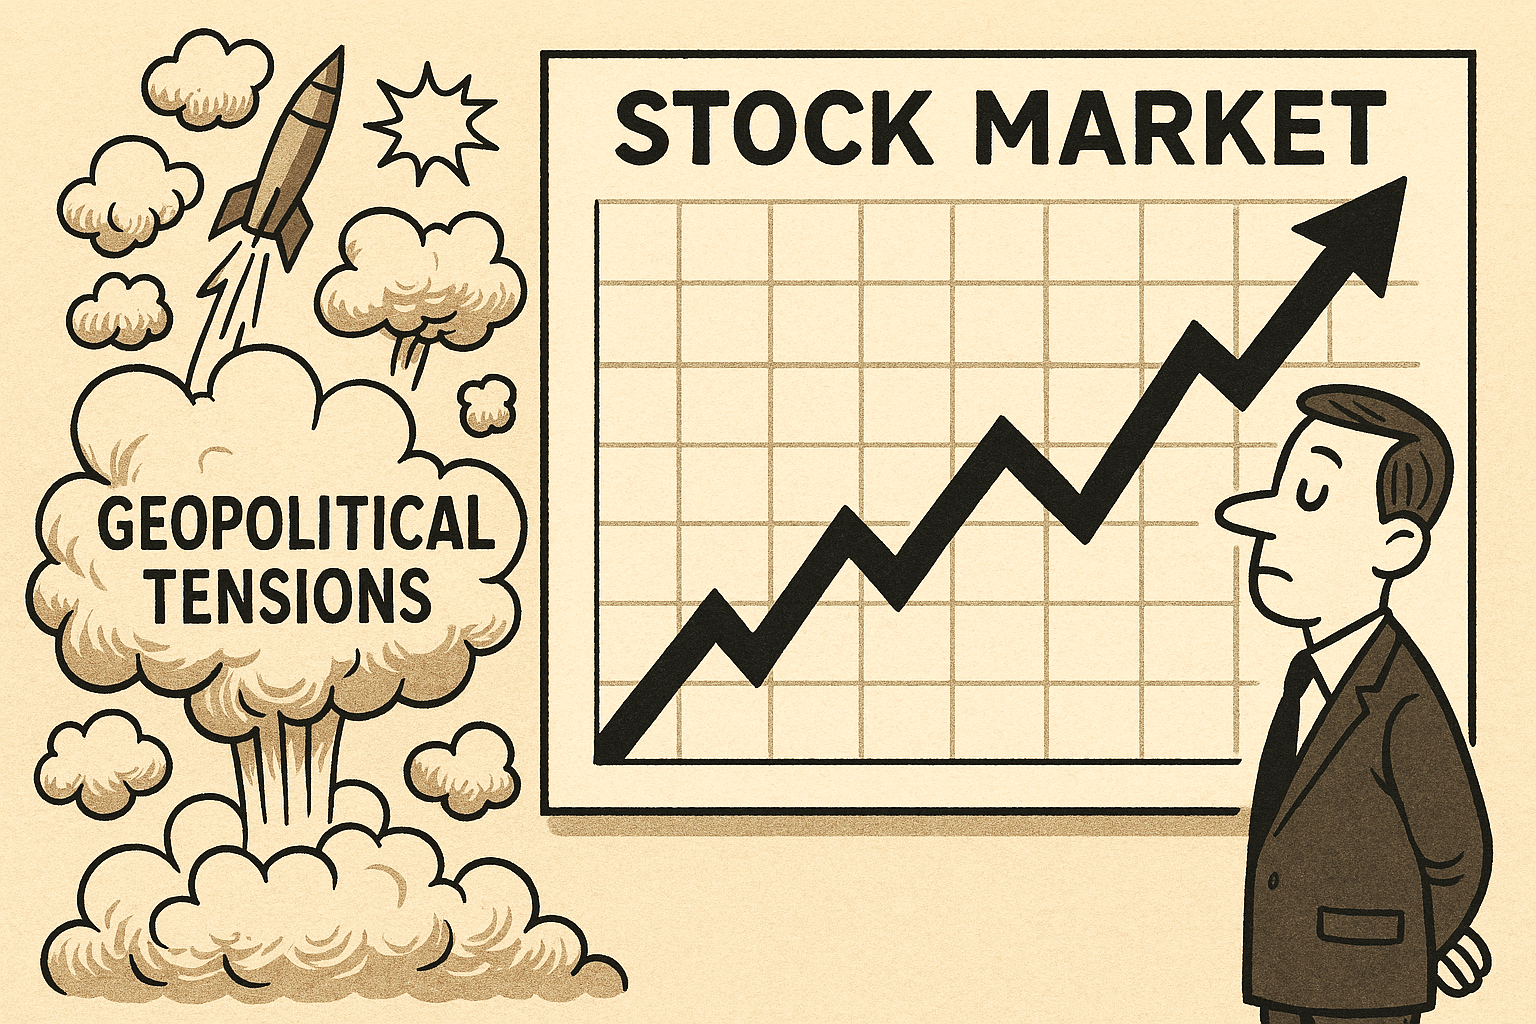
This latest spike was triggered by renewed tensions between the U.S. and China, including Beijing’s announcement of sanctions against American subsidiaries of South Korean shipbuilder Hanwha Ocean.

The move, widely seen as retaliation for Washington’s export controls, sent shockwaves through tech-heavy indices. The Dow dropped over 500 points, while the Nasdaq slid nearly 2%.

For months, markets had basked in a rare stretch of calm, buoyed by AI-driven optimism and resilient earnings. But the VIX’s resurgence suggests that investors are now recalibrating their risk assessments.

It’s not just about trade wars—concerns over interest rates, geopolitical instability, and tech sector overvaluation are converging.

While a rising VIX doesn’t guarantee a crash, it often precedes periods of turbulence. For editorial observers, it’s a symbolic pulse check on investor psychology—a reminder that beneath euphoric rallies, fear never fully disappears.

As Wall Street braces for further shocks, the fear gauge is once again flashing caution. Whether it’s a tremor or a tremor before the quake remains to be seen.

Markets on a Hair Trigger: Trump’s Tariff Whiplash and the AI Bubble That Won’t Pop

Markets move as Trump tweets

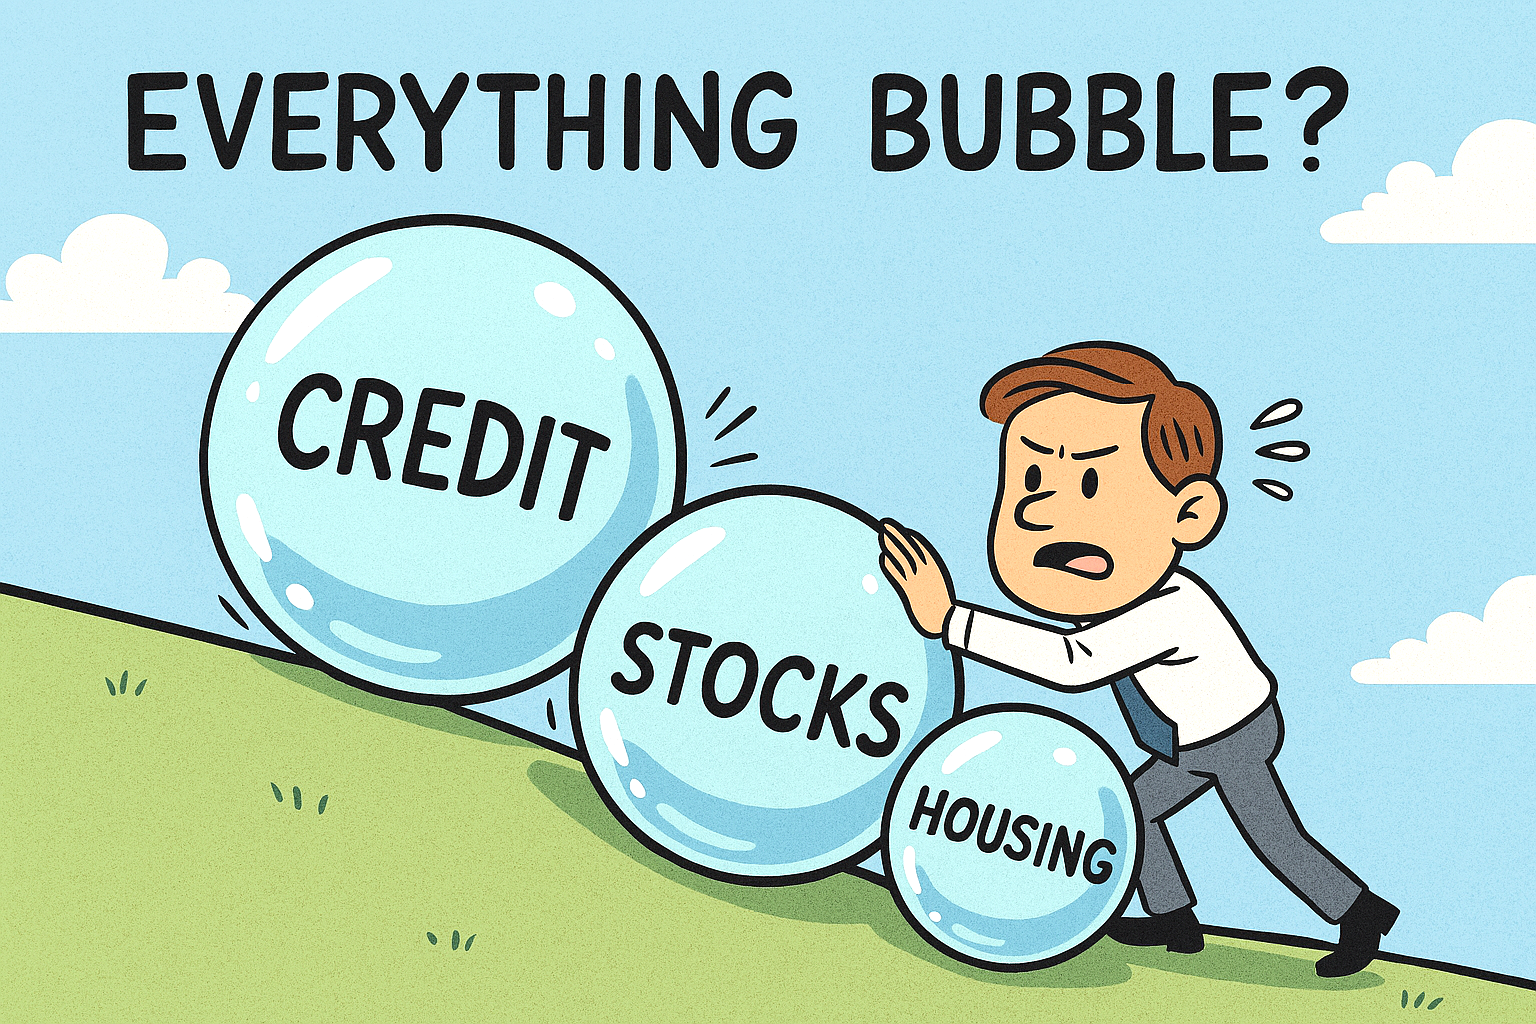
U.S. stock markets are behaving like a mood ring in a thunderstorm—volatile, reactive, and oddly sentimental.

One moment, President Trump threatens a ‘massive increase’ in tariffs on Chinese imports, and nearly $2 trillion in market value evaporates.

The next, he posts that: ‘all will be fine‘, and futures rebound overnight. It’s not just policy—it’s theatre, and Wall Street is watching every act with bated breath.

This hypersensitivity isn’t new, but it’s been amplified by the precarious state of global trade and the towering expectations placed on artificial intelligence.

Trump’s recent comments about China’s rare earth export controls triggered a sell-off that saw the Nasdaq drop 3.6% and the S&P 500 fall 2.7%—the worst single-day performance since April.

Tech stocks, especially those reliant on semiconductors and AI infrastructure, were hit hardest. Nvidia alone lost nearly 5%.

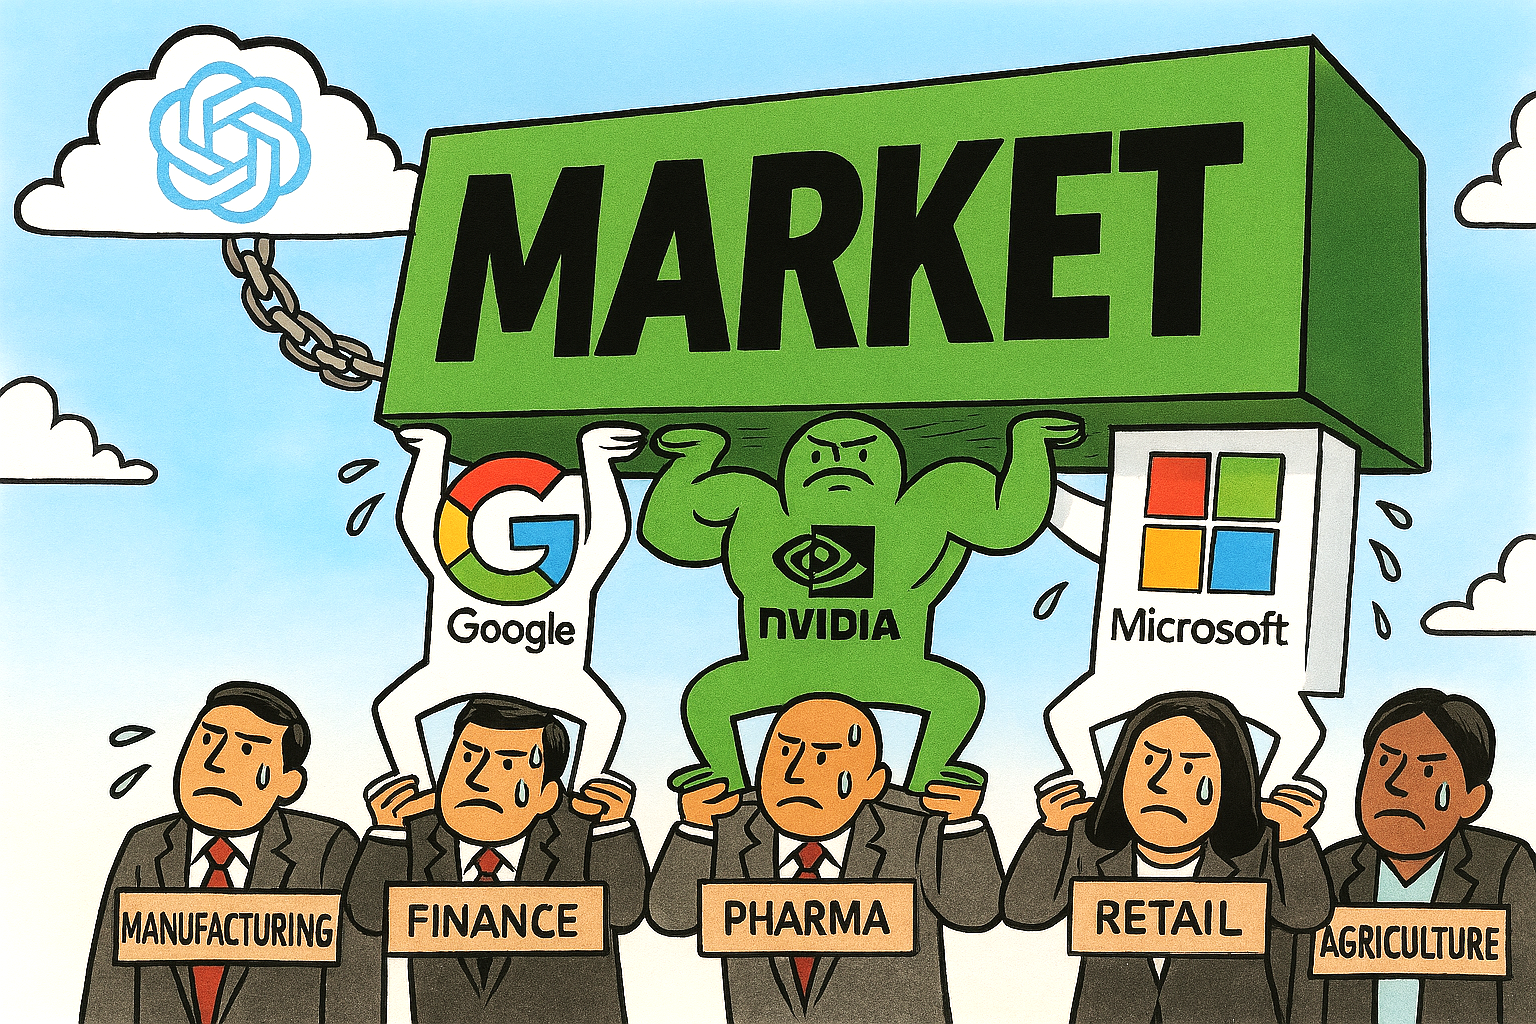
Why so fickle? Because the market’s current rally is built on a foundation of hope and hype. AI has been the engine driving valuations to record highs, with companies like OpenAI and Anthropic reaching eye-watering valuations despite uncertain profitability.

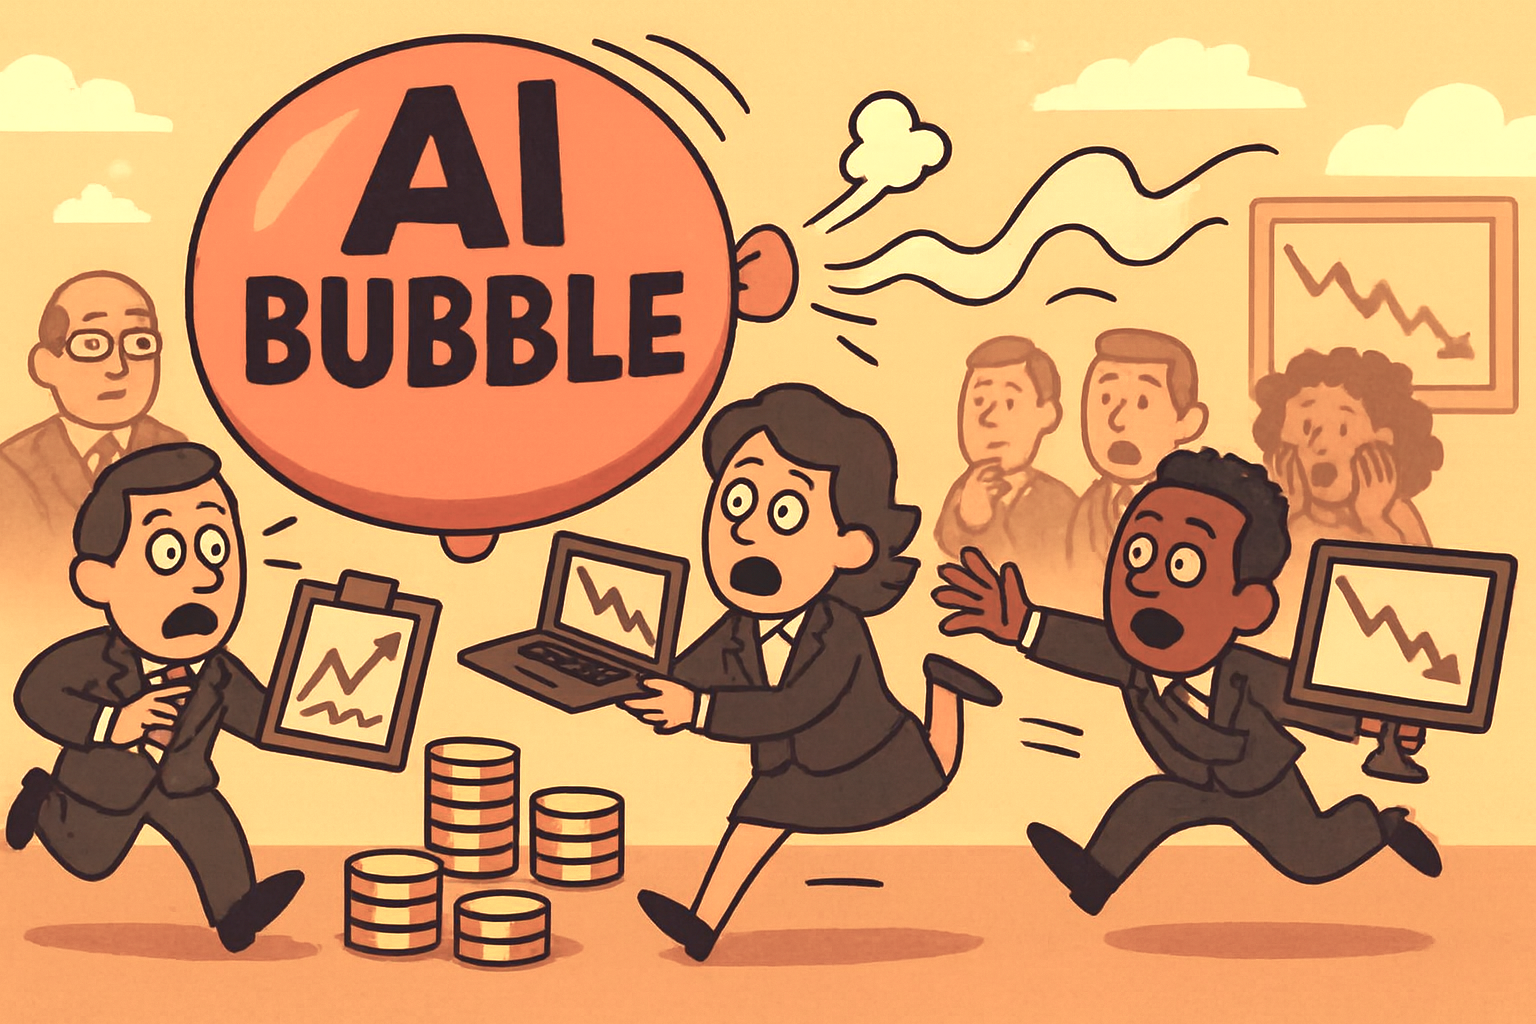
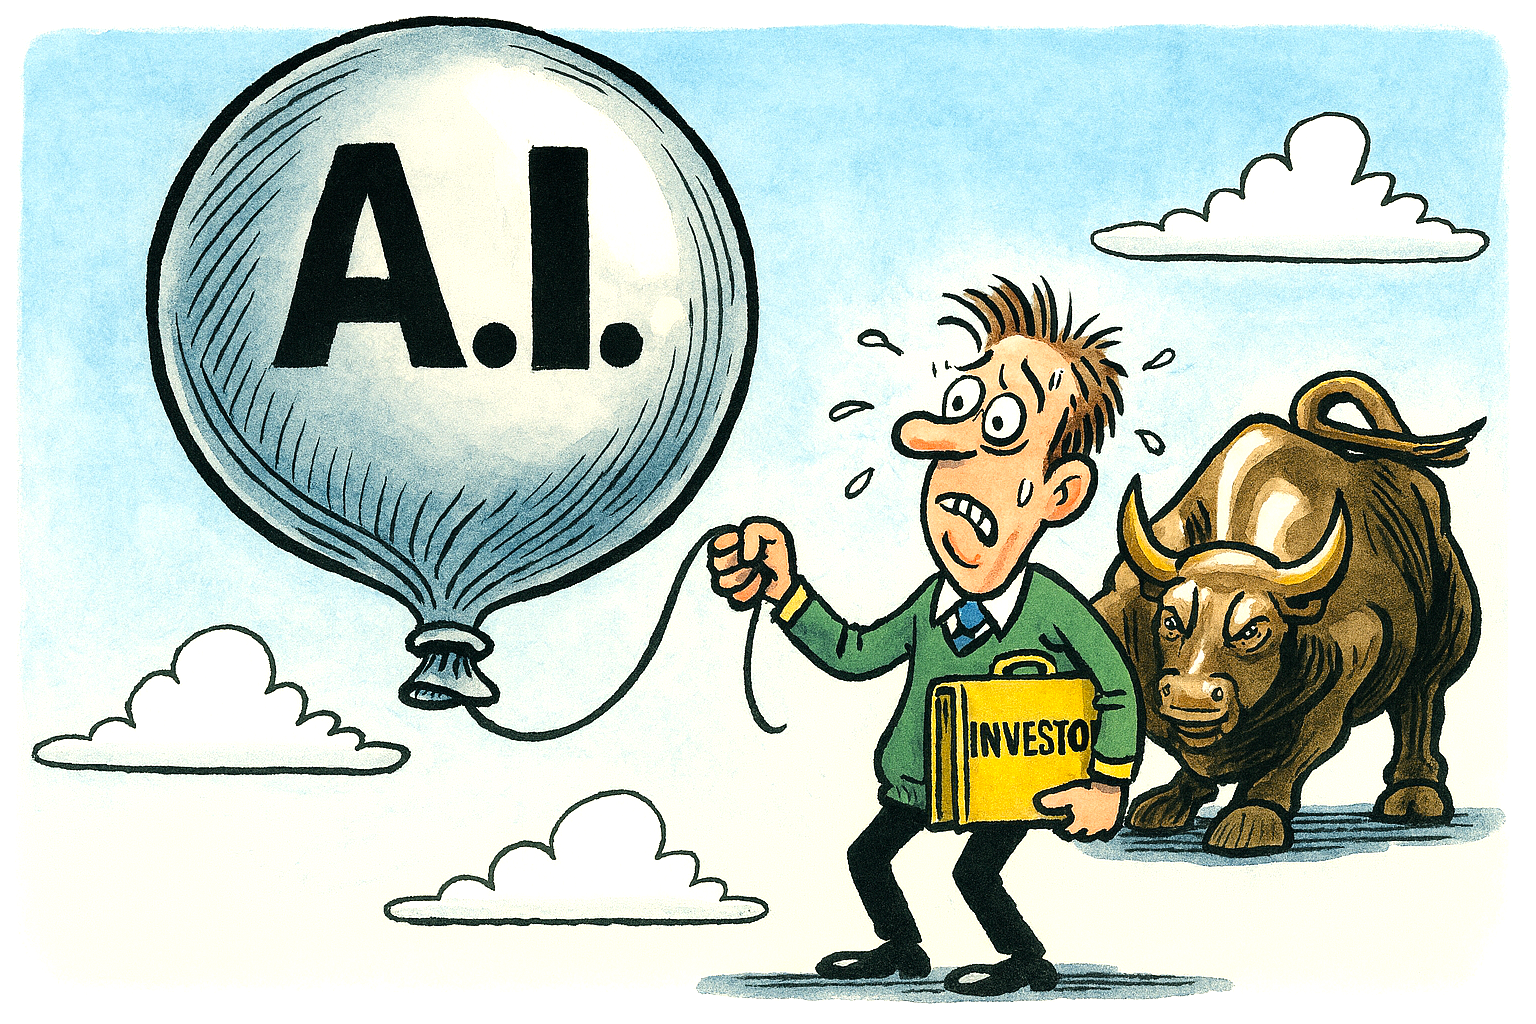
The IMF and Bank of England have both warned that we may be in stage three of a classic bubble cycle6. Circular investment deals—where AI startups use funding to buy chips from their investors—have raised eyebrows and comparisons to the dot-com era.

Yet, the bubble hasn’t burst. Not yet. The ‘Buffett Indicator‘ sits at a historic 220%, and the S&P 500 trades at 188% of U.S. GDP. These are not numbers grounded in sober fundamentals—they’re fuelled by speculative fervour and a fear of missing out (FOMO).

But unlike the dot-com crash, today’s AI surge is backed by real infrastructure: data centres, chip fabrication, and enterprise adoption. Whether that’s enough to justify the valuations remains to be seen.

In the meantime, markets remain twitchy. Trump’s tariff threats are more than political posturing—they’re economic tremors that ripple through supply chains and investor sentiment.

And with AI valuations stretched to breaking point, even a modest correction could trigger a cascade.

So yes, the market is fickle. But it’s not irrational—it’s just balancing on a knife’s edge between technological optimism and geopolitical anxiety.

One tweet can tip the scales.

Fickle!

China’s rare Earth clampdown continues to send shockwaves through global markets

Rare Earth Materials

China’s latest tightening of rare earth exports has reignited global concerns over supply chain fragility and strategic resource dependence.

With Beijing now requiring special permits for the export of key rare earth elements—used in everything from electric vehicles to missile guidance systems—the move is widely seen as a geopolitical lever in an increasingly fractured global trade landscape.

Rare earths, despite their name, are not scarce—but China controls over 60% of global production and an even larger share of refining capacity. The new restrictions, framed as national security measures, have already begun to ripple through equity markets.

Shares of Western mining firms such as Albemarle and MP Materials surged on the news, as investors bet on alternative sources gaining traction. Meanwhile, defence and tech stocks in Europe dipped, reflecting fears of supply bottlenecks and rising input costs1.

This isn’t China’s first foray into rare earth brinkmanship. Similar curbs in 2010 triggered a scramble for diversification, but progress has been slow.

The current squeeze coincides with rising tensions over semiconductor access and military technology, suggesting a broader strategy of resource weaponisation.

For investors, the message is clear: rare earths are no longer just a niche commodity—they’re a geopolitical flashpoint. Expect increased volatility in sectors reliant on high-performance magnets, batteries, and advanced optics.

Countries like the US, Australia, and Canada are accelerating domestic mining initiatives, but scaling up remains a long-term play.

In the short term, China’s grip on rare earths is tightening—and markets are reacting accordingly.

As the global economy pivots toward electrification and AI-driven infrastructure, the battle over these elemental building blocks is only just beginning. The stocks may rise and fall, but the strategic stakes are climbing ever higher.

China’s sweeping export restrictions on rare earths have triggered a sharp rally in related stocks, especially among U.S.-based producers and processors.

The market is interpreting Beijing’s move as both a supply threat and a strategic opportunity for non-Chinese firms to gain ground.

📈 Some companies in the spotlight

  • USA Rare Earth surged nearly 15% in a single day and is up 94% over the past five weeks, buoyed by speculation of a potential U.S. government investment and its vertically integrated magnet production pipeline.
  • NioCorp Developments, Ramaco Resources, and Energy Fuels all posted gains of approximately between 9–12%.
  • MP Materials, the largest U.S. rare earth miner, rose over 6% following news of tighter Chinese controls. The company recently secured a strategic equity deal with the U.S. Department of Defence.
  • Albemarle, Lithium Americas, and Trilogy Metals also saw modest gains, reflecting broader investor interest in critical mineral plays.
Company / SectorStock MovementStrategic Note
MP Materials (US)↑ +6%DoD-backed, key US supplier
USA Rare Earth↑ +15%Magnet pipeline, gov’t investment buzz
NioCorp / Ramaco / Energy Fuels↑ +9–12%Domestic mining surge
European Defence Stocks↓ 2–4%Supply chain fears
Chinese Magnet Producers↔ / ↓Export permit uncertainty

China’s new rules, effective December 1st, require export licences for any product containing more than 0.1% rare earths or using Chinese refining or magnet recycling tech. This has intensified scrutiny on global supply chains and elevated the strategic value of domestic alternatives.

🧭 Investor sentiment is shifting toward companies that can offer secure, non-Chinese sources of rare earths—especially those with downstream capabilities like magnet manufacturing. The rally suggests markets are pricing in long-term geopolitical risk and potential government backing.

Weekend update

Is President Trump in control of the stock market? A comment on TruthSocial suggesting that more China tariffs might be introduced in response to China’s restrictions on rare earth materials reportedly wipes out around $2 trillion from U.S. stocks.

Then it reverses as Trump says, ‘All will be fine’. Stocks climb back up. What’s going on?

It’s just a game.

But who is the game master?

AI Crash! Correction or pullback? Something is coming…

AI Bubble concerns

Influential figures and institutions are sounding the AI alarm—or at least raising eyebrows—about the frothy valuations and speculative fervour surrounding artificial intelligence.

Who’s Warning About the AI Bubble?

🏛️ Bank of England – Financial Policy Committee

  • View: Stark warning.
  • Quote: “The risk of a sharp market correction has increased.”
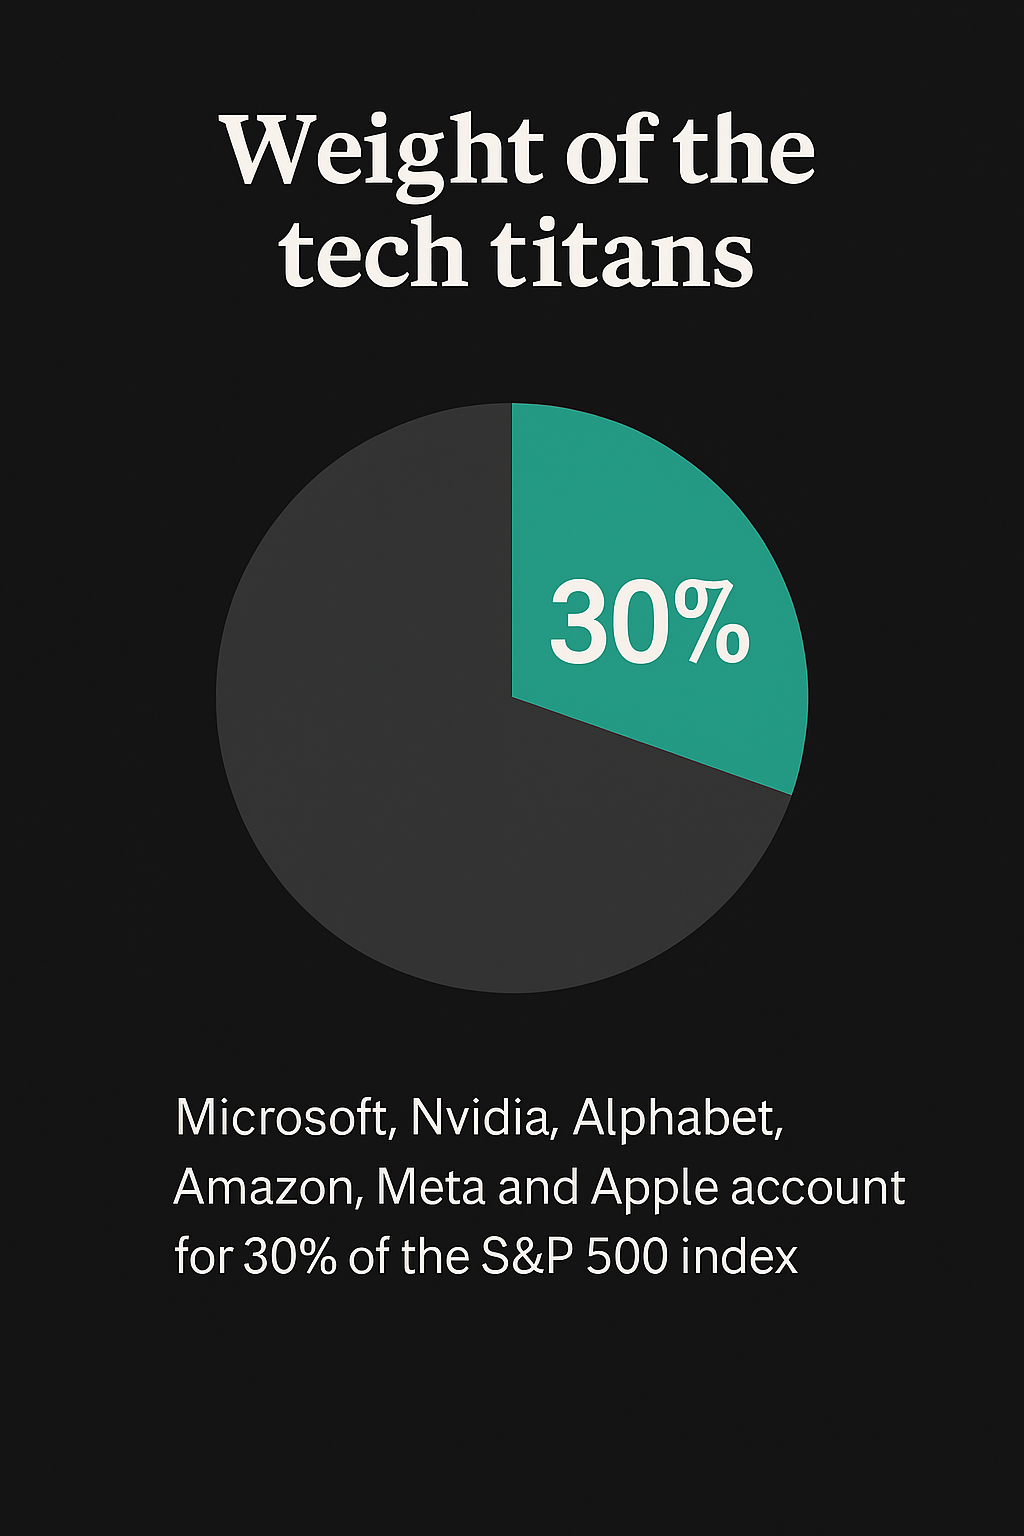
  • Why it matters: The BoE compares current AI stock valuations to the dotcom bubble, noting that the top five S&P 500 firms now command nearly 30% of market cap—the highest concentration in 50 years.

🏦 Jerome Powell – Chair, U.S. Federal Reserve

  • View: Cautiously sceptical.
  • Quote: Assets are “fairly highly valued.”
  • Why it matters: While not naming AI directly, Powell’s remarks echo broader concerns about tech valuations and investor exuberance.

🧮 Lisa Shalett – Chief Investment Officer, Morgan Stanley Wealth Management

  • View: Deeply concerned.
  • Quote: “This is not going to be pretty” if AI capital expenditure disappoints.
  • Why it matters: Shalett warns that 75% of S&P 500 returns are tied to AI hype, likening the moment to the “Cisco cliff” of the early 2000s.

🌍 Kristalina Georgieva – Managing Director, IMF

  • View: Watchful.
  • Quote: Financial conditions could “turn abruptly.”
  • Why it matters: Georgieva highlights the fragility of markets despite AI’s productivity promise, warning of sudden sentiment shifts.

🧨 Sam Altman – CEO, OpenAI

  • View: Self-aware caution.
  • Quote: “People will overinvest and lose money.”
  • Why it matters: Altman’s admission from inside the AI gold rush adds credibility to bubble concerns—even as his company fuels the hype.

📦 Jeff Bezos – Founder, Amazon

  • View: Bubble-aware.
  • Quote: Described the current environment as “kind of an industrial bubble.”
  • Why it matters: Bezos sees parallels with past tech manias, suggesting that infrastructure spending may be overextended.

🧠 Adam Slater – Lead Economist, Oxford Economics

  • View: Analytical.
  • Quote: “There are a few potential symptoms of a bubble.”
  • Why it matters: Slater points to stretched valuations and extreme optimism, noting that productivity projections vary wildly.

🏛️ Goldman Sachs – Investment Strategy Division

  • View: Cautiously optimistic.
  • Quote: “A bubble has not yet formed,” but investors should “diversify.”
  • Why it matters: Goldman acknowledges the risks while maintaining that fundamentals may still justify valuations—though they advise caution.
AI Bubble voices infographic October 2025

🧠 Julius Černiauskas and the Oxylabs AI/ML Advisory Board

🔍 View: The AI hype is nearing its peak—and may soon deflate.

  • Černiauskas warns that AI development is straining environmental resources and public trust. He’s pushing for responsible and sustainable AI practices, noting that transparency is lacking in how many models operate.
  • Ali Chaudhry, research fellow at UCL and founder of ResearchPal, adds that scaling laws are showing their limits. He predicts diminishing returns from simply making models bigger, and expects tightened regulations around generative AI in 2025.
  • Adi Andrei, cofounder of Technosophics, goes further: he believes the Gen AI bubble is on the verge of bursting, citing overinvestment and unmet expectations

🧠 Jamie Dimon on the AI Bubble

🔥 View: Sharply concerned—more than most as widely reported

  • Quote: “I’m far more worried than others about the prospects of a downturn.”
  • Context: Dimon believes AI stock valuations are “stretched” and compares the current surge to the dotcom bubble of the late 1990s.

📉 Key Warnings from Dimon

  • “Sharp correction” risk: He sees a real danger of a sudden market pullback, especially given how AI-related stocks have surged disproportionately—like AMD jumping 24% in a single day after an OpenAI deal.
  • “Most people involved won’t do well”: Dimon told the BBC that while AI will ultimately pay off—like cars and TVs did—many investors will lose money along the way.
  • “Governments are distracted”: He criticised policymakers for focusing on crypto and ignoring real security threats, saying: “We should be stockpiling bullets, guns and bombs”.
  • AI will disrupt jobs and companies”: At a trade event in Dublin, he warned that AI’s ubiquity will shake up industries and employment across the board.

And so…

The AI boom of 2025 has ignited a speculative frenzy across global markets, with tech stocks soaring and investors piling into anything labelled “AI-adjacent.”

But beneath the euphoria, a chorus of high-profile warnings is growing louder. From the Bank of England and IMF to JPMorgan’s Jamie Dimon and OpenAI’s Sam Altman, concerns are mounting that valuations are dangerously stretched, capital is overconcentrated, and the narrative is outpacing reality.

Dimon likens the moment to the dotcom bubble, while Altman admits many will “lose money” chasing the hype. Analysts point to classic bubble signals: retail mania, corporate FOMO, and earnings divorced from fundamentals.

Even as AI’s long-term utility remains promising, the short-term exuberance may be setting the stage for a sharp correction.

Whether it’s a pullback or a full-blown crash, the mood is shifting—from uncritical optimism to wary anticipation.

The question now is not whether AI will change the world, but whether markets have priced in too much, too soon.

We have been warned!

The AI bubble will pop – it’s just a matter of when and not if.

Go lock up your investments!

Bulls and Bubbles: The stock market euphoria

Bubbles and Bulls

In the world of stock markets, few phenomena are as captivating—or as perilous—as bull runs and speculative bubbles.

Though often conflated, these two forces represent distinct psychological and financial dynamics that shape investor behaviour and market outcomes.

Bull Markets: Confidence with Momentum

A bull market is defined by sustained price increases across major indices. Typically driven by strong economic fundamentals, corporate earnings growth, and investor optimism.

In the U.S., iconic bull runs include the post-World War II expansion. The 1980s Reagan-era boom, and the tech-fuelled rally of the 2010s. The Dot-Com bull run, and subsequesnt crash is probably the most famous.

Bull markets feed on confidence: low interest rates, rising employment, and technological innovation often act as catalysts. Investors pile in, believing the upward trajectory will continue—sometimes for years.

But even bulls can lose their footing. When valuations stretch beyond reasonable earnings expectations, the line between bullish enthusiasm and irrational exuberance begins to blur.

Bubbles: Euphoria Untethered from Reality

A bubble occurs when asset prices inflate far beyond their intrinsic value. This is fuelled not by fundamentals but by speculation and herd mentality.

The dot-com bubble of the late 1990s is a textbook example. Companies with no profits—or even products—saw their valuations soar simply for having ‘.com’ in their name.

Similarly, the U.S. housing bubble of the mid-2000s was driven by easy credit and the belief that property prices could only go up.

Bubbles often follow a predictable arc: stealth accumulation, media attention, public enthusiasm, and finally, a euphoric peak.

When reality sets in—be it through disappointing earnings, regulatory shifts, or macroeconomic shocks—the bubble bursts! Leaving behind financial wreckage and a trail of disillusioned investors.

Spotting the Difference

While bull markets can be healthy and sustainable, bubbles are inherently unstable. The key distinction lies in valuation discipline.

Bulls are supported by earnings and growth; bubbles are driven by hype and fear of missing out (FOMO).

Tools like the cyclically adjusted price-to-earnings (CAPE) ratio and historical trend analysis can help investors discern whether they’re riding a bull or inflating a bubble.

📉 The Aftermath and Opportunity Ironically, the collapse of a bubble often sows the seeds for the next bull market. As excesses are purged and valuations reset, long-term investors find opportunities in the rubble.

The challenge lies in resisting the emotional extremes—greed during the rise, panic during the fall—and maintaining a clear-eyed view of value.

In markets, as in life, not every rise is rational, and not every fall is fatal

As of October 2025, many analysts argue that the U.S. stock market is exhibiting classic signs of a bubble. Valuations stretched across major indices and speculative behaviour intensifying—particularly in mega-cap tech stocks and passive index funds.

The S&P 500 recently hit record highs despite a backdrop of political gridlock and a government shutdown. This suggests a disconnect between price momentum and underlying economic risks.

Indicators like Market Cap to Gross Value Added (GVA) and excessive investor sentiment point to a speculative mania. Some experts are calling it the largest asset bubble in U.S. history.

While a full-blown crash hasn’t materialised yet, the market’s frothy conditions and historical October volatility have many bracing for a potential correction.

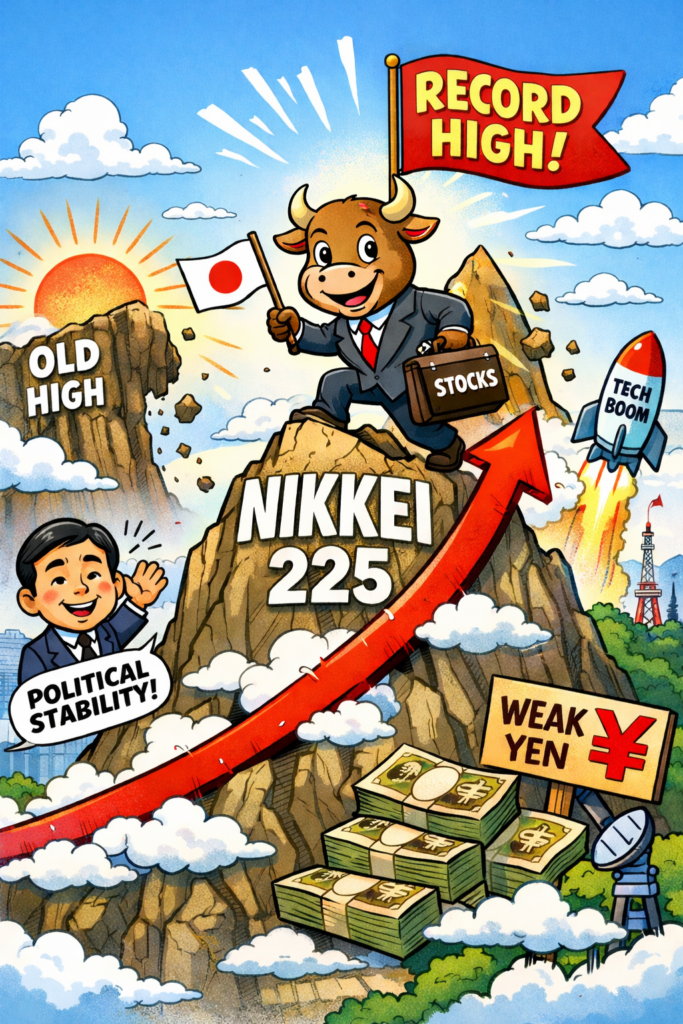
Nikkei hit another new all-time high!

Nikkei 225 hits new high!

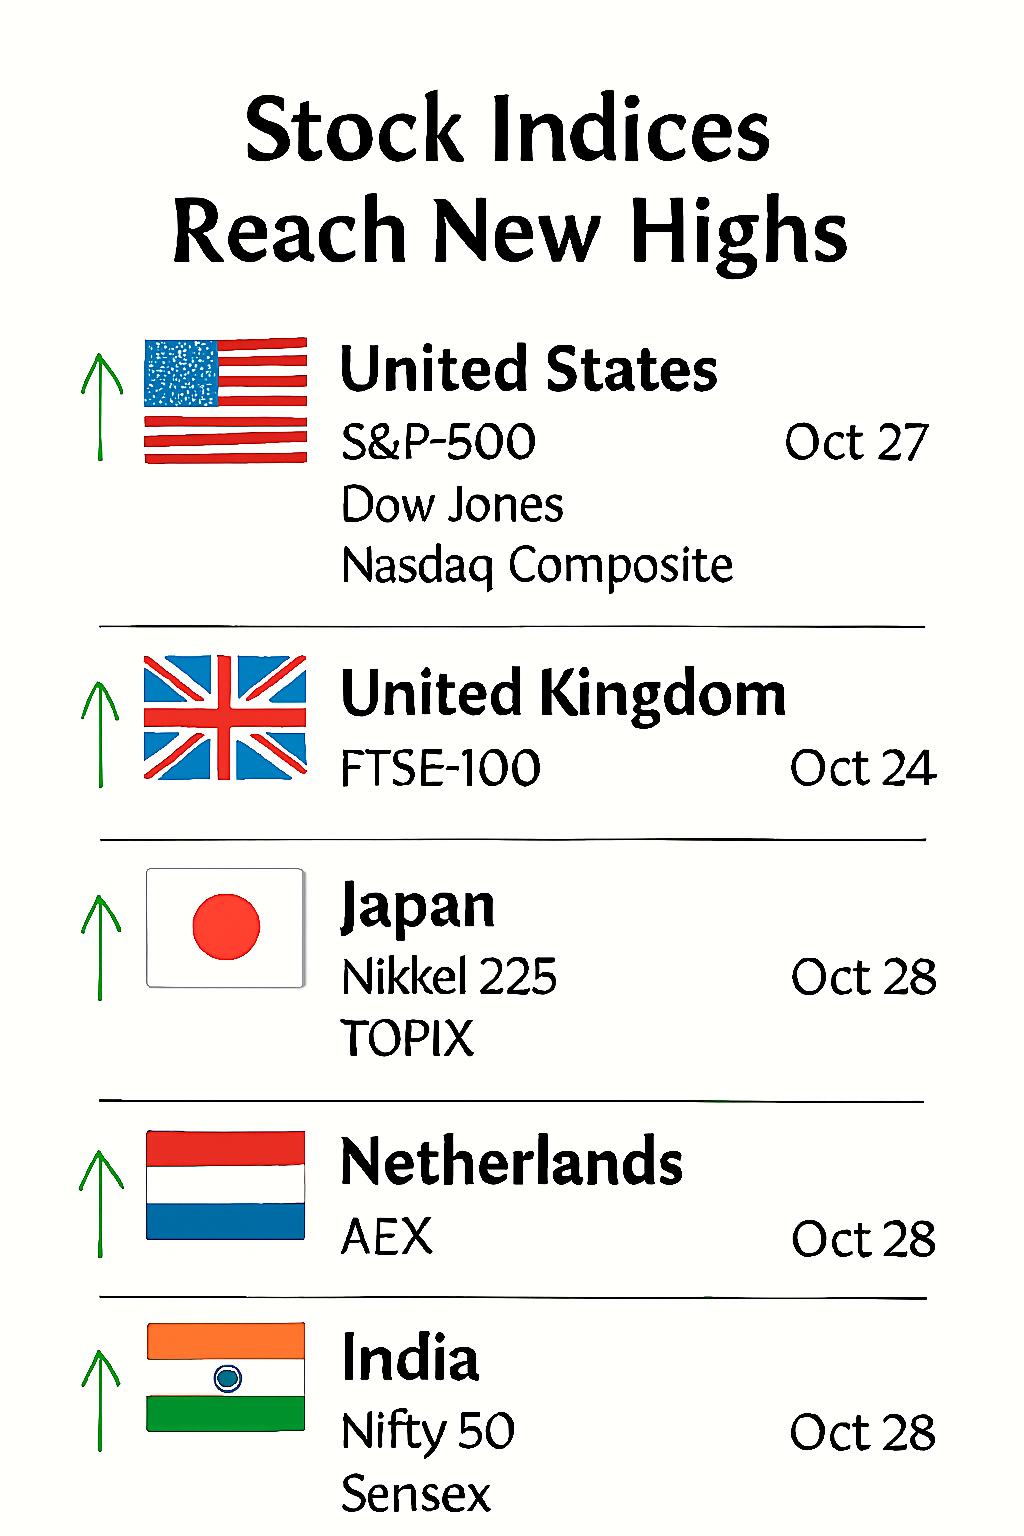
Japan’s Nikkei 225 hit another record high on October 7th 2025 for the second consecutive session. Intraday trading saw the Nikkei rip through 40,500.

The rally was driven by a tech-fueled surge, especially after a landmark deal between OpenAI and AMD sent shockwaves through global markets.

Nikkei 225 one-day chart 7th October 2025

AMD’s stock soared nearly 24%, challenging Nvidia’s dominance and lifting chip-related stocks in Tokyo like Advantest, Tokyo Electron, and Renesas Electronics.

The backdrop’s fascinating too: this optimism comes amid political upheaval in Japan, with Sanae Takaichi’s recent rise to LDP leadership sparking hopes of fresh fiscal stimulus.

However, on a cautionary note: Japan’s bond market is flashing warning signs—yields are spiking to levels not seen since 2008

Nikkei surges past 48,000 as Japan embraces political shift

Nikkei index surges to record high!

Japan’s benchmark Nikkei 225 index soared past the symbolic 48,000 mark on Monday 6th October 2025 in intraday trading, marking a new all-time high and underscoring investor confidence in the country’s shifting political landscape.

The index closed at 47944.76, up approximately 4.15% from Friday’s session, driven by a wave of optimism surrounding the Liberal Democratic Party’s leadership transition.

Nikkei 225 smashes to new record high October 6th 2025

Sanae Takaichi, a staunch conservative with deep ties to former Prime Minister Shinzo Abe, has emerged as the frontrunner to lead the party—and potentially become Japan’s first female prime minister.

Her pro-growth stance, admiration for Margaret Thatcher, and commitment to industrial revitalisation have sparked hopes of continued economic liberalisation.

The yen weakened boosting export-heavy sectors such as automotive and electronics. Toyota and Sony led the charge, with gains of 5.1% and 4.8% respectively.

Analysts also pointed to easing U.S. bond yields and a rebound on Wall Street as contributing factors.

While the rally reflects renewed market enthusiasm, it also raises questions about Japan’s long-term structural challenges—from demographic decline to mounting public debt.

For now, however, the Nikkei’s ascent offers a potent symbol of investor faith in Japan’s evolving political and economic narrative.

Is the resilient stock market keeping the U.S. economy out of a recession and if so – is that a bad thing?

U.S. recession looming?

The Resilient Stock Market: A Double-Edged Shield Against Recession

In a year marked by political volatility, Trumps tariff war, soft labour data, and persistent inflation anxieties, one pillar of the economy has stood tall: the stock market.

Defying expectations, major indices like the Nasdaq, Dow Jones and S&P 500 have surged, buoyed by AI-driven optimism and industrial strength. This resilience has helped stave off a technical recession—but not without raising deeper concerns about economic fragility and inequality.

At the heart of this phenomenon lies the ‘wealth effect’. As equity portfolios swell, high-net-worth households feel richer and spend more freely.

This consumer activity props up GDP figures and masks underlying weaknesses in wage growth, job creation, and productivity.

August’s economic data showed surprising strength in consumer spending and housing, despite lacklustre employment figures and fading stimulus support.

But here’s the rub: this buoyancy is not broadly shared. According to the University of Michigan’s sentiment index, confidence has declined sharply since January, especially among those without significant stock holdings.

Balance

The U.S. economy, in effect, is being held aloft by a narrow slice of the population—those with the means to benefit from rising asset prices. For everyone else, the recovery feels distant, even illusory.

This divergence creates a dangerous illusion of stability. Policymakers may hesitate to intervene—whether through fiscal support or monetary easing—because headline indicators look healthy. Yet beneath the surface, vulnerabilities abound.

If the market were to correct sharply, the spending it fuels could evaporate overnight, exposing the economy’s dependence on asset inflation.

Moreover, the market’s resilience may be distorting capital allocation. Companies flush with investor cash are prioritising stock buybacks and speculative ventures over wage growth or long-term investment. This can exacerbate inequality and erode the foundations of sustainable growth.

In short, while the stock market’s strength has delayed a recession, it has also deepened the disconnect between Wall Street and Main Street.

The danger lies not in the market’s success, but in mistaking it for economic health. A resilient market may be a shield—but it’s not a cure. And if that shield cracks, the consequences could be swift and severe.

The challenge now is to look beyond the indices and ask harder questions: Who is benefitting? What are we neglecting?

And how do we build an economy that’s resilient not just in numbers, but in substance, regardless of nation.

Wall Street’s euphoric surge sparks warnings of imminent pullback

Wall Street market warning!

Despite a backdrop of economic uncertainty and a partial government shutdown, Wall Street’s three major indices—the S&P 500, Nasdaq Composite, and Dow Jones Industrial Average—closed at record highs on Thursday 2nd October 2025, fuelling concerns that investor confidence may be tipping into excess.

The S&P 500 edged up 0.06%, continuing its relentless climb, while the Nasdaq and Dow Jones followed suit, buoyed by gains in tech giants like Nvidia and Intel.

Nvidia, now the world’s most valuable company, hit an all-time high, and Intel surged over 50% in the past month thanks to strategic partnerships.

Yet beneath the surface of this bullish momentum, market analysts are sounding the alarm. Sector rotation data from the S&P 500 reveals a concentration of capital in high-growth tech and consumer discretionary stocks, suggesting a narrowing rally.

This kind of sector skew often precedes a correction, as it reflects overconfidence in a few outperformers while broader market fundamentals remain shaky.

Triple High, Thin Ice: Wall Street’s record rally masks sector fragility and looming potential pullback

Adding to the unease is the state of the U.S. labour market. Hiring is down 58% year-to-date compared to 2024, marking the lowest level since 2009.

Although the jobless rate remains stable at 4.34%, the Chicago Fed’s indicators reportedly paint a picture of an economy that’s ‘low fire, low hire’—a phrase echoed by Federal Reserve Chair Jerome Powell.

Treasury Secretary Scott Bessent warned that the ongoing government shutdown could dent economic growth, but investors appear unfazed.

Some analysts argue that this detachment from macroeconomic risks reflects a dangerous complacency. Fundstrat even reportedly projected the S&P 500 could reach 7,000 by year-end—a bold forecast that, while technically possible, may hinge more on sentiment than substance.

The Nasdaq’s surge has been particularly pronounced, driven by speculative enthusiasm around AI and semiconductor stocks.

Meanwhile, the Dow Jones, traditionally seen as a bellwether for industrial strength, has benefited from defensive plays and dividend-rich stocks, masking underlying fragilities.

In sum, while Thursday’s triple record close is a milestone worth noting, it may also be a warning sign. With sector gauges flashing ‘excessive’ confidence and economic indicators sending mixed signals, investors would do well to temper their optimism.

A pullback may not be imminent, but it’s certainly plausible—and perhaps overdue.

As the bull charges ahead, the question remains: how long can it run before the bear catches up?

Bleak news from U.S. doesn’t seem that bad for stocks – what’s going on?

Bleak Headlines vs. Market Optimism

It’s one of those classic Wall Street paradoxes—where bad news somehow fuels bullish momentum. What’s going on?

News round-up

S&P 500 closes above 6,700 after rising 0.34%. Samsung and SK Hynix join OpenAI’s Stargate. Taiwan rejects U.S. proposal to split chip production. Trump-linked crypto firm plans expansion. Some stocks that doubled in the third quarter.

Bleak Headlines vs. Market Optimism

U.S. Government Shutdown: The federal government ground to a halt, but markets didn’t flinch. In fact, the S&P 500 rose 0.34% and closed above 6,700 for the first time.

ADP Jobs Miss: Private payrolls fell by 32,000 in September 2025, a sharp miss – at least compared to the expected 45,000 gain. Yet traders shrugged it off as other bad news is shrugged off too!

Fed Rate Cut Hopes: Weak data often fuels expectations that the Federal Reserve will cut interest rates. Traders are now betting on a possible cut in October 2025, which tends to boost equities.

Historical Pattern: According to Bank of America, the S&P 500 typically rises ~1% in the week before and after a government shutdown. So, this isn’t unprecedented—it’s almost ritualistic at this point.

Why the Market’s Mood Diverges

Animal Spirits: Investors often trade on sentiment and positioning, not just fundamentals. If they believe the Fed will ease policy, they’ll buy risk assets—even in the face of grim news.

Data Gaps: With the Bureau of Labor Statistics’ official jobs report delayed due to the shutdown, the ADP report gains more weight. But it’s historically less reliable, so traders may discount it.
Tech Tailwinds: AI stocks and semiconductor news (e.g., Samsung and SK Hynix joining OpenAI’s Stargate) are buoying sentiment, especially in Asia-Pacific markets.

U.S. Government Shutdown October 2025

Prediction

Traders in prediction markets are betting the shutdown will last around two weeks. Nothing too radical, since that’s the average length it takes for the government to reopen, based on data going back to 1990.

The government stoppage isn’t putting the brakes on the stock market momentum. Are investors getting too adventurous?

History shows the pattern is not new. The S&P 500 has risen an average of 1% the week before and after a shutdown, according to data from BofA.

Even the ADP jobs report, which missed expectations by a wide margin, did little to subdue the animal spirits.

Private payrolls declined by 32,000 in September 2025, according to ADP, compared with a 45,000 increase reportedly estimated by a survey of economists.

Payroll data

The Bureau of Labor Statistics’ (BLS) official nonfarm payrolls report is now stuck in bureaucratic purgatory and likely not being released on time.

The U.S. Federal Reserve might place additional weight on the ADP report — though it’s not always moved in sync with the BLS numbers. Traders expect weak data would prompt the Fed to cut interest rates in October 2025.

It’s a bit like watching a storm roll in while the crowd cheers for sunshine—markets are forward-looking, and sometimes they see silver linings where others see clouds.

Summary

EventDetail
🏛️ Government ShutdownBegan Oct 1, 2025. Traders expect ~2 weeks based on historical average
📉 ADP Jobs ReportPrivate payrolls fell by 32,000 vs. expected +45,000
📈 S&P 500 CloseRose 0.34% to close above 6,700 for the first time
💸 Fed Rate Cut ExpectationsTraders now pricing in a possible October cut

When will it be time to worry about the AI bubble?

AI bubble inflating

Key Signals of an AI Bubble

Valuations detached from fundamentals When companies with minimal revenue or unclear business models are trading at sky-high valuations purely because they’re ‘AI-adjacent’, surely it’s time to take note.

Overconcentration in a few stocks If market gains are disproportionately driven by a handful of AI giants (think Nvidia, Microsoft and Amazon etc.), it suggests fragility. A stumble by one could ripple across the sector.

Narrative dominance over substance When investor excitement is driven more by buzzwords (‘transformational’, ‘disruptive’, ‘AGI’) than by actual product performance or adoption metrics, the hype may be outpacing reality. But there is real utility in AI if managed carefully.

Corporate FOMO and rushed adoption Companies scrambling to integrate AI without clear ROI or strategic fit—especially when they start cutting staff to “reskill for AI”—can signal unsustainable pressure.

Retail investor mania If you start seeing AI-themed ETFs, TikTok stock tips, and speculative day trading around obscure AI startups, it’s reminiscent of past bubbles like dot-com or crypto.

What to watch for next

  • Earnings vs. expectations: If AI leaders start missing earnings or issuing cautious guidance, sentiment could shift fast.
  • Regulatory headwinds: New rules around data, privacy, or model transparency could reshape the landscape.

Labour market impact: If AI adoption leads to widespread job displacement without productivity gains, the backlash could be swift.

Are We in an AI ‘Super Cycle’? Some investors say Yes—and it could last two decades?

AI

The term ‘AI super cycle’ is gaining traction among top investors, and for good reason.

According to recent commentary from leading venture capitalists, we may be entering a prolonged period of exponential growth in artificial intelligence—one that could reshape industries, economies, and even the nature of work itself.

Unlike previous tech booms, this cycle isn’t driven by a single breakthrough. Instead, it’s the convergence of multiple forces: unprecedented computing power, vast datasets, and increasingly sophisticated models.

From generative AI tools that write code and craft marketing copy, to autonomous systems revolutionising logistics and healthcare, the pace of innovation is staggering.

What makes this cycle ‘super’ isn’t just the technology—it’s the scale of adoption. AI is no longer confined to Silicon Valley labs or niche enterprise solutions.

It’s being embedded into everyday workflows, consumer apps, and national infrastructure. Governments are racing to regulate it, while companies scramble to integrate it before competitors do.

Some analysts believe this cycle could last 20 years, echoing the longevity of the internet era. But unlike the dot-com bubble, AI’s utility is already tangible.

Productivity gains, cost reductions, and creative augmentation are being realised across sectors—from finance and pharmaceuticals to education and entertainment.

Still, the super cycle isn’t without risk. Ethical concerns, data privacy, and algorithmic bias remain unresolved. And as AI systems become more autonomous, questions of accountability and control grow sharper.

Some also suggest the market is ‘frothy’ (including the Fed) and is due a correction or at the very least a pullback.

Yet for now, the momentum is undeniable. Investors are pouring billions into AI startups, chipmakers are scaling up production, and global markets are recalibrating around this new frontier.

If this truly is a super cycle, it’s not just a moment—it’s a movement.

And we’re only at the beginning of the curve

With all the new AI tech arriving in the new AI data centres – what is happening to the old tech it is presumably replacing?

AI - dirty little secret or clean?

🧠 What’s Happening to the Old Tech?

Shadow in the cloud

🔄 Repurposing and Retrofitting

  • Many traditional CPU-centric server farms are being retrofitted to support GPU-heavy or heterogeneous architectures.
  • Some legacy racks are adapted for edge computing, non-AI workloads, or low-latency services that don’t require massive AI computing power.

🧹 Decommissioning and Disposal

  • Obsolete hardware—especially older CPUs and low-density racks—is being decommissioned.
  • Disposal is a growing concern: e-waste regulations are tightening, and sustainability targets mean companies must recycle or repurpose responsibly.

🏭 Secondary Markets and Resale

  • Some older servers are sold into secondary markets—used by smaller firms, educational institutions, or regions with less AI demand.
  • There’s also a niche for refurbished hardware, especially in countries where AI infrastructure is still nascent.

🧊 Cold Storage and Archival Use

  • Legacy systems are sometimes shifted to cold storage roles—archiving data that doesn’t require real-time access.
  • These setups are less power-intensive and can extend the life of older tech without compromising performance.

⚠️ Obsolescence Risk

  • The pace of AI innovation is so fast that even new data centres risk early obsolescence if they’re not designed with future workloads in mind.
  • Rack densities are climbing—from 36kW to 80kW+—and cooling systems are shifting from air to liquid, meaning older infrastructure simply can’t keep up.

🧭 A Symbolic Shift

This isn’t just about servers—it’s about sovereignty, sustainability, and the philosophy of obsolescence. The old tech isn’t just being replaced; it’s being relegated, repurposed, or ritually retired.

There’s a tech history lesson unfolding about digital mortality, and how each new AI cluster buries a generation of silicon ancestors.

Infographic: ‘New’ AI tech replacing ‘Old’ tech in data centres

🌍 The Green Cost of the AI Boom

Energy Consumption

  • AI data centres are power-hungry beasts. In 2023, they consumed around 2% of global electricity—a figure expected to rise by 80% by 2026.
  • Nvidia’s H100 GPUs, widely used for AI workloads, draw 700 watts each. With millions deployed, the cumulative demand is staggering.

💧 Water Usage

  • Cooling these high-density clusters often requires millions of litres of water annually. In drought-prone regions, this is sparking local backlash.

🧱 Material Extraction

  • AI infrastructure depends on critical minerals—lithium, cobalt, rare earths—often mined in ecologically fragile zones.
  • These supply chains are tied to geopolitical tensions and labour exploitation, especially in the Global South.

🗑️ E-Waste and Obsolescence

  • As new AI chips replace older hardware, legacy servers are decommissioned—but not always responsibly.
  • Without strict recycling protocols, this leads to mountains of e-waste, much of which ends up in landfills or exported to countries with lax regulations.

The Cloud Has a Shadow

This isn’t just about silicon—it’s about digital colonialism, resource extraction, and the invisible costs of intelligence. AI may promise smarter sustainability, but its infrastructure is anything but green unless radically reimagined.

⚡ The Energy Cost of Intelligence

🔋 Surging Power Demand

  • AI data centres are projected to drive a 165% increase in global electricity consumption by 2030, compared to 2023 levels.
  • In the U.S. alone, data centres could account for 11–12% of total power demand by 2030—up from 3–4% today.
  • A single hyperscale facility can draw 100 megawatts or more, equivalent to powering 350,000–400,000 electric vehicles annually.
AI and Energy supply

🧠 Why AI Is So Power-Hungry

  • Training large models like OpenAI Chat GPT or DeepSeek requires massive parallel processing, often using thousands of GPUs.
  • Each AI query can consume 10× the energy of a Google search, according to the International Energy Agency.
  • Power density is rising—from 162 kW per square foot today to 176 kW by 2027, meaning more heat, more cooling, and more infrastructure.

🌍 Environmental Fallout

  • Cooling systems often rely on millions of litres of water annually. For example, in Wisconsin, two AI data centres will consume 3.9 gigawatts of power, more than the state’s nuclear plant.
  • Without renewable energy sources, this surge risks locking regions into fossil fuel dependency, raising emissions and household energy costs. We are not ready for this massive increase in AI energy production.

Just how clean is green?

The Intelligence Tax

This isn’t just about tech—it’s about who pays for progress. AI promises smarter cities, medicine, and governance, but its infrastructure demands a hidden tax: on grids, ecosystems, and communities.

AI is a hungry beast, and it needs feeding. The genie is out of the bottle!

Buffett Indicator surges past 200% – raising alarm bells on market valuation

Warren Buffett

The so-called ‘Buffett Indicator’—a stock market valuation metric championed by Warren Buffett—has surged past 200%, reigniting concerns that equities may be dangerously overvalued.

The ratio, which compares the total market capitalisation of U.S. stocks to the country’s gross domestic product (GDP), now sits well above the threshold Buffett once described as “playing with fire”.

Historically, the Buffett Indicator has served as a broad gauge of whether the market is trading at a premium or discount to the underlying economy.

100%

A reading of 100% suggests that the market is fairly valued. But when the ratio climbs significantly above that level, it implies that investor optimism may be outpacing economic fundamentals.

200%

At over 200%, the current reading suggests that the market is valued at more than twice the size of the U.S. economy. This level is not only unprecedented—it’s also well above the peak seen during the dot-com bubble, which ended in a dramatic crash in the early 2000s.

Buffett himself has warned in the past that when the indicator reaches extreme levels, it should serve as a ‘very strong warning signal’. While he has not commented on the current spike, the metric’s ascent has prompted renewed scrutiny from analysts and investors alike.

Some argue that the indicator may be distorted by structural changes in the economy, such as the rise of intangible assets and global revenue streams that aren’t captured by GDP alone.

Others point to low interest rates and persistent liquidity as reasons why valuations have remained elevated.

Do not ignore the warning

Still, the psychological impact of the 200% mark is hard to ignore. It suggests that investors may be pricing in perfection—expecting strong earnings growth, low inflation, and continued central bank support. Any deviation from this ideal scenario could trigger a sharp revaluation.

For long-term investors, the Buffett Indicator’s warning may not signal an immediate crash, but it does suggest caution. Diversification, disciplined risk management, and a clear understanding of valuation metrics are more important than ever.

As markets continue to defy gravity, the Buffett Indicator stands as a quiet sentinel—reminding investors that even the most exuberant rallies are tethered to economic reality. Whether this is a moment of irrational exuberance or a new normal remains to be seen.

But as Buffett once said, ‘The stock market is a device for transferring money from the impatient to the patient’.

It’s just a matter of ‘time’

🔍 How It Works

Formula:

Buffett Indicator=Total MarketCap/GDP

Interpretation:

Below 100%: Market may be undervalued

100%–135%: Fairly valued

Above 135%: Overvalued

Above 200%: Historically considered ‘playing with fire’, according to Buffett himself

🚨 Current Status (as of late September 2025)

The Buffett Indicator has surged to 218%, breaking records set during the Dotcom bubble and the COVID-era rally.

This extreme level suggests that equity values are growing much faster than the economy, raising concerns about a potential market bubble.

The surge is largely driven by mega-cap tech firms investing heavily in AI, which has inflated valuations.

🧠 Why It Matters

Buffett once called this “probably the best single measure of where valuations stand at any given moment.”

While some argue the metric may be outdated due to shifts in the economy (e.g., rise of intangible assets like software and data), it still serves as a powerful warning signal when valuations soar far above GDP.

Stock market pullback in 4th quarter… how likely is it?

Taking Stock

While many investors are hoping for a year-end rally, several analysts are warning that a fourth-quarter pullback remains a real possibility.

Valuation concerns: Large-cap stocks are trading at historically high valuations, reminiscent of the 2021 peak. That leaves little room for error if economic data disappoints.

Tariff aftershocks: April’s ‘Liberation Day’ tariffs triggered a sharp sell-off, and although markets rebounded, strategists at Stifel expect an ‘echo’ effect—potentially a 14% drop in the S&P 500 before year-end.

Economic slowdown: Consumer spending is showing signs of strain, and real wage growth may not keep pace with rising prices. That could dampen demand and corporate earnings.

Trade uncertainty: The 90-day tariff pause expired in July 2025 (with adjustments), leaving markets to navigate the fallout—valuation echoes, trade uncertainty, and investor psychology now collide in Q4’s shadow. This could lead to headline-driven volatility through Q4.

Mixed sentiment: Some strategists remain cautiously optimistic, citing resilient labour data and hopes for more Fed rate cuts. But others warn that investors may be wishful thinking!

A U.S. stock market pullback is likely due in Q4 2025

The fourth quarter (Q4) of the calendar year runs from 1st October to 31st December. In financial and editorial contexts, it often carries symbolic weight—year-end reckonings, holiday spending, and final earnings reports all converge here.

A pullback is due, but when?

Japan’s Nikkei surges to historic highs amid reform momentum

Japan's share soar to new highs!

Japanese equities are enjoying a remarkable rally, with the Nikkei 225 and broader Topix indices repeatedly breaking record highs throughout September 2025.

This surge reflects a potent mix of domestic reform, foreign investment, and a growing belief that Japan’s corporate landscape is undergoing a long-overdue transformation.

At the heart of the rally is Prime Minister Kishida’s push for structural reform, including corporate governance improvements and incentives for companies to boost shareholder returns.

These measures have resonated with global investors, who are increasingly viewing Japan as a stable alternative to more volatile markets. Foreign inflows have accelerated, with analysts noting that the momentum is built on solid economic fundamentals rather than speculative hype.

Despite the optimism, risks remain. Political instability, a potential spike in the yen, and ripple effects from a U.S. market downturn could all dampen the rally.

Yet, for now, these concerns are being outweighed by Japan’s reform narrative and its relative insulation from global tech bubbles and geopolitical tensions.

The Nikkei’s consistent climb is also symbolic. For decades, Japan’s stock market was seen as stagnant and haunted by the burst of its 1980s asset bubble.

Nikkei one year chart

Today, the narrative is shifting. Investors are no longer just betting on Japan’s past resilience; they’re buying into its future potential.

This bullish sentiment marks a turning point not just for Japanese equities, but for how global markets perceive Japan’s role in the 21st-century economy.

If reforms continue and foreign confidence holds, the Nikkei’s ascent may be more than a fleeting high—it could signal a new era of Japanese financial leadership.

It is very high! Will a U.S. stock market pullback dampen the Nikkei party?

What is the deal with the new Huawei AI power chip cluster touted by China?

AI race hots up!

Huawei has unveiled a bold new AI chip cluster strategy aimed squarely at challenging Nvidia’s dominance in high-performance computing.

At its Connect 2025 conference in Shanghai, Huawei introduced the Atlas 950 and Atlas 960 SuperPoDs—massive AI infrastructure systems built around its in-house Ascend chips.

These clusters represent China’s most ambitious attempt yet to bypass Western semiconductor restrictions and assert technological independence.

The technical stuff

The Atlas 950 SuperPoD, launching in late 2026, will integrate 8,192 Ascend 950DT chips, delivering up to 8 EFLOPS of FP8 compute and 16 EFLOPS at FP4 precision. (Don’t ask me either – but that’s what the data sheet says).

It boasts a staggering 16.3 petabytes per second of interconnect bandwidth, enabled by Huawei’s proprietary UnifiedBus 2.0 optical protocol. It is reportedly claimed to be ten times faster than current internet backbone infrastructure.

This system is reportedly designed to outperform Nvidia’s NVL144 cluster, with Huawei asserting a 6.7× advantage in compute power and 15× in memory capacity.

In 2027, Huawei reportedly plans to release the Atlas 960 SuperPoD, doubling the specs with 15,488 Ascend 960 chips. This reportedly will give 30 EFLOPS FP8 compute, and 34 PB/s bandwidth.

These SuperPoDs will be linked into SuperClusters. The Atlas 960 SuperCluster is reportedly projected to reach 2 ZFLOPS of FP8 performance. This potentially rivals even Elon Musk’s xAI Colossus and Nvidia’s future NVL576 deployments.

Huawei’s roadmap includes annual chip upgrades: Ascend 950 in 2026, Ascend 960 in 2027, and Ascend 970 in 2028.

Each generation promises to double computing power. The chips will feature Huawei’s own high-bandwidth memory variants—HiBL 1.0 and HiZQ 2. These are designed to optimise inference and training workloads.

Strategy

This strategy reflects a shift in China’s AI hardware approach. Rather than competing on single-chip performance, Huawei is betting on scale and system integration.

By controlling the entire stack—from chip design to memory, networking, and interconnects—it aims to overcome fabrication constraints imposed by U.S. sanctions.

While Huawei’s software ecosystem still trails Nvidia’s CUDA, its CANN toolkit is gaining traction. Chinese regulators discourage purchases of Nvidia’s AI chips.

The timing of Huawei’s announcement coincides with increased scrutiny of Nvidia in China, suggesting a coordinated push for domestic alternatives.

In short, Huawei’s AI cluster strategy is not just a technical feat—it’s a geopolitical statement.

Whether it can match Nvidia’s real-world performance remains to be seen, but the ambition is unmistakable.

The AI power race just got even hotter!

Fed cuts rates amid labour market strains and political Powell pressure

U.S. cuts rates

On 17th September 2025, the U.S. Federal Reserve announced its first interest rate cut of 2025, lowering the benchmark federal funds rate by 0.25% to a range of 4.00%–4.25%.

The decision follows nine months of monetary policy stagnation and comes amid mounting evidence of a weakening labour market and persistent inflationary pressures.

Fed Chair Jerome Powell described the move as a ‘risk management cut’, citing slower job growth and a rise in unemployment as key drivers.

While inflation remains elevated—partly due to tariffs introduced by the Trump administration—the Fed opted to prioritise employment support, signalling the possibility of two further cuts before year-end.

The decision was not without controversy. New Fed Governor Stephen Miran, recently appointed by President Trump, reportedly dissented, advocating for a more aggressive half-point reduction. Political tensions have escalated, with Trump publicly urging Powell to ‘cut bigger’.

Markets responded with mixed signals: the Dow rose modestly, while the S&P 500 and Nasdaq slipped slightly. However, each improved in after-hours trading.

Analysts remain divided over the long-term impact, with some warning that easing too quickly could reignite inflation.

The Fed’s next move will be closely watched as it balances economic fragility with political crosswinds.

The next U.S. Federal Reserve meeting is scheduled for 29th–30th October 2025, with the interest rate decision expected on Wednesday, 30th October at 2:00 PM ET.

Are we looking at an AI house of cards? Bubble worries emerge after Oracle blowout figures

AI Bubble?

There’s growing concern that parts of the AI boom—especially the infrastructure and monetisation frenzy—might be built on shaky foundations.

The term ‘AI house of cards’ is being used to describe deals like Oracle’s multiyear agreement with OpenAI, which has committed to buying $300 billion in computing power over five years starting in 2027.

That’s on top of OpenAI’s existing $100 billion in commitments, despite having only about $12 billion in annual recurring revenue. Analysts are questioning whether the math adds up, and whether Oracle’s backlog—up 359% year-over-year—is too dependent on a single customer.

Oracle’s stock surged 36%, then dropped 5% Friday as investors took profits and reassessed the risks.

Some analysts remain neutral, citing murky contract details and the possibility that OpenAI’s nonprofit status could limit its ability to absorb the $40 billion it raised earlier this year.

The broader picture? AI infrastructure spending is ballooning into the trillions, echoing the dot-com era’s early adoption frenzy. If demand doesn’t materialise fast enough, we could see a correction.

But others argue this is just the messy middle of a long-term transformation—where data centres become the new utilities

The AI infrastructure boom—especially the Oracle–OpenAI deal—is raising eyebrows because the financial and operational foundations look more speculative than solid.

Here’s why some analysts are calling it a potential house of cards

⚠️ 1. Mismatch Between Revenue and Commitments

  • OpenAI’s annual revenue is reportedly around $10–12 billion, but it’s committed to $300 billion in cloud spending with Oracle over five years.
  • That’s $60 billion per year, meaning OpenAI would need to grow revenue 5–6x just to break even on compute costs.
  • CEO Sam Altman projects $44 billion in losses before profitability in 2029.

🔌 2. Massive Energy Demands

  • The infrastructure needed to fulfill this contract requires electricity equivalent to two Hoover Dams.
  • That’s not just expensive—it’s logistically daunting. Data centres are planned across five U.S. states, but power sourcing and environmental impact remain unclear.
AI House of Cards Infographic

💸 3. Oracle’s Risk Exposure

  • Oracle’s debt-to-equity ratio is already 10x higher than Microsoft’s, and it may need to borrow more to meet OpenAI’s demands.
  • The deal accounts for most of Oracle’s $317 billion backlog, tying its future growth to a single customer.

🔄 4. Shifting Alliances and Uncertain Lock-In

  • OpenAI recently ended its exclusive cloud deal with Microsoft, freeing it to sign with Oracle—but also introducing risk if future models are restricted by AGI clauses.
  • Microsoft is now integrating Anthropic’s Claude into Office 365, signalling a diversification away from OpenAI.

🧮 5. Speculative Scaling Assumptions

  • The entire bet hinges on continued global adoption of OpenAI’s tech and exponential demand for inference at scale.
  • If adoption plateaus or competitors leapfrog, the infrastructure could become overbuilt—echoing the dot-com frenzy of the early 2000s.

Is this a moment for the AI frenzy to take a breather?

Nasdaq finishes at record high on Friday 12th September 2025?

Nasdaq hit record high!

On Friday 12th September 2025, the Nasdaq closed at a record high, while the S&P 500 ended the week with gains but did not finish at a new record level.

  • Nasdaq Composite: Rose 0.45% to 22,141.10 — a new all-time high.
  • S&P 500: Dipped slightly by 0.05% to 6,584.29 — still near historic levels, but not a record close.

The broader mood was one of cautious optimism, with investors eyeing the upcoming Federal Reserve decision.

Bulls are riding high, but some analysts are starting to wonder if exuberance is getting ahead of fundamentals

Nikkei Surges to Record High Amid AI Euphoria

Nikkei up!

Tokyo, 12th September 2025 — The Nikkei 225 has surged to an all-time intraday high of 44,888.02, before settling at 44,768.12 at the close.

This marks a weekly gain of 3.8%, fuelled by a potent cocktail of AI optimism, global rate-cut hopes, and a tech-heavy rally that has left analysts both exhilarated and uneasy.

Rally

SoftBank Group led the charge, soaring nearly 10% earlier this week to a record 17,885. Its stake in the Stargate AI infrastructure project—alongside Oracle and OpenAI—has positioned it as Japan’s de facto ambassador to the AI gold rush. Investors, it seems, are buying not just stock, but narrative.

Meanwhile, global macro tremors have played their part. A rise in U.S. unemployment and tepid job creation have reignited hopes for a Federal Reserve rate cut, lifting equities worldwide.

Nikkei 225 one-year chart

Nikkei 225 one-year chart

Japanese industrials and exporters have ridden the wave, with Mitsubishi Heavy Industries up 70% year-to-date, and Fujikura surging 115%.

Even the judiciary has joined the chorus: a U.S. appeals court ruling against Trump-era tariffs has sparked hopes of a reversal, giving Japanese exporters a fresh tailwind.

Speculation or substance?

Yet beneath the euphoria, caution lingers. Investors warn of an ‘overheated’ market, noting that Japan’s equity gains still trail Wall Street’s meteoric rise.

The Nikkei’s ascent, while historic, may be more froth than fundamentals.

AI is driving the gain.

Databases to Dominance: Oracle’s AI Boom and Ellison’s Billionaire Ascent

Oracle

Oracle Corporation has just staged one of the most dramatic rallies in tech history—catapulting itself into the elite club of near-trillion-dollar companies and reshaping the billionaire leaderboard in the process.

Founded in 1977 by Larry Ellison, Oracle began as a modest database software firm. Its first major boom came in the late 1990s, riding the dot-com wave as enterprise software demand exploded.

By 2000, Oracle’s market cap had surged past $160 billion, making it one of the most valuable tech firms of the era.

A second wave of growth followed in the mid-2000s, fuelled by aggressive acquisitions like PeopleSoft and Sun Microsystems, which expanded Oracle’s footprint into enterprise applications and hardware.

Boom

But its most recent boom—triggered in 2025—is unlike anything before. Oracle’s pivot to cloud infrastructure and artificial intelligence has paid off spectacularly. In its fiscal Q1 2026 report, Oracle revealed $455 billion in remaining performance obligations (RPO), a staggering 359% increase year-over-year.

This backlog, driven by multi-billion-dollar contracts with AI giants like OpenAI, Meta, Nvidia, and xAI, sent shockwaves through Wall Street.

Despite missing revenue and earnings expectations slightly—$14.93 billion in revenue vs. $15.04 billion expected, and $1.47 EPS vs. $1.48 forecasted—the market responded with euphoria.

Oracle’s stock soared nearly 36% in a single day, adding $244 billion to its market cap and pushing it to approximately $922 billion. Analysts called it ‘absolutely staggering’ and ‘truly awesome’, with Deutsche Bank reportedly raising its price target to $335.

Oracle Infographic September 2025

This meteoric rise had personal consequences too. Larry Ellison, Oracle’s co-founder and current CTO, saw his net worth jump by over $100 billion in one day, briefly surpassing Elon Musk to become the world’s richest person.

His fortune reportedly peaked at around $397 billion, largely tied to his 41% stake in Oracle. Ellison’s journey—from college dropout to tech titan—is now punctuated by the largest single-day wealth gain ever recorded.

CEO Safra Catz also benefited, with her net worth rising by $412 million in just six hours of trading, bringing her total to $3.4 billion. Under her leadership, Oracle’s stock has risen over 800% since she became sole CEO in 2019.

Oracle’s forecast for its cloud infrastructure business is equally jaw-dropping: $18 billion in revenue for fiscal 2026, growing to $144 billion by 2030. If these projections hold, Oracle could soon join the trillion-dollar club alongside Microsoft, Apple, and Nvidia.

From database pioneer to AI infrastructure powerhouse, Oracle’s evolution is a masterclass in strategic reinvention.

Oracle one-year chart 10th September 2025

Oracle one-year chart 10th September 2025

And with Ellison now at the summit of global wealth, the company’s narrative is no longer just about software—it’s about legacy, dominance, and the future of intelligent computing.

U.S. indices hit fresh record closing highs 9th September 2025

U.S. indices hit new highs!

S&P 500 rose 0.3% to finish at 6,512.61, surpassing its previous record from last week.

Dow Jones Industrial Average climbed 0.4% to 45,711.34, beating its August 28 high.

Nasdaq Composite added 0.4%, closing at 21,879.49, marking its second consecutive record high.

The rally was fueled by strong performances in tech—especially chipmakers and AI infrastructure players like Nvidia and Oracle—and growing expectations of a Federal Reserve rate cut.

Negative news is not affecting the market as the Nasdaq hits a new high!

Nasdaq rockets to new high

The Nasdaq Composite closed at a record high of 21,798.70 on Monday, 8th September 2025. That 0.45% gain was driven largely by a rally in chip stocks—Broadcom surged 3.2%, and Nvidia added nearly 1%.

The broader market also joined the party:

  • S&P 500 rose 0.21% to 6,495.15
  • Dow Jones Industrial Average climbed 0.25% to 45,514.95

Investor optimism is swirling around potential Federal Reserve rate cuts, especially with inflation data due later this week. The market’s momentum seems to be riding a wave of AI infrastructure spending and tech sector strength.

Negative news is not affecting the market – but why?

  • The Nasdaq Composite closes at a record high on Monday 8th September 2025.
  • Refunds could hit $1 trillion if tariffs are deemed illegal.
  • China’s Xpeng eyes global launch of its Mona brand.
  • French Prime Minister Francois Bayrou loses no-confidence vote.
  • UK deputy PM resigns after tax scandal.

Stocks are rising despite August’s dismal jobs report because investors are interpreting the weak labor data as a signal that interest rate cuts may be on the horizon—and that’s bullish for equities.

📉 The contradiction at the heart of the market The U.S. economy showed signs of slowing, with job numbers actually declining in June and August’s report falling short of expectations.

Normally, that would spook investors—fewer jobs mean less consumer spending, which hurts corporate earnings and stock prices.

📈 But here’s the twist Instead of panicking, markets rallied. The Nasdaq Composite hit a record high, and the S&P 500 and Dow Jones also posted gains.

Why? Because a weaker jobs market increases the likelihood that the Federal Reserve will cut interest rates to stimulate growth. Lower rates make borrowing cheaper and boost valuations—especially for tech stocks.

🤖 AI’s role in the rally Tech firms, particularly those tied to artificial intelligence like Broadcom and Nvidia, led the charge.

The suggestion is that investors may be viewing job cuts as a sign that AI is ‘working as intended’—streamlining operations and improving margins. Salesforce and Klarna, for instance, have both reportedly cited AI as a reason for major workforce reductions.

Summary

IndicatorValue / ChangeInterpretation
Nasdaq Composite📈 21,798.70 (Record High)Tech led rally, 
investor optimism
S&P 500➕ 6,495.15Broad market strength
Dow Jones➕ 45,514.95Industrial resilience
August Jobs Report📉 Missed expectationsLabour market weakness
Job Growth (June & Aug)📉 NegativeEconomic slowdown
Investor Reaction🟢 Rate cuts expectedBullish for equities
AI Layoff Narrative🤖 ‘Efficiency gains’Tech streamlining 
Featured StocksBroadcom +3.2%, Nvidia +0.9%AI infrastructure driving
Infographic summary

So, while the jobs report paints a gloomy picture for workers, the market sees a silver lining: rate relief and tech-driven efficiency.

It’s a classic case of Wall Street optimism—where bad news for Main Street can be good news for stock prices.

The career ladder is broken—but the Nasdaq is building a rocket.

The Fed up next to move the market.

Japan’s yield curve bites back as it hits new highs!

Japan' Bond Yields

After decades of economic sedation, Japan’s long-term bond yields are rising with a vengeance.

The 30-year government bond has breached 3.286%—its highest level on record—while the 20-year yield has climbed to 2.695%, a peak not seen since 1999.

These aren’t just numbers; they’re seismic signals of a nation confronting its delayed past, now its deferred future.

Indicative Yield Curve for Japan

For years, Japan’s yield curve was a monument to inertia. Negative interest rates, yield curve control, and relentless bond-buying by the Bank of Japan created an artificial calm—a kind of economic Zen garden, raked smooth but eerily still.

That era is ending. Inflation has persisted above target for three years, and the BOJ’s retreat from monetary intervention has unleashed market forces long held at bay.

This steepening curve is more than financial recalibration—it’s a symbolic reckoning. Rising yields demand accountability: from policymakers who masked structural fragility, from investors who chased safety in stagnation, and from a society that postponed hard choices on demographics, debt, and productivity.

The bond market, once a passive witness, now acts as judge. Each basis point is a moral verdict on Japan’s economic past.

The shadows of the Lost Decades—deflation, aging populations, and overspending—are being dispelled not by command, but through the process of price discovery.

In this new era, Japan’s yield curve resembles a serpent uncoiling—no longer dormant but rising with intent.

The question isn’t whether the curve will flatten again, but whether Japan can meet the moment it has long delayed.

China’s EV Price War: BYD falters as the Chinese EV machine reshapes the global car market

EV global price war

China’s electric vehicle (EV) powerhouse is rewriting the global automotive playbook—but not without homegrown company damage.

BYD, now the world’s largest EV manufacturer by volume, has been caught in the crossfire of a domestic price war.

Damaging price war

The price war is damaging margins. It is unnerving investors and revealing the perils of hyper-competition in the world’s most aggressive car market.

In Q2 2025, BYD posted a 30% drop in net profit to 6.4 billion yuan (£700 million), its first earnings decline in over three years.

Despite a 145% surge in overseas sales, the company’s sweeping discounts across 22 models have eroded profitability at home.

Gross margins slipped to around 16%, and its Hong Kong-listed shares tumbled 8% to a five-month low.

Analysts reportedly now question whether BYD can hit its ambitious 5.5-million-unit sales target, having reached only 45% by July 2025.

The price war, ignited by BYD’s aggressive cuts in May 2025, has forced rivals like Geely, Chery, and SAIC-GM to follow suit. Entry-level EVs now start below (£6,500), with features like driver assistance and smart infotainment once reserved for premium models.

But the race to the bottom has drawn concern from regulators and industry leaders. The China Association of Automobile Manufacturers (CAAM) warned of “disorderly competition”, while executives fear quality compromises and supplier strain.

Yet even as BYD stumbles, the broader Chinese EV machine is gaining global momentum. In Europe, BYD overtook Tesla in July sales, capturing 1.1% market share versus Tesla’s 0.7%.

Chinese EV car brands account for around 10% of new UK car sales

Chinese brands now account for around 10% of new car sales in the UK. There are over 30 affordable EV models priced under £30,000.

Their edge lies in battery supply chains, manufacturing efficiency, and software integration. Transforming cars into ‘smartphones on wheels’ tailored to digitally connected consumers.

China’s EV revolution is no longer just a domestic shake-up—it’s a global reordering. Legacy automakers are retreating from the budget segment. But Chinese firms flooding international markets with sleek, connected, and competitively priced vehicles.

BYD’s profit dip may be a temporary wobble. The long-term trajectory is clear: China isn’t just building cars—it’s building the future of mobility.

For global rivals, the message is unmistakable: adapt, or be outpaced by the dragon’s electric roar.

Infographic: China’s BYD and other EVs

Summary

BYD’s Q2 2025 net profit drop of 30% to 6.4 billion yuan: This figure aligns with recent earnings reports and analyst commentary. The drop is consistent with margin pressure from domestic price cuts.

Gross margin falling to 16.3%: Matches industry estimates for BYD’s automotive segment, which has seen compression due to aggressive discounting.

Overseas sales up 145% YoY: BYD’s international expansion—especially in Europe, Southeast Asia, and Latin America—has been rapid. This growth rate is plausible and supported by export data.

BYD reaching only 45% of its 5.5 million unit sales target by July: This tracks with cumulative delivery figures through mid-year, suggesting a potential shortfall unless H2 volumes accelerate.

Price war triggered by BYD’s cuts across 22 models in May: Confirmed by industry reports and BYD’s own promotional campaigns. Other automakers like Geely and Chery have responded with similar discounts.

CAAM warning of “disorderly competition”: This quote has appeared in official statements and media coverage, reflecting regulatory concern over unsustainable pricing.

Chinese EVs gaining market share in Europe and UK: BYD overtaking Tesla in July 2025 sales in Europe is supported by registration data. Chinese brands now account for ~10% of UK new car sales, with many models priced under £30,000.