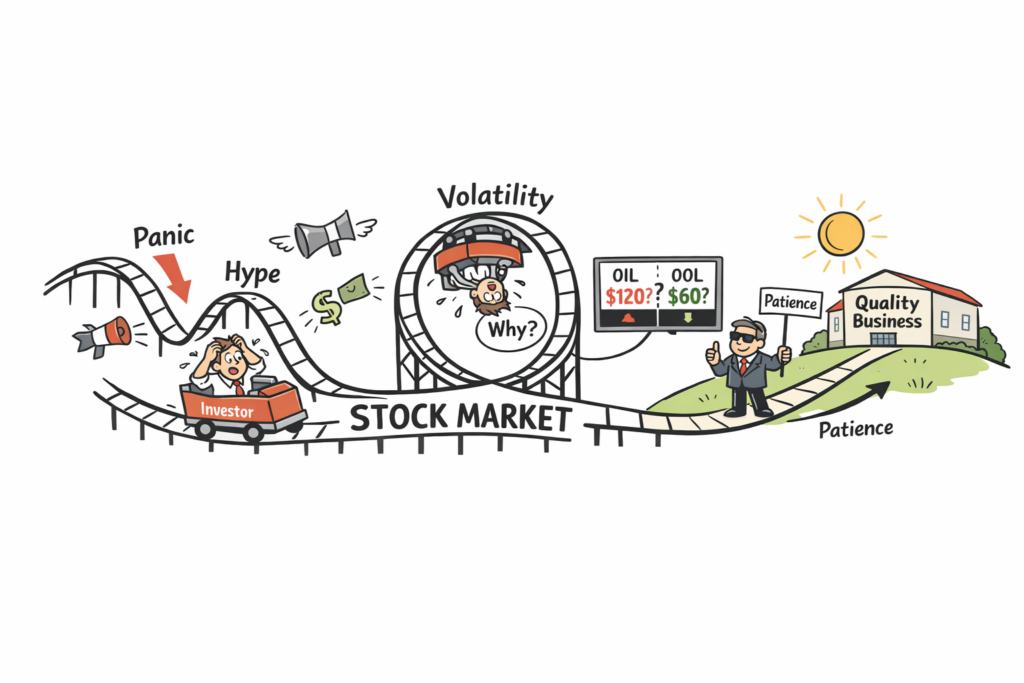
Financial markets are no strangers to volatility, but even seasoned traders were taken aback by the extraordinary price action that unfolded recently.
Just a minute
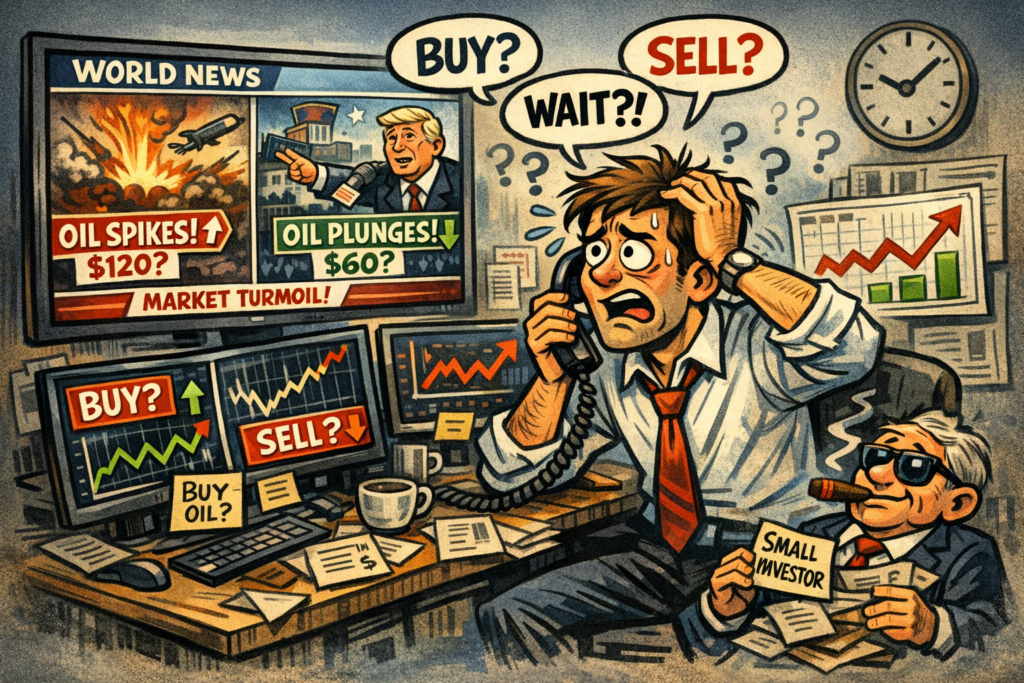
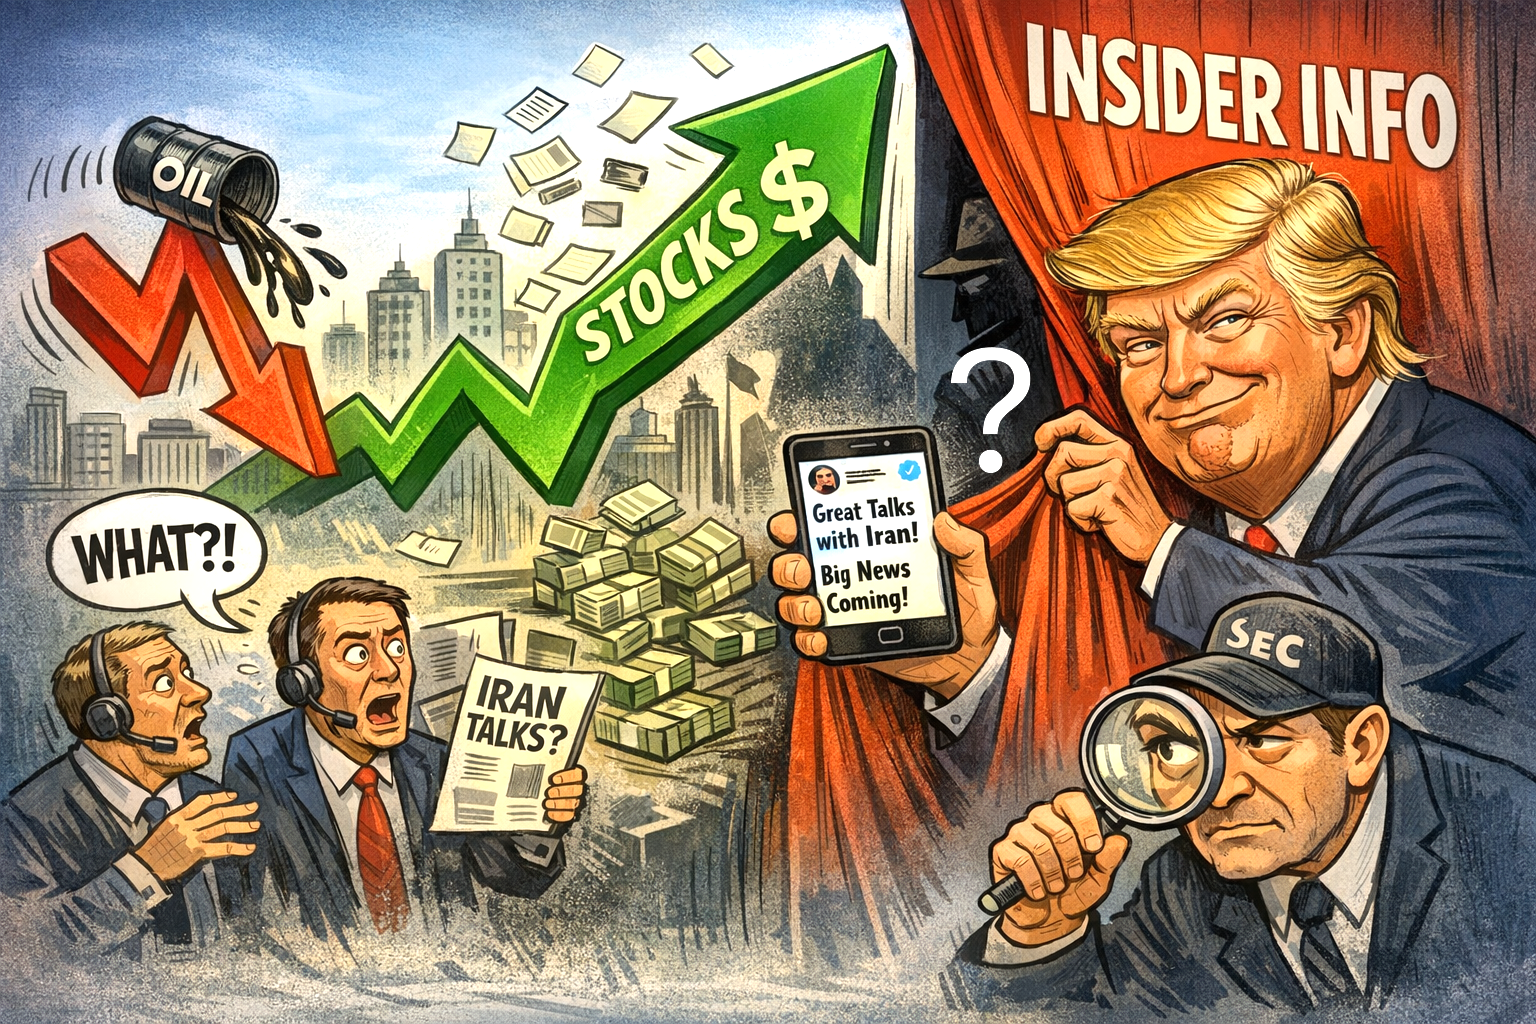
In the space of minutes, global indices lurched upwards, oil prices collapsed, and billions of dollars shifted across the financial system — all triggered by a single, unexpected announcement from President Trump claiming “productive talks” with Iran.
What followed was a whiplash-inducing reversal, a diplomatic denial from Tehran, and a growing chorus of questions about whether the market’s initial leap was quite as spontaneous as it appeared.
Spike
The sequence of events is now well documented. In the quiet pre‑market hours, trading volumes in S&P 500 futures and crude oil contracts suddenly spiked.
These were not the tentative probes of retail traders or the routine adjustments of algorithmic systems. They were large, directional, and unusually well‑timed.
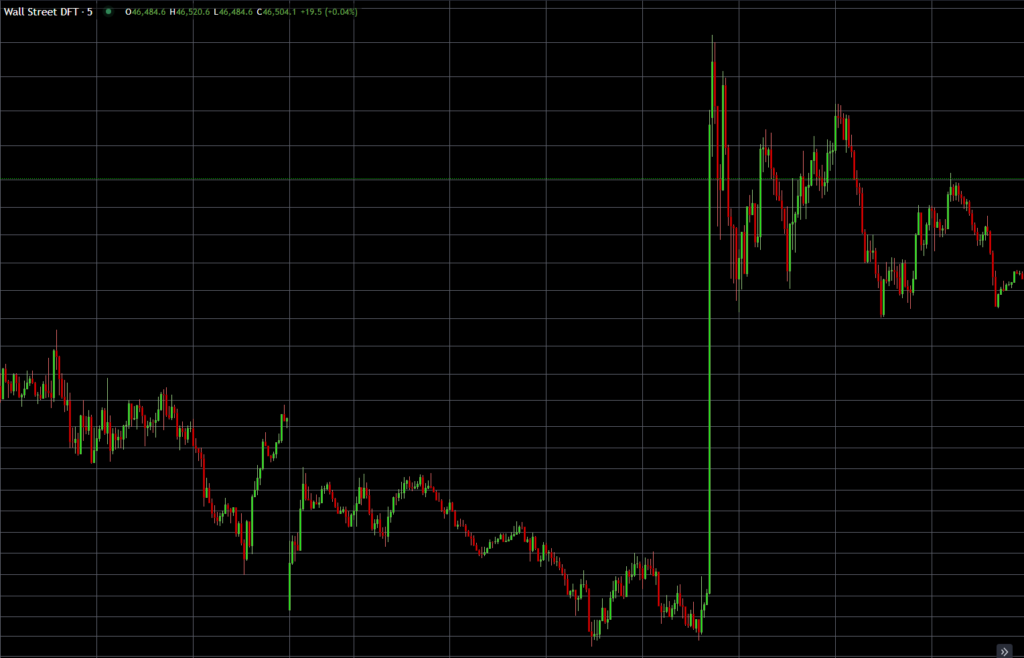
Minutes later, Trump posted his statement about progress with Iran — a geopolitical development with obvious implications for equities and energy markets.
Instant
Prices reacted instantly. Equities surged. Oil tumbled. Within the hour, Iran publicly denied that any such talks had taken place, prompting a partial reversal of the earlier moves. Maybe we should draw a distinction between ‘talks’ and ‘messages’.
It is the precision of the trades placed before the announcement that has raised eyebrows. Markets do not move in anticipation of news that does not exist in the public domain.
Yet someone, somewhere, positioned themselves perfectly for the impact of Trump’s message posted on social media.
Fortuitous coincidence or deliberate manipulation?
Scale
The scale of the trades suggests institutional capability; the timing suggests foreknowledge. Whether that foreknowledge was legitimate, accidental, or illicit is now the central question.
Speculation about insider trading is inevitable in such circumstances, but it is important to distinguish between suspicion and proof. Political announcements are not governed by the same disclosure rules that apply to corporate earnings or mergers.
Presidents are not bound by quiet periods. Their advisers, however, are. So are the staff, intermediaries, and diplomatic channels through which sensitive information flows.
Obligation to investigate
If anyone in that chain traded — or tipped off someone who did — regulators will be obliged to investigate.
There is also a broader concern about the integrity of market‑moving communication. If Iran’s denial is accurate, and no talks occurred, then the market reacted to a statement that may not have reflected reality.
Even without malicious intent, such episodes undermine confidence in the informational foundations on which markets depend. When a single message can add or erase trillions in value, the accuracy and reliability of that message become matters of systemic importance.
Suspicion
For now, the episode sits in an ambiguous space: suspicious, but unproven; dramatic, but not unprecedented. Markets will move on, as they always do.
Yet the questions raised yesterday will linger — about transparency, about the porous boundaries between politics and finance, and about the unseen hands that sometimes seem to move just a little too quickly.
Does the idea that Trump ‘massages’ the market carry any weight?
It’s a fair question, and one that keeps resurfacing because the pattern is hard to ignore.
The idea that Trump “massages” the markets isn’t a conspiracy theory in itself — it’s an observation that his public statements often have immediate, dramatic financial consequences.
The real issue is whether those consequences are accidental, strategic, or exploited by people with advance knowledge.
A coincidence? You decide.