After months of gradual easing, the pause reflects a delicate moment for the UK economy, with price pressures beginning to shift beneath the surface.
Clothing was the biggest upward driver, with prices rising this year after falling during the same period in 2025.
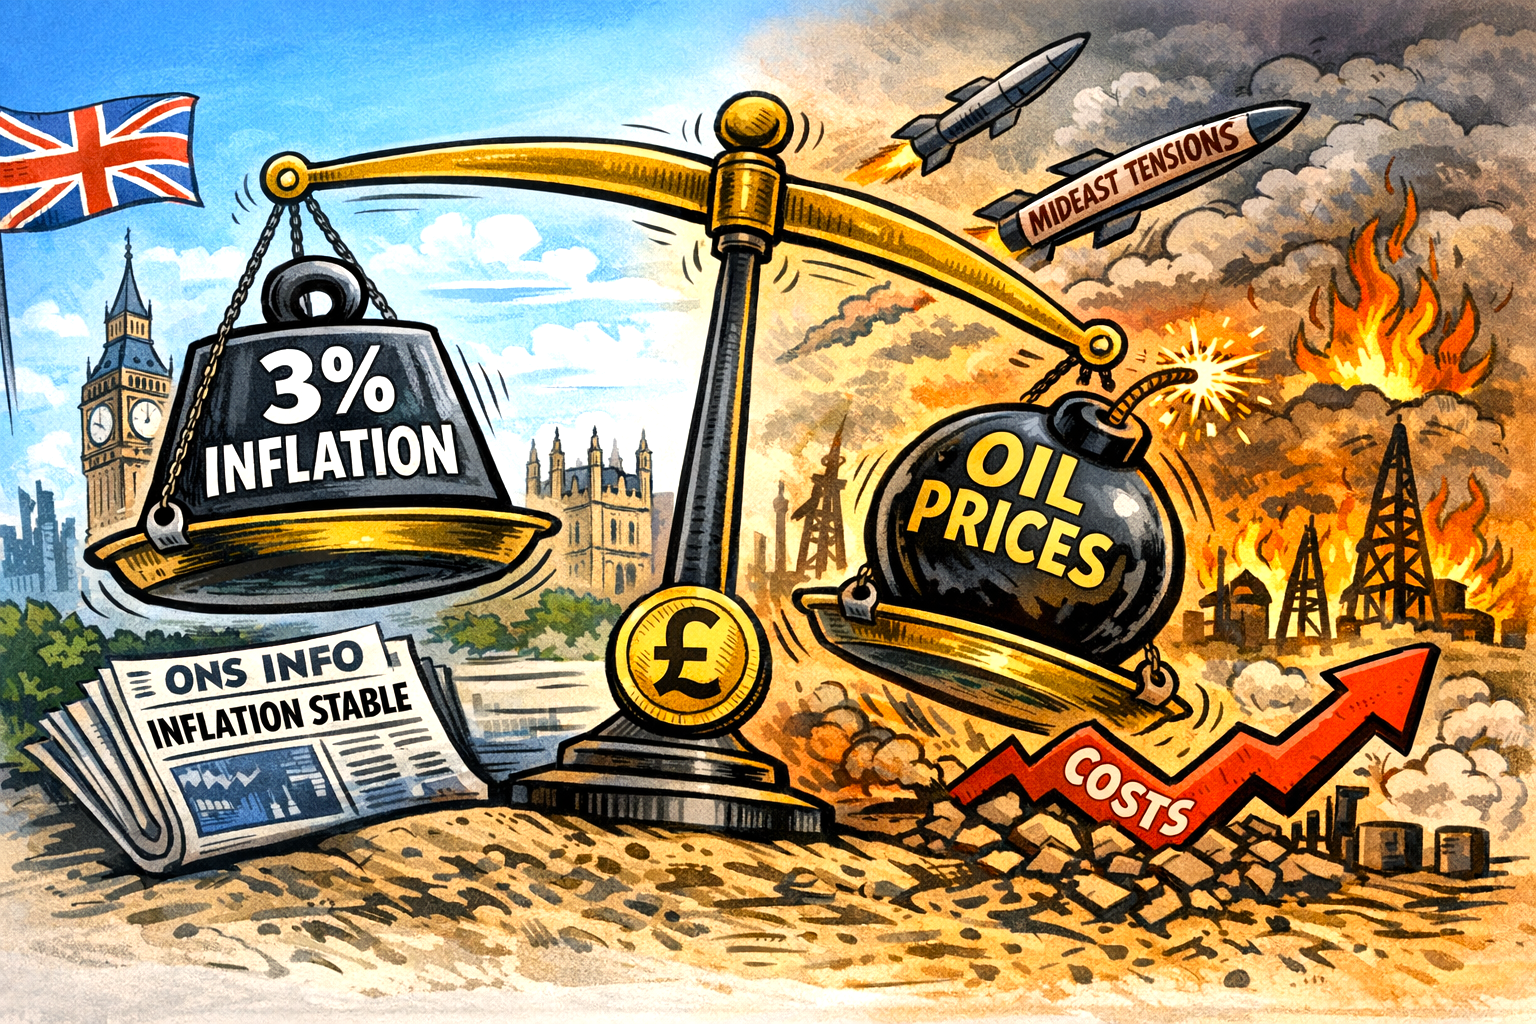
This was offset by cheaper petrol, though those figures were captured before the recent surge in global oil prices triggered by the outbreak of war involving Iran.
While inflation is far below the peaks seen a few years ago, households are still contending with the reality that prices continue to rise—just more slowly.
ONS data
The ONS also introduced supermarket scanner data for the first time, offering a more accurate picture of food costs.
Economists warn that the conflict‑driven spike in oil and gas prices could push inflation higher again later in the year, with some forecasts suggesting a potential rise towards 4.6%.
Businesses already reliant on fuel, such as regional bus operators, report steep cost increases that may soon feed through to consumers.
The government insists it is working to ease cost‑of‑living pressures, though global events may limit its room for manoeuvre.
The UK mortgage market has been thrown back into a state of turbulence not seen since the aftermath of the 2022 mini‑Budget, as lenders scramble to reprice deals in response to global instability triggered by the U.S. Israel war with Iran.
Average rates on two‑year fixed mortgages have now climbed above 5%, reaching their highest level since last August, according to data from Moneyfacts. Five‑year fixes have also risen, marking their most expensive point since mid‑2024.
Little or no warning
The sudden shift has caught borrowers off guard. Nearly 500 mortgage products have been withdrawn in just 48 hours, the steepest contraction in available deals since the Truss–Kwarteng fiscal shock.
Lenders are reacting to sharp movements in gilt yields, which have become increasingly volatile as markets reassess the likelihood of Bank of England rate cuts this year.
Before the conflict erupted, investors had broadly expected the Bank to begin easing borrowing costs. That optimism evaporated as oil prices surged, raising the prospect of renewed inflationary pressure.
With Brent crude still more than 20% higher than before the war and reaching over 40% increase at one stage, expectations of cheaper mortgages have been replaced by fears of a prolonged period of elevated rates.
Timing
For homeowners approaching the end of a fixed deal, the timing is particularly painful. The average two‑year fix has jumped from 4.84% to 5.01% in less than four days, while five‑year rates have risen from 4.96% to 5.09%.
First‑time buyers, already squeezed by high prices and stagnant supply, face a shrinking pool of products and rising monthly costs.
The wider cost‑of‑living picture is also darkening. Petrol and diesel prices continue to climb as Middle East supply disruptions ripple through global energy markets.
With inflation risks resurfacing, the path for mortgage rates now hinges on how the conflict evolves — and whether markets can regain their footing.
Fuel up, energy costs up and mortgage rates up – all in just a weekend – that didn’t take long.
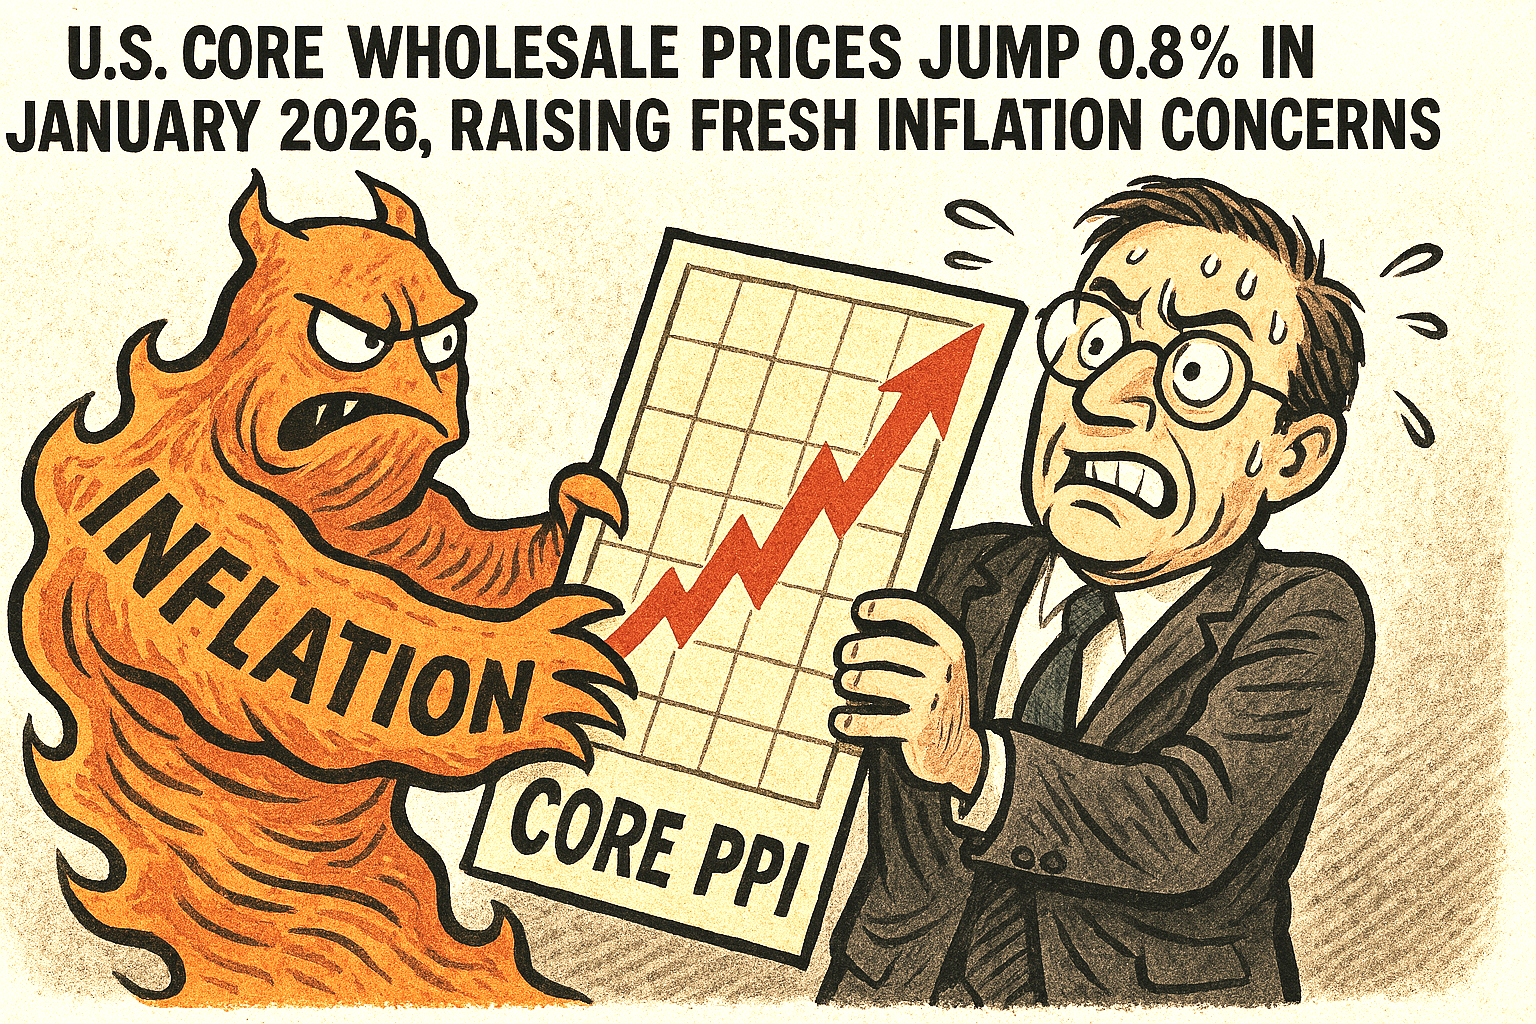
U.S. core wholesale prices rose 0.8% in January 2026, a sharper-than-expected acceleration that has renewed concerns about lingering inflationary pressures across the American economy.
The increase, reported by the Bureau of Labor Statistics, exceeded both December 2025’s 0.6% rise and the consensus expectation of 0.3%, marking one of the strongest monthly gains in recent months.
The core U.S. Producer Price Index (PPI), which strips out volatile food and energy components, is closely watched as an indicator of underlying cost pressures faced by businesses.
January’s jump suggests that inflationary forces remain embedded in key service sectors, even as goods prices continue to soften.
Indeed, services were the primary driver of the month’s overall wholesale inflation, with final demand services advancing 0.8%, while goods prices fell by 0.3% amid notable declines in gasoline and several food categories.
Divergence
This divergence between services and goods highlights a structural shift in inflation dynamics. Goods inflation has eased significantly as supply chains normalise and commodity prices stabilise.
By contrast, service-sector inflation—often tied to labour costs, logistics, and profit margins—has proven more persistent.
January 2026’s data underscores this trend, with strong increases in areas such as professional and commercial equipment wholesaling, telecommunications access services, and health and beauty retailing.
Complicates Inflation Outlook
For policymakers, the report complicates the inflation outlook. While headline PPI rose a more modest 0.5%, the strength of the core measure suggests that underlying pressures may not be cooling as quickly as hoped.
Markets had been anticipating a gradual easing that would give the Federal Reserve more confidence to consider rate cuts later in the year.
Instead, the January 2026 figures may reinforce a more cautious stance, particularly if upcoming consumer inflation data echoes the same pattern.
Businesses and consumers alike will be watching February 2026’s data closely to determine whether January represents a temporary spike or the beginning of a more stubborn inflation trend.
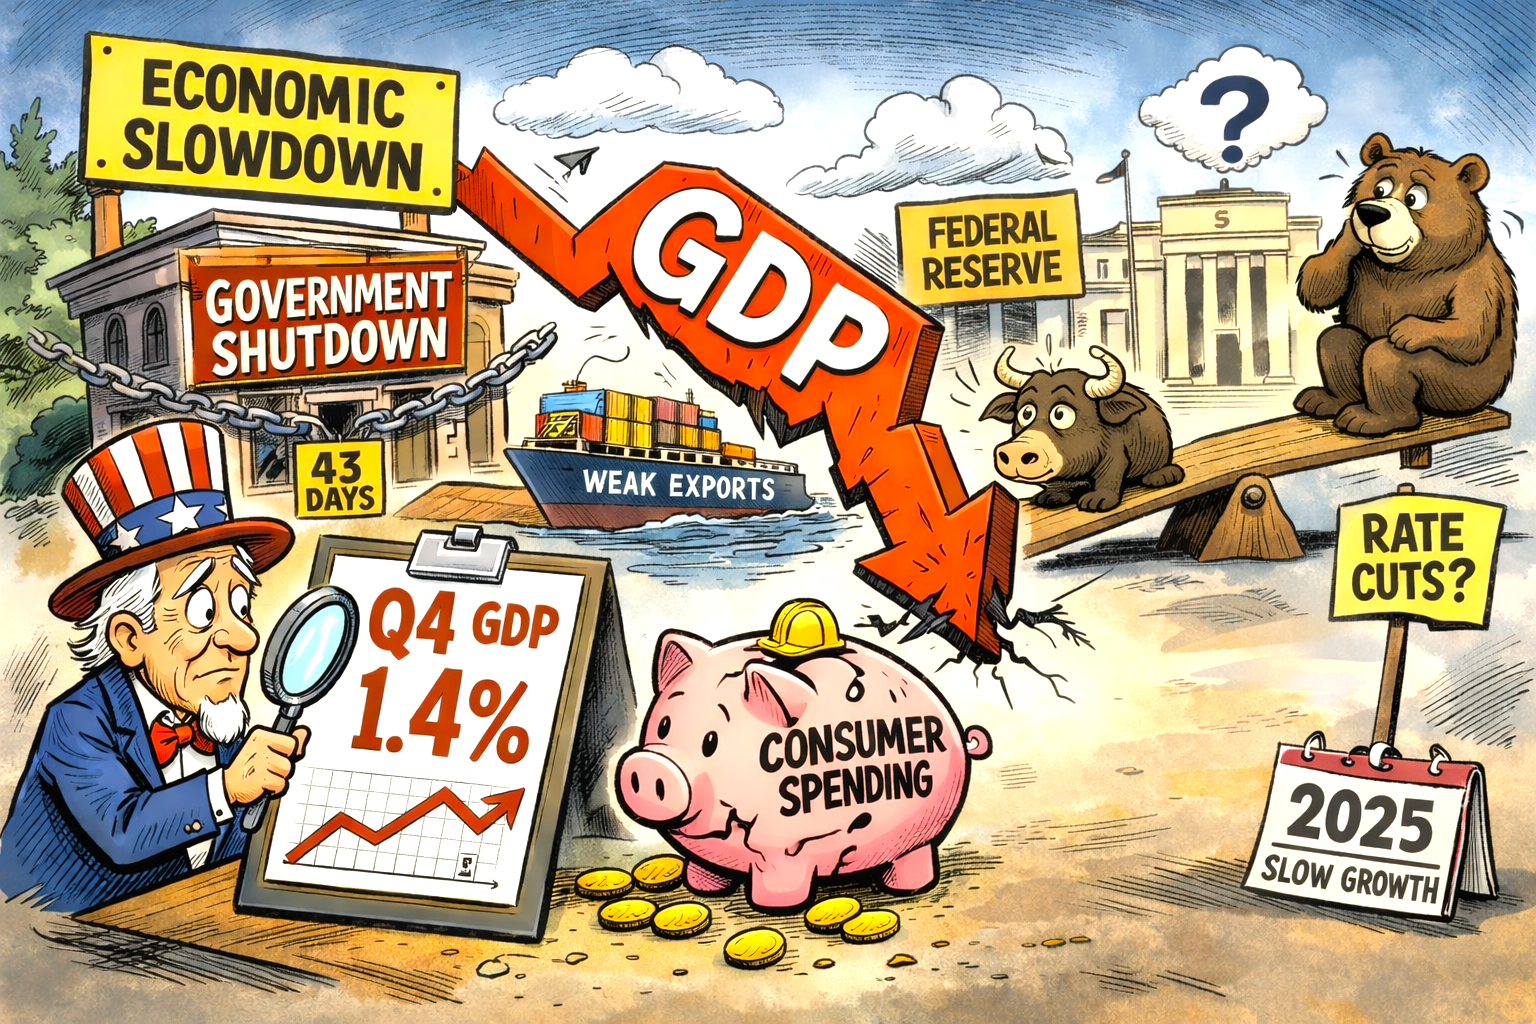
The United States economy lost momentum at the end of 2025, with fourth‑quarter GDP rising just 1.4%, a sharp deceleration from the 4.4% expansion recorded in the previous quarter.
The first estimate from the U.S. Bureau of Economic Analysis underscored a cooling backdrop that contrasts with the resilience seen through much of last year.
The slowdown was broad‑based. Government spending, which had previously provided a meaningful lift, swung lower.
Exports weakened
Exports also weakened, reflecting softer global demand and a less favourable trade environment.
Consumer spending — the backbone of the U.S. economy — continued to grow but at a more subdued pace, suggesting households are becoming more cautious as borrowing costs remain elevated. Although there has been some easing in U.S. mortgage rates.
Imports declined, which mechanically supports GDP, but the underlying signal points to softer domestic demand.
Analysts had expected a stronger finish to the year, with forecasts clustered closer to 2.5%.
The miss raises questions about the durability of U.S. growth heading into 2026, particularly as fiscal support fades and the effects of tighter monetary policy continue to filter through.
Q3 surge to Q4 slowdown
The contrast with the previous quarter is stark: Q3’s surge was driven by robust consumer activity, firmer government outlays, and a rebound in exports — dynamics that have since reversed.
Even so, the latest figures do not point to an imminent recession. Investment remains mixed rather than collapsing, and consumer spending is still contributing positively.
But the data does reportedly suggest the economy is entering a more fragile phase, where small shocks could have outsized effects.
For policymakers, the report complicates the Federal Reserve’s path. Inflation has eased but remains above target, and a softer growth profile may strengthen the case for rate cuts later in the year — though officials will want clearer evidence before shifting course.
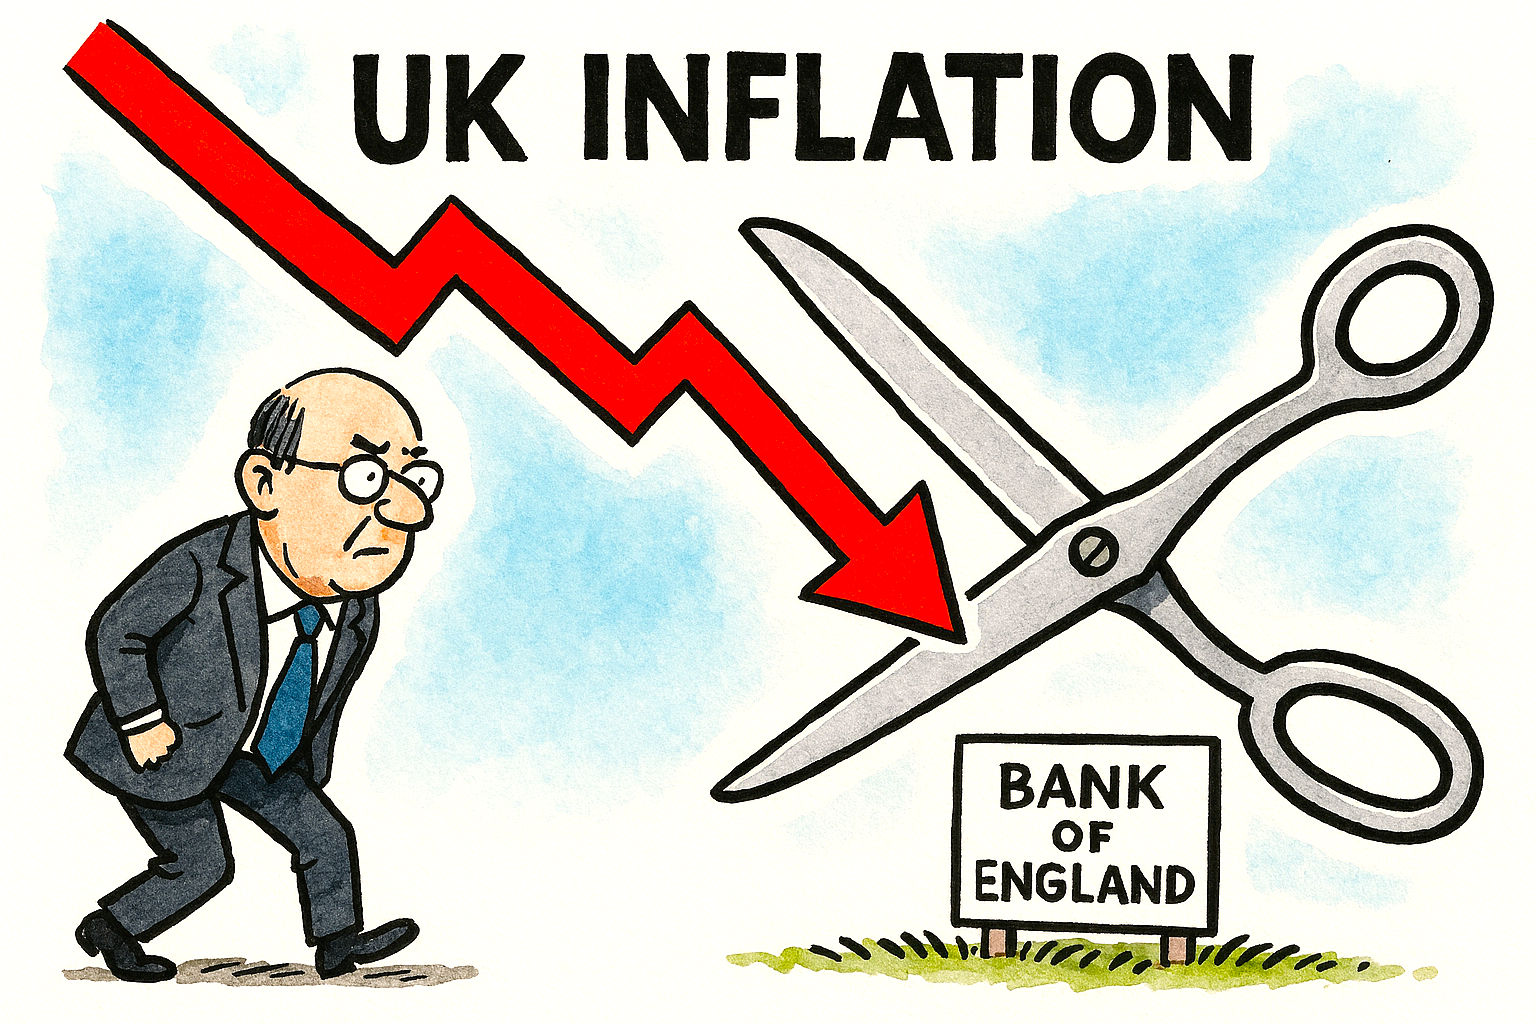
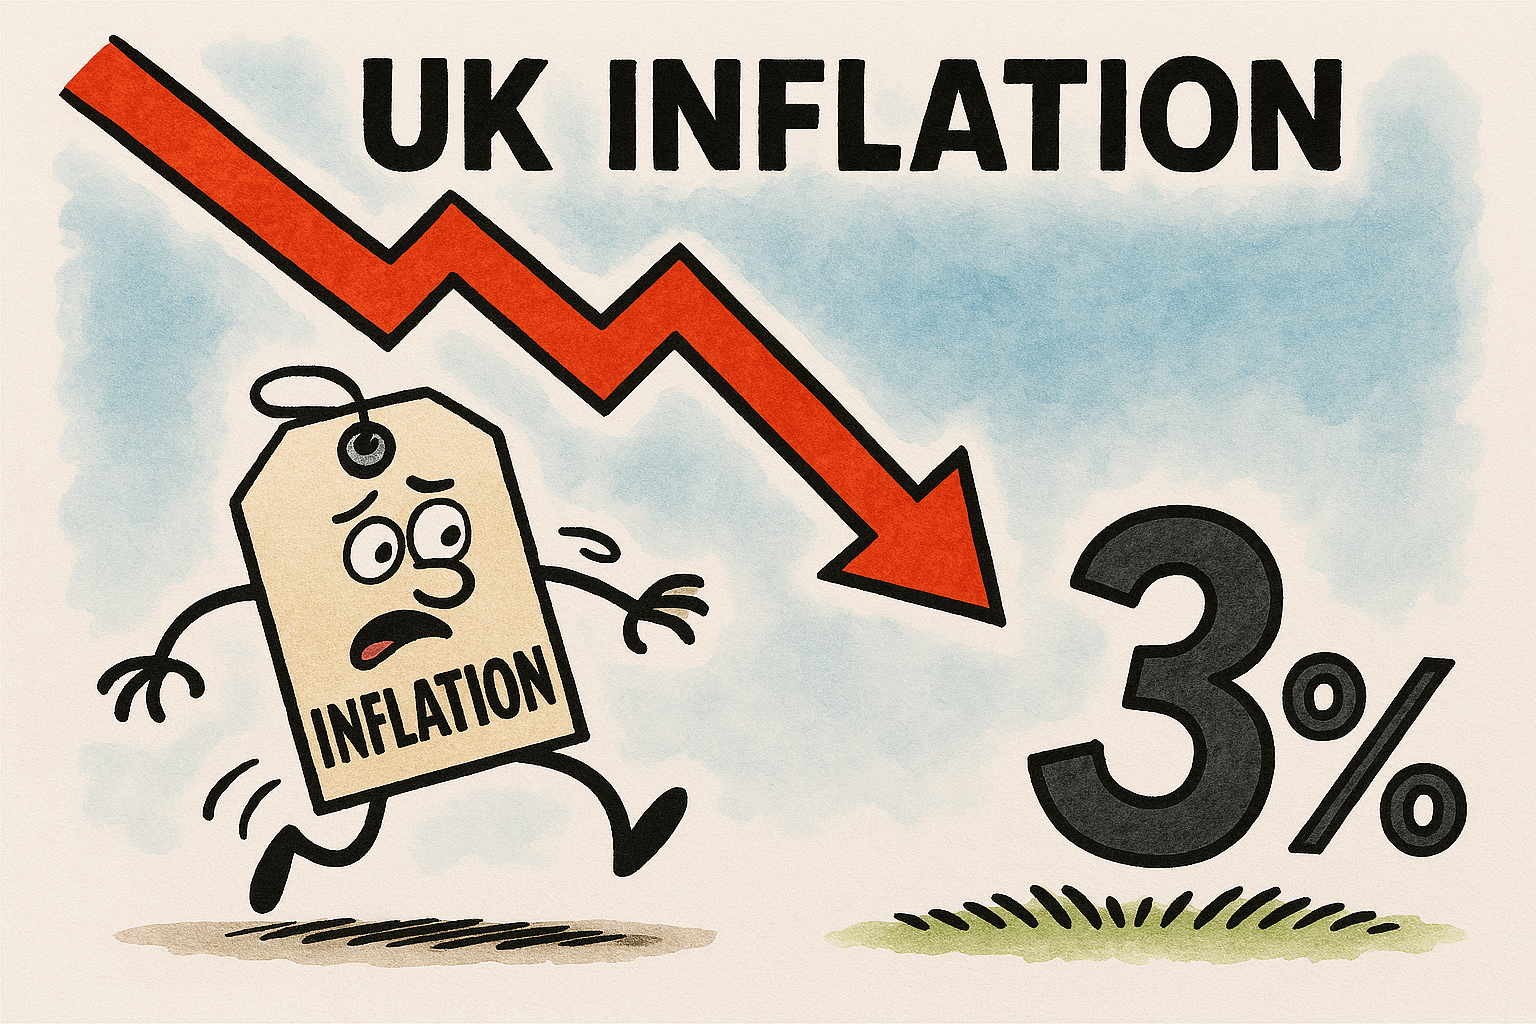
The UK’s inflation rate has dropped to 3%, its lowest level since March last year, renewing expectations that the Bank of England (BoE) may soon begin cutting interest rates.
The fall, recorded in January, marks a clear reversal from December’s unexpected uptick to 3.4% and reinforces the broader downward trend seen in late 2025.
Economists note that easing petrol, food, and airfare prices have been key contributors to the decline, helping inflation move closer to the government’s 2% target.
Bank of England easier decision
The BoE has held Bank Rate at 3.75% in recent meetings, emphasising the need for confidence that inflation will not only reach 2% but remain there sustainably.
However, with inflation now falling faster than previously forecast, policymakers appear to have greater room to consider loosening monetary policy later this spring.
The Bank itself has acknowledged that inflation is likely to return to target ‘a bit quicker than previously forecast’, suggesting scope for cuts if economic conditions evolve as expected.
Rate reduction likely in March or April 2026
Market analysts increasingly anticipate a rate reduction as early as March or April, particularly as wage growth cools and unemployment edges higher—factors that reduce domestic inflationary pressure.
For households and businesses, a cut would offer welcome relief after two years of elevated borrowing costs, potentially lowering mortgage rates and improving credit conditions.
While the BoE remains cautious, the latest inflation figures strengthen the case for a shift towards easing—signalling that the long, difficult climb down from the inflation peak may finally be nearing its conclusion.
As expected
Most economists and market analysts expected UK inflation to fall back to around 3% in the January release, down from 3.4% in December 2025.
UK inflation falls to 3%
This means the actual figure—3%—came in exactly in line with forecasts, rather than surprising to the downside or upside.
That alignment matters for the Bank of England because it reinforces the sense that inflation is easing broadly as expected, rather than stalling or re‑accelerating.
Employment data
Alongside falling inflation, the Bank of England is closely watching UK labour market data, which remains a key factor in its interest rate decisions.
Recent figures show wage growth is easing, with average earnings excluding bonuses rising at a slower pace—now below 6%—while job vacancies continue to decline.
This softening suggests that domestic inflationary pressure from pay settlements may be waning, giving the Bank more confidence that inflation can return to target sustainably.
However, unemployment remains low, and services inflation is still sticky, meaning policymakers are likely to weigh jobs data carefully before committing to rate cuts.
If wage growth continues to moderate and employment weakens further, the case for easing monetary policy will strengthen.
This marks the second consecutive cut in 2025 amid economic uncertainty and a government data blackout.
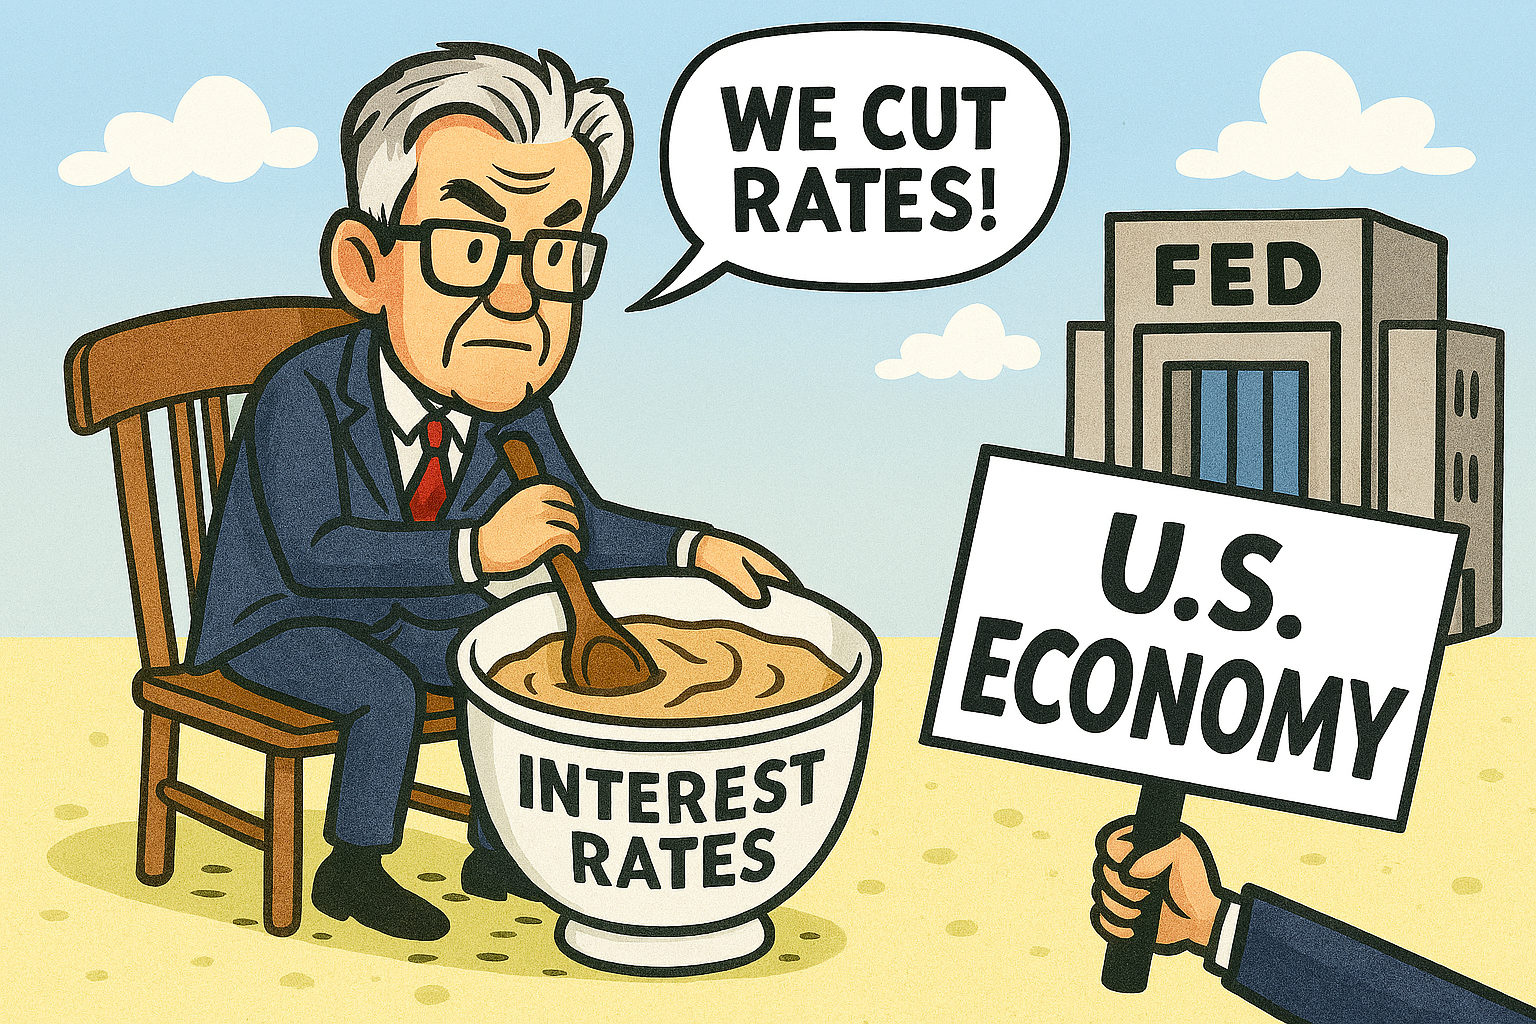
In a move aimed at supporting growth, the Federal Reserve reduced its benchmark interest rate by 0.25% following its October policy meeting.
The decision, reportedly backed by a 10–2 vote from the Federal Open Market Committee, reflects growing concern over a weakening labour market and subdued consumer confidence.
Chair Jerome Powell acknowledged the challenges posed by the ongoing U.S. government shutdown, which has delayed key economic reports.
With official data frozen, the Fed relied on private indicators showing a slowdown in hiring and modest inflation. The Consumer Price Index rose just 3% year-on-year, below the Fed’s long-term target.
While the rate cut aims to ease borrowing costs and stimulate investment, Powell cautioned against assuming further reductions in December.
He emphasised that future decisions would depend on incoming data and evolving risks. It is not a done deal.
The Fed also announced plans to end quantitative tightening (QT) by 1st December 2025, signalling a broader shift towards monetary easing.
Markets responded cautiously, with investors weighing the implications for growth, inflation, and the Fed’s credibility.
Markets, after a short rally during the week, were subdued after the announcement.
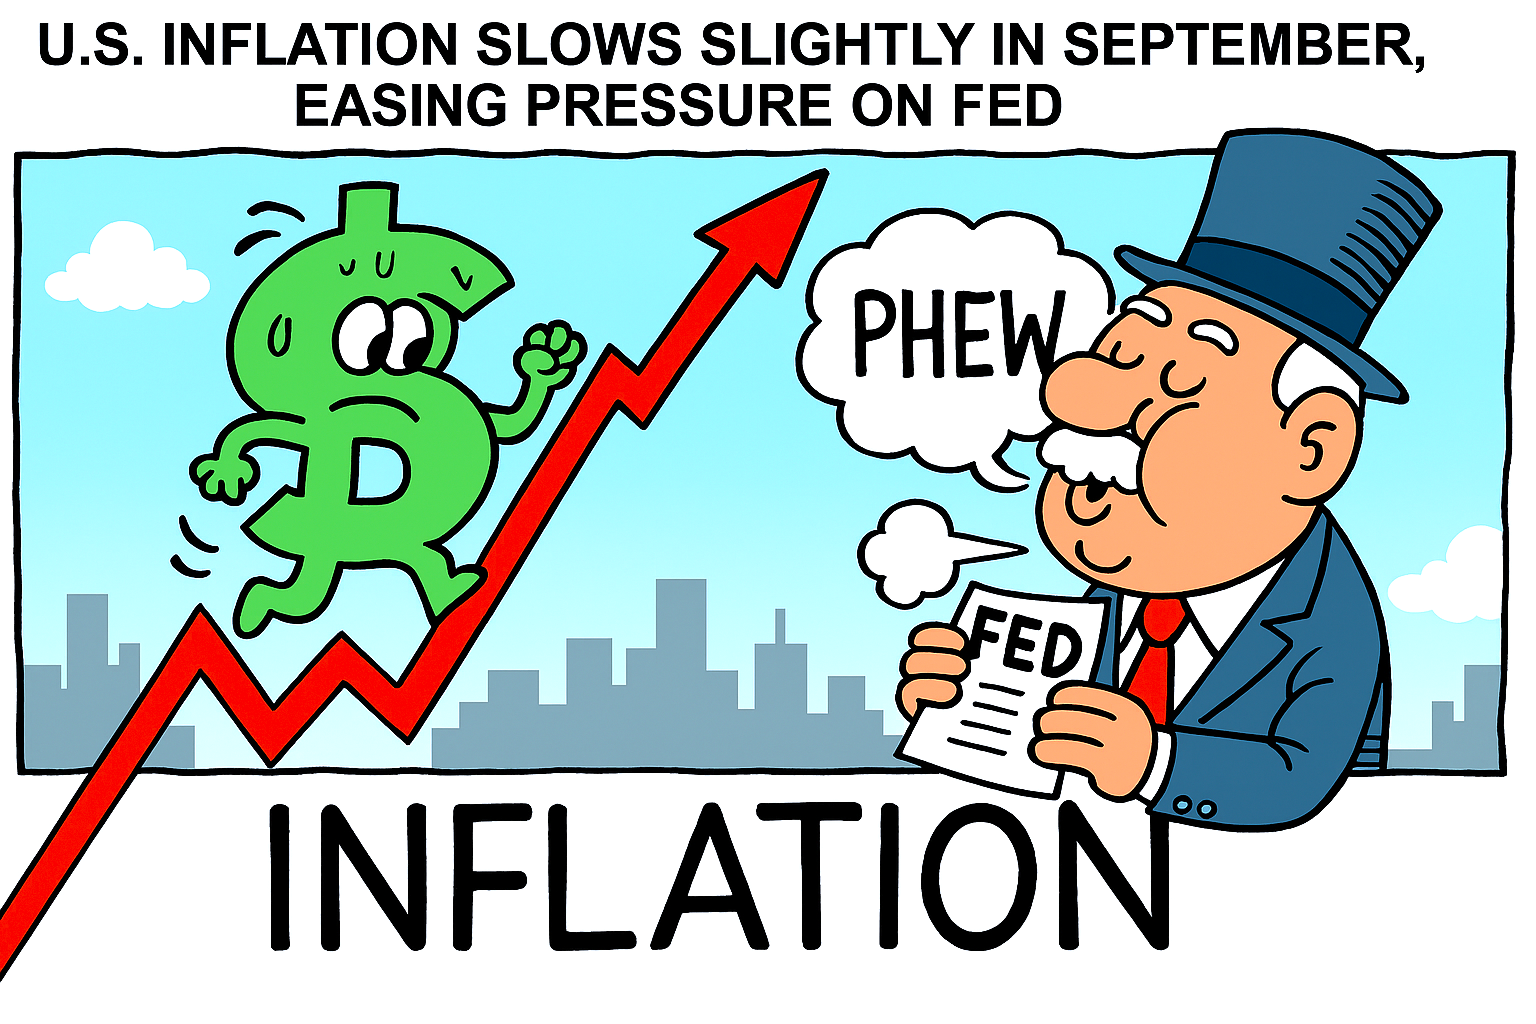
The latest U.S. inflation figures show a modest increase in consumer prices. The annual rate rose to 3.0% in September 2025, up from 2.9% in August. 2025.
Core inflation—which excludes volatile food and energy prices—also rose by 0.2% in September. This brought the year-on-year rate to 3.0%, again undercutting forecasts of 3.1%.
A notable contributor to the headline figure was a 4.1% surge in petrol prices. This offset declines in other areas such as used vehicles and household furnishings.
Federal Reserve
The data arrives just ahead of the Federal Reserve’s next policy meeting, where a 0.5% rate cut is widely anticipated. Softer inflation readings have buoyed market sentiment, with futures posting gains on hopes of looser monetary policy.
Despite a partial government shutdown, the inflation report was released on schedule, underscoring its significance for financial markets and policymakers.
With inflation now hovering near the Fed’s target, attention turns to wage growth and consumer spending as key indicators of future price stability.
The next CPI update is due mid-November.
This CPI news added to the possibility of a Fed rate cut in conjunction to the possibility of a U.S. China ‘tariff trade’ deal and relaxation of Rare Earth material sales pushed markets to new all-time highs!
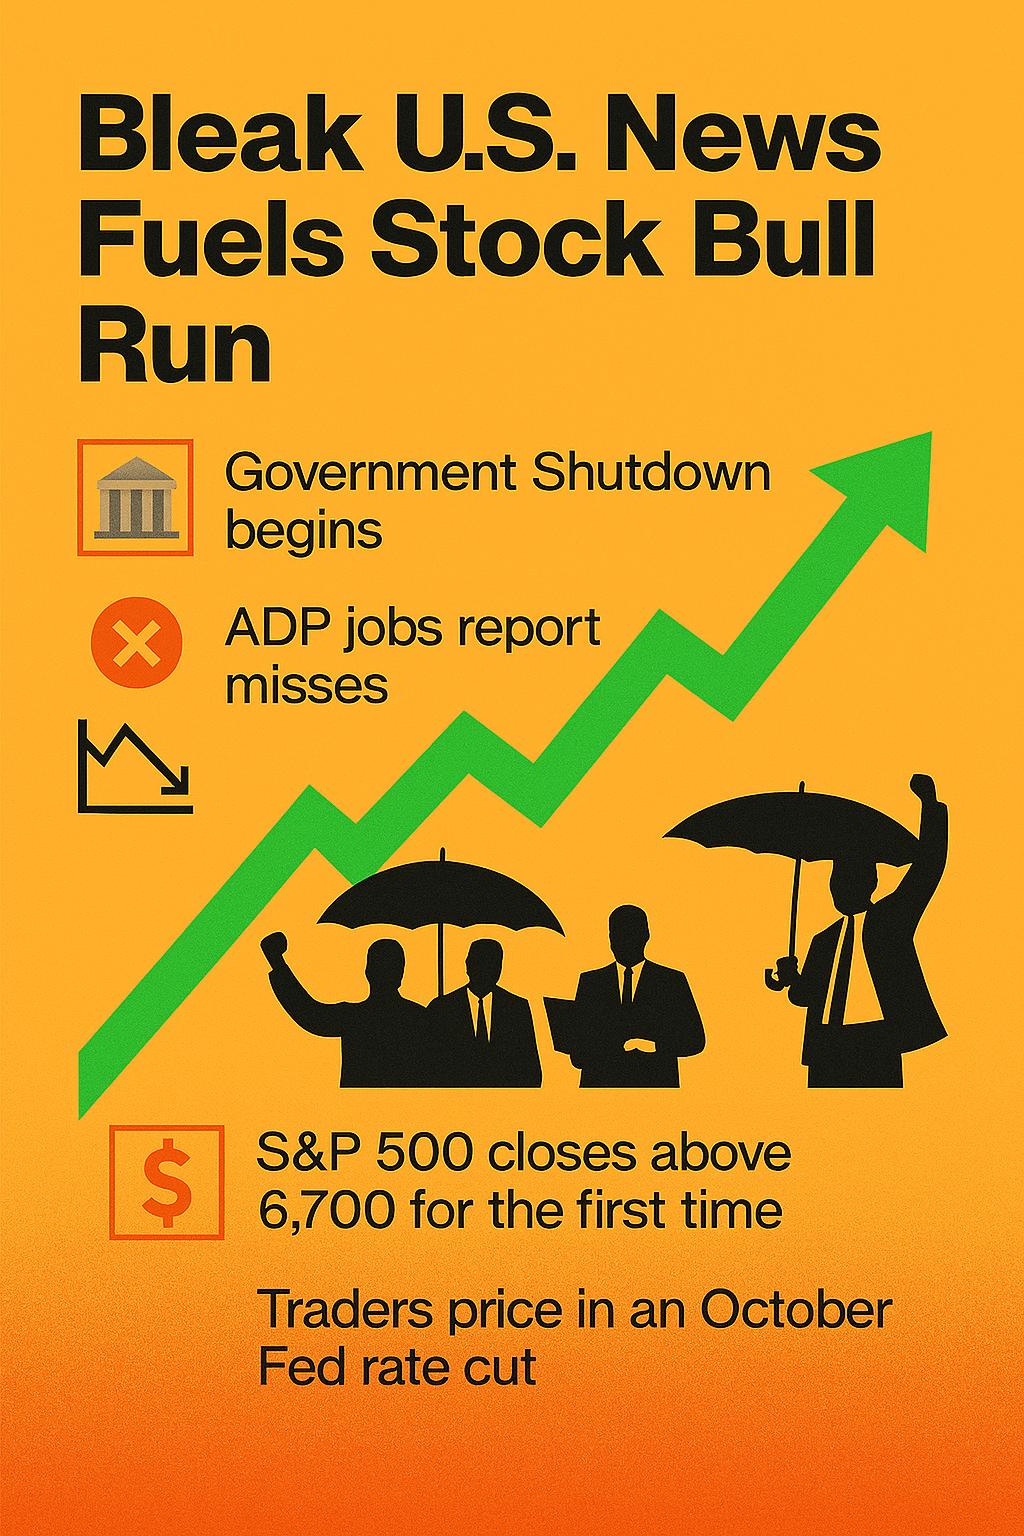
It’s one of those classic Wall Street paradoxes—where bad news somehow fuels bullish momentum. What’s going on?
News round-up
S&P 500 closes above 6,700 after rising 0.34%. Samsung and SK Hynix join OpenAI’s Stargate. Taiwan rejects U.S. proposal to split chip production. Trump-linked crypto firm plans expansion. Some stocks that doubled in the third quarter.
Bleak Headlines vs. Market Optimism
U.S. Government Shutdown: The federal government ground to a halt, but markets didn’t flinch. In fact, the S&P 500 rose 0.34% and closed above 6,700 for the first time.
ADP Jobs Miss: Private payrolls fell by 32,000 in September 2025, a sharp miss – at least compared to the expected 45,000 gain. Yet traders shrugged it off as other bad news is shrugged off too!
Fed Rate Cut Hopes: Weak data often fuels expectations that the Federal Reserve will cut interest rates. Traders are now betting on a possible cut in October 2025, which tends to boost equities.
Historical Pattern: According to Bank of America, the S&P 500 typically rises ~1% in the week before and after a government shutdown. So, this isn’t unprecedented—it’s almost ritualistic at this point.
Why the Market’s Mood Diverges
Animal Spirits: Investors often trade on sentiment and positioning, not just fundamentals. If they believe the Fed will ease policy, they’ll buy risk assets—even in the face of grim news.
Data Gaps: With the Bureau of Labor Statistics’ official jobs report delayed due to the shutdown, the ADP report gains more weight. But it’s historically less reliable, so traders may discount it.
Tech Tailwinds: AI stocks and semiconductor news (e.g., Samsung and SK Hynix joining OpenAI’s Stargate) are buoying sentiment, especially in Asia-Pacific markets.
U.S. Government Shutdown October 2025
Prediction
Traders in prediction markets are betting the shutdown will last around two weeks. Nothing too radical, since that’s the average length it takes for the government to reopen, based on data going back to 1990.
The government stoppage isn’t putting the brakes on the stock market momentum. Are investors getting too adventurous?
History shows the pattern is not new. The S&P 500 has risen an average of 1% the week before and after a shutdown, according to data from BofA.
Even the ADP jobs report, which missed expectations by a wide margin, did little to subdue the animal spirits.
Private payrolls declined by 32,000 in September 2025, according to ADP, compared with a 45,000 increase reportedly estimated by a survey of economists.
Payroll data
The Bureau of Labor Statistics’ (BLS) official nonfarm payrolls report is now stuck in bureaucratic purgatory and likely not being released on time.
The U.S. Federal Reserve might place additional weight on the ADP report — though it’s not always moved in sync with the BLS numbers. Traders expect weak data would prompt the Fed to cut interest rates in October 2025.
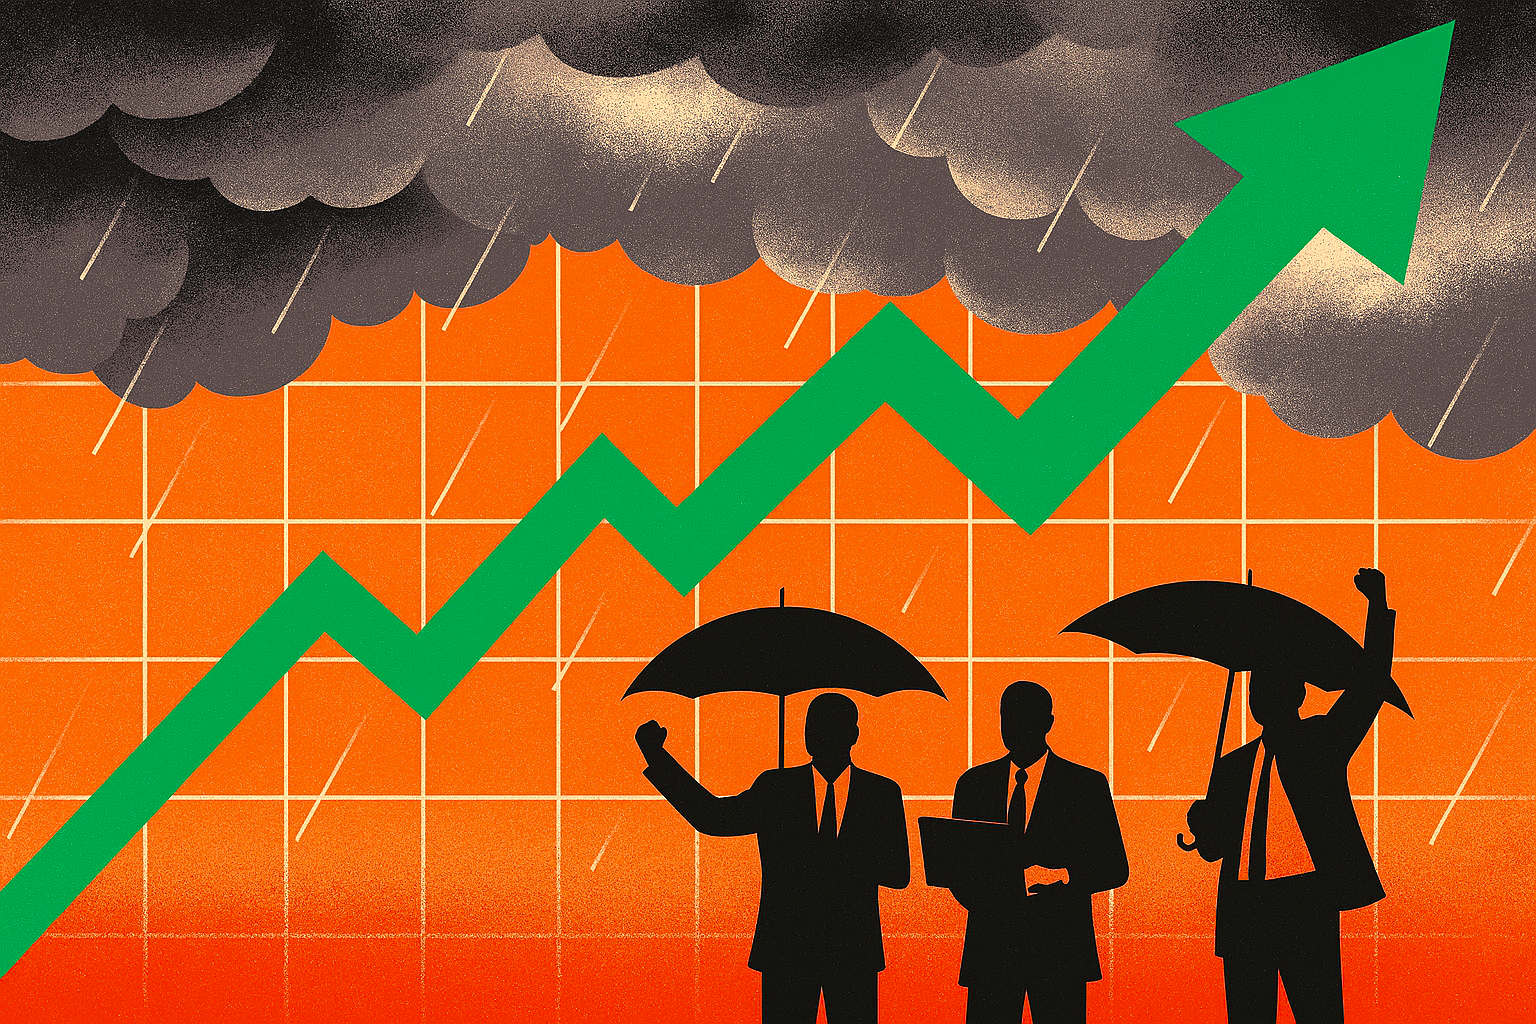
It’s a bit like watching a storm roll in while the crowd cheers for sunshine—markets are forward-looking, and sometimes they see silver linings where others see clouds.
Summary
Event
Detail
🏛️ Government Shutdown
Began Oct 1, 2025. Traders expect ~2 weeks based on historical average
📉 ADP Jobs Report
Private payrolls fell by 32,000 vs. expected +45,000
📈 S&P 500 Close
Rose 0.34% to close above 6,700 for the first time
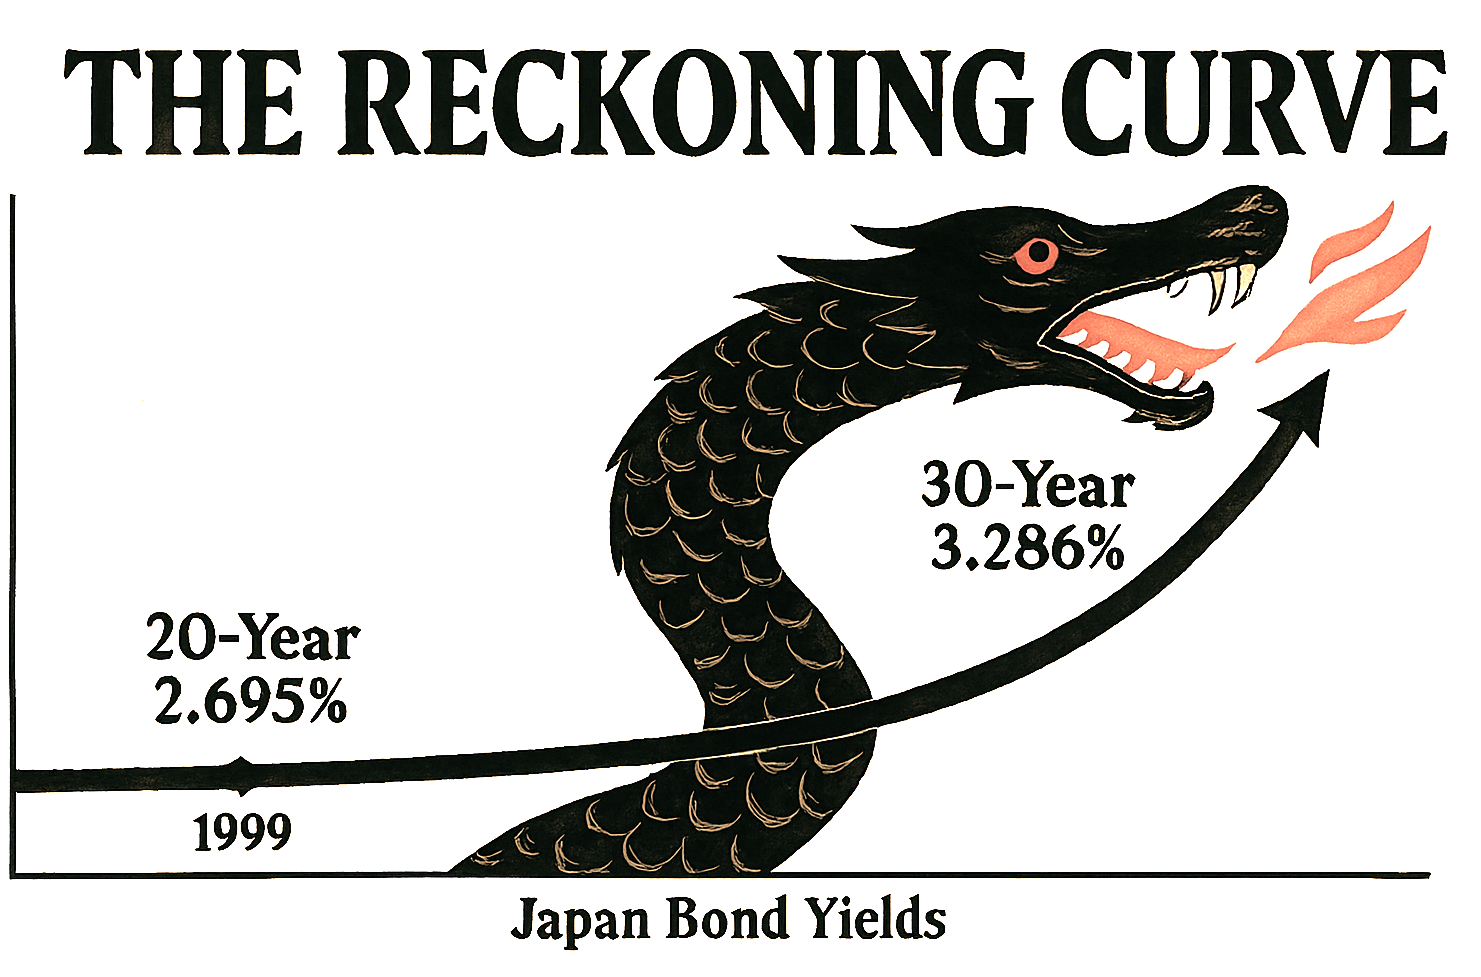
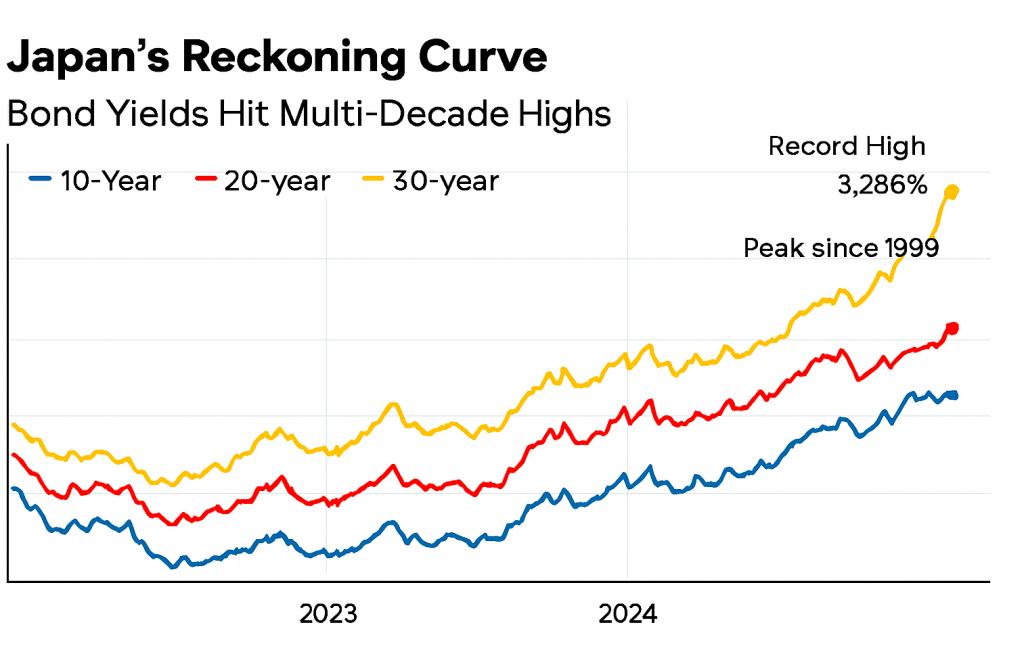
After decades of economic sedation, Japan’s long-term bond yields are rising with a vengeance.
The 30-year government bond has breached 3.286%—its highest level on record—while the 20-year yield has climbed to 2.695%, a peak not seen since 1999.
These aren’t just numbers; they’re seismic signals of a nation confronting its delayed past, now its deferred future.
Indicative Yield Curve for Japan
For years, Japan’s yield curve was a monument to inertia. Negative interest rates, yield curve control, and relentless bond-buying by the Bank of Japan created an artificial calm—a kind of economic Zen garden, raked smooth but eerily still.
That era is ending. Inflation has persisted above target for three years, and the BOJ’s retreat from monetary intervention has unleashed market forces long held at bay.
This steepening curve is more than financial recalibration—it’s a symbolic reckoning. Rising yields demand accountability: from policymakers who masked structural fragility, from investors who chased safety in stagnation, and from a society that postponed hard choices on demographics, debt, and productivity.
The bond market, once a passive witness, now acts as judge. Each basis point is a moral verdict on Japan’s economic past.
The shadows of the Lost Decades—deflation, aging populations, and overspending—are being dispelled not by command, but through the process of price discovery.
In this new era, Japan’s yield curve resembles a serpent uncoiling—no longer dormant but rising with intent.
The question isn’t whether the curve will flatten again, but whether Japan can meet the moment it has long delayed.
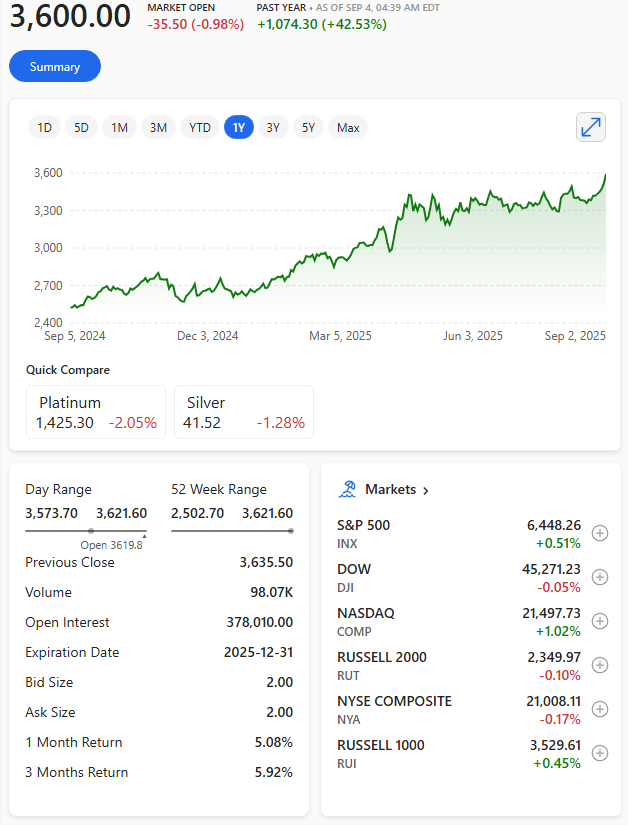
Gold’s recent surge—hitting over $3,550 per ounce (4th September 2025)—isn’t just a speculative blip.
It’s a convergence of deep structural shifts and short-term catalysts that are reshaping how investors, central banks, and governments think about value and stability.
Here’s why
🧭 Strategic Drivers (Long-Term Forces)
Central Bank Buying: Nearly half of surveyed central banks reportedly plan to increase gold reserves through 2025, citing inflation hedging, crisis resilience, and reduced reliance on the U.S. dollar.
Dollar Diversification: After Western sanctions froze Russia’s reserves in 2022, many countries began reassessing their exposure to dollar-denominated assets.
Fiscal Expansion & Debt Concerns: With U.S. debt surpassing $37 trillion and new legislation adding trillions more, gold is seen as a hedge against long-term dollar instability.
⚡ Tactical Catalysts (Short-Term Triggers)
Geopolitical Tensions: Ongoing wars, trade disputes, and questions around Federal Reserve independence have heightened uncertainty, boosting gold’s ‘fear hedge’ appeal.
Interest Rate Expectations: The Fed has held rates steady, but markets anticipate cuts. Lower yields make non-interest-bearing assets like gold more attractive.
Weakening U.S. Dollar: The dollar’s decline against the euro and yen has made gold cheaper for foreign buyers, increasing global demand.
ETF Inflows & Retail Demand: Physically backed gold ETFs saw their largest first-half inflows since 2020, while bar demand rose 10% in 2024.
Gold isn’t just a commodity—it’s a referendum on trust. When institutions wobble and currencies lose their shine, gold becomes the narrative anchor: a timeless, tangible vote of no confidence in the system.
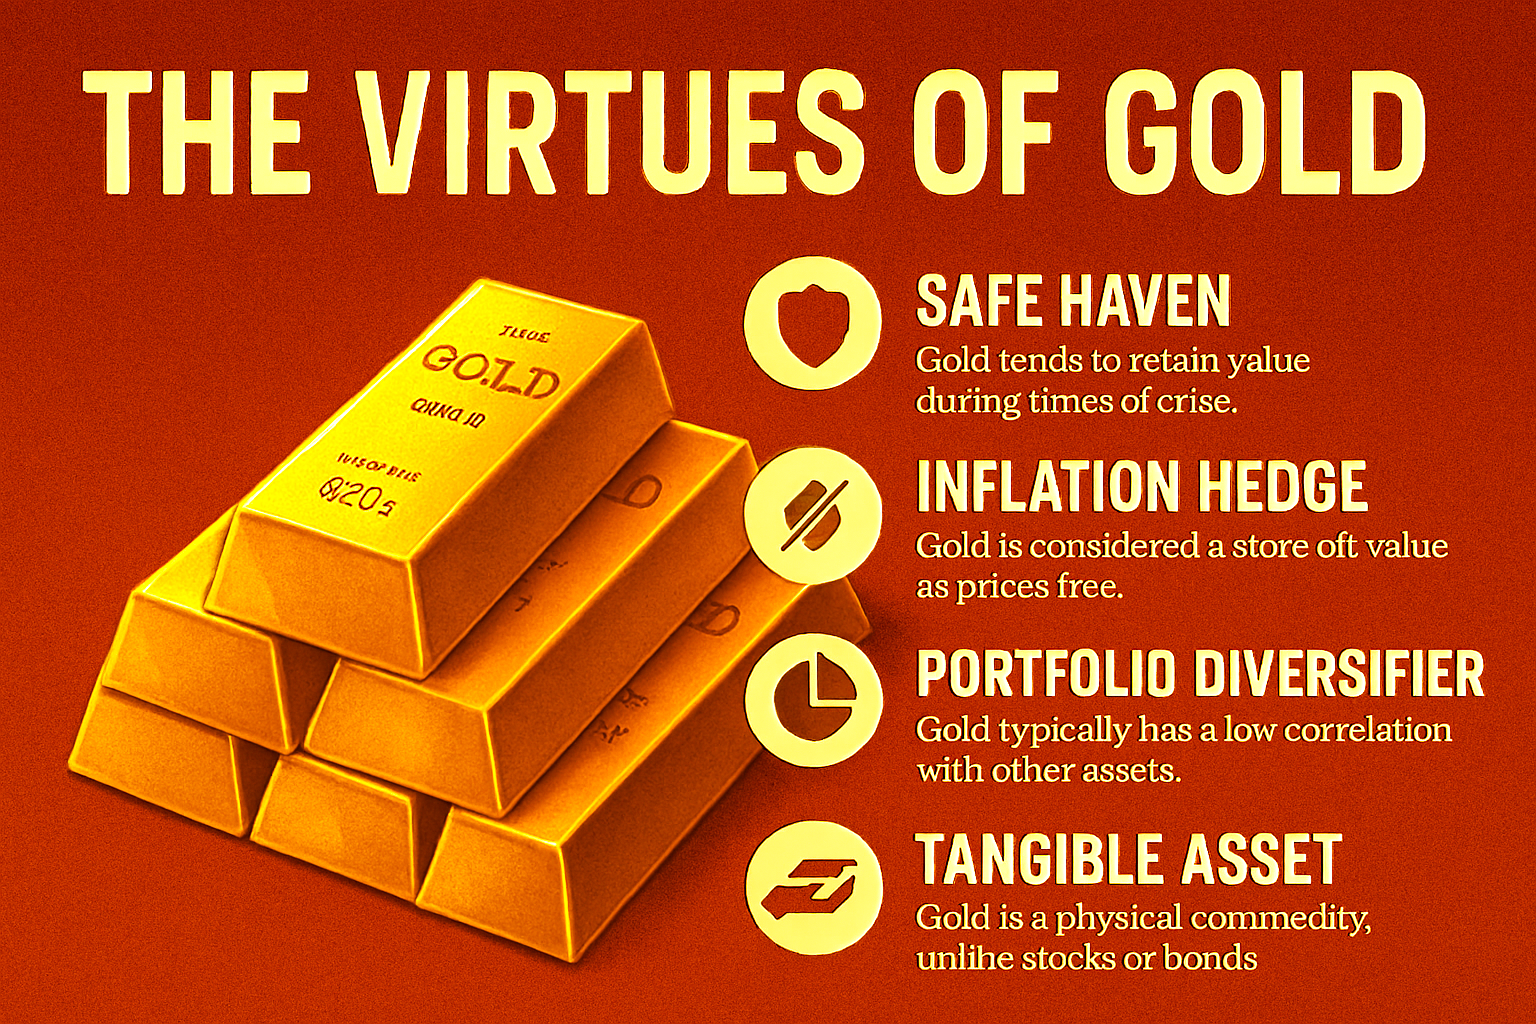
Summary
🛡️ Safe Haven: Retains value during crisis.
📈 Inflation Hedge: Preserves purchasing power.
🧩 Portfolio Diversifier: Low correlation with other assets.
✋ Tangible Asset: Physical, unlike stocks or bonds.
On 7th August 2025, the Bank of England’s Monetary Policy Committee voted narrowly—5 to 4—in favour of reducing the base interest rate by 0.25% to 4%, marking its lowest level since March 2023.
This is the fifth rate cut in a year, aimed at stimulating growth amid sluggish GDP and persistent inflation, which currently stands at 3.6%.
Governor Andrew Bailey reportedly described the decision as part of a ‘gradual and careful’ easing strategy, balancing inflation risks with signs of a softening labour market.
While some committee members reportedly advocated for a larger cut, others urged caution, reflecting deep divisions over the UK’s economic trajectory.
The move is expected to ease borrowing costs for homeowners and businesses, with tracker mortgage rates falling immediately. However, savers will be losing out as rates continue to drop.
However, analysts warn that future cuts may hinge on upcoming fiscal decisions and inflation data, leaving the path forward uncertain.
There are increasingly credible signs that U.S. stocks may be heading into a deeper adjustment phase.
Here’s a breakdown of the key indicators and risks that suggest the current stumble could be more than a seasonal wobble. It’s just a hypothesis, but…
S&P 500 clinging to its 200-day moving average: While the long-term trend remains intact, short-term averages (5-day and 20-day) have turned negative.
Volatility Index (VIX) rising: A 7.61% surge in the 20-day average VIX suggests growing unease, even as prices remain elevated.
Diverging ADX readings: The S&P 500’s ADX (trend strength) is weak at 7.57, while the VIX’s ADX is strong at 45.37—classic signs of instability brewing.
🧠 Sentiment & Positioning: Optimism with Defensive Undercurrents
Investor sentiment is bullish (40.3%), but rising put/call ratios and a complacent Fear & Greed Index hint at hidden caution.
Historical parallels: Similar sentiment setups preceded corrections in 2021 and 2009. We’re not at extremes yet, but the complacency is notable.
🌍 Macroeconomic Risks: Tariffs, Fed Policy, and Structural Headwinds
Tariff escalation: Trump’s recent executive order raised effective tariffs to 15–20%, with new duties on rare earths and tech-critical imports.
Labour market weakening: July’s jobs report showed just 73,000 new jobs, with massive downward revisions to prior months. Unemployment ticked up to 4.2%.
Fed indecision: The central bank is split, with no clear path on rate cuts. This uncertainty is amplifying volatility.
Structural drag: Reduced immigration and R&D funding are eroding long-term growth potential.
🛡️ Strategic Implications: How Investors Are Hedging
Defensive sectors like utilities, healthcare, and gold are gaining traction.
VIX futures and Treasury bonds are being used to hedge against volatility.
Emerging markets with trade deals (e.g., Vietnam, Japan) may outperform amid global realignment.
🗓️ Seasonal Weakness: August and September Historically Slump
August is the worst month for the Dow since 1988, and the second worst for the S&P 500 and Nasdaq.
Wolfe Research reportedly notes average declines of 0.3% (August) and 0.7% (September) since 1990.
While the broader market still shows resilience—especially in mega-cap tech—the underlying signals point to fragility.
Elevated valuations, weakening macro data, and geopolitical uncertainty are converging. A deeper correction isn’t guaranteed, but the setup is increasingly asymmetric: limited upside, growing downside risk.
It looks like investor sentiment is shifting away from obsessing over tariffs—though not because they’ve disappeared.
Instead, there’s a growing sense that tariffs may be settling into a predictable range, especially in the U.S., where President Trump signalled a blanket rate of 15–20% for countries lacking specific trade agreements.
Here’s how that’s playing out
🌐 Why Investors Are Moving On
Predictability over Panic: With clearer expectations around tariff levels, markets may no longer treat them as wildcards.
Muted Market Reaction: The recent U.S.-EU trade deal barely nudged the S&P 500 or European indexes after moving the futures initially, signalling tariffs aren’t the hot trigger they once were.
Economists Cooling Expectations: Revisions to tariff impact estimates suggest future trade deals might not generate outsized optimism on Wall Street.
📈 Effects on the Markets
Focus Shift: Investors are turning to earnings—particularly from the ‘Magnificent Seven’ tech giants—and macroeconomic data for momentum.
Cautious Optimism: While stocks haven’t rallied hard, they’re not dropping either. Traders seem to be waiting for a new catalyst, like U.S. consumer strength or signs of a bull phase in certain indexes.
Geopolitical Undercurrents: A new deadline for Russia to reach a peace deal and threats of ‘secondary tariffs’ could still stir volatility, depending on how global partners react.
So, in short tariffs aren’t gone, but they’ve become background noise. Investors are tuning in to the next big signals.
If you’re keeping an eye on retail, tech earnings, or commodity flows, this shift could have ripple effects worth dissecting.
The Bank of England has cut interest rates by 25 basis points to 4.25% on 8th May 2025 marking its fourth reduction since August 2023.
The decision, backed by a majority of the Monetary Policy Committee, reflects easing inflation pressures and a need to support economic growth.
Inflation, currently at 2.6%, is expected to rise temporarily to 3.5% due to household bill increases.
The cut will provide relief to homeowners and businesses facing high borrowing costs.
However, policymakers remain cautious, balancing growth stimulation with inflation control. Markets anticipate further cuts, potentially bringing rates down to 3.25% by year-end.
The Federal Reserve held its key interest rate steady at 4.25% – 4.50% on 7th May 2025, citing economic uncertainty and the potential impact of tariffs.
Fed Chair Jerome Powell emphasised that the central bank is in wait-and-see mode, monitoring inflation and employment risks.
The decision follows concerns that Trump’s trade policies could lead to stagflation, with rising prices and slowing growth.
While markets reacted positively, analysts remain divided on whether the Fed will cut rates later this year.
Powell stated that future adjustments will depend on evolving economic conditions and the balance of risks.
Trump’s take on this decision was reportedly to call Powell… a fool.
What is stagflation?
Stagflation is an economic condition where high inflation, stagnant economic growth, and high unemployment occur simultaneously.
It presents a challenge for policymakers because measures to reduce inflation can worsen unemployment, while efforts to boost growth may fuel inflation further.
The U.S. economy shrank by 0.3% in the first quarter of 2025, marking the first contraction since early 2022.
The decline was largely driven by a surge in imports, which soared 41.3%, as businesses rushed to stockpile goods ahead of President Donald Trump’s newly imposed tariffs. Imports subtract from GDP calculations, contributing to the negative growth figure.
Despite the contraction, consumer spending remained positive, increasing 1.8%, though at a slower pace than previous quarters. Private domestic investment also saw a sharp rise of 21.9%, fueled by a 22.5% increase in equipment spending, likely influenced by tariff concerns.
The Federal Reserve faces a complex decision ahead of its upcoming policy meeting. While the negative GDP growth may push the central bank toward interest rate cuts, inflation remains a concern, with the U.S. Personal Consumption Expenditures (PCE) price index rising 3.6% for the quarter.
Markets reacted cautiously, with stock futures slipping and Treasury yields climbing. As the Trump administration navigates trade negotiations, economists warn that continued uncertainty could weigh on future growth prospects.
Bank of England cuts interest rates to 4.5% amid economic slowdown
The Bank of England announced a reduction in its benchmark interest rate from 4.75% to 4.5%, marking the third cut since August 2024.
This decision comes as a response to the ongoing economic challenges facing the UK, including sluggish growth and concerns about the potential effect of Trump’s tariffs.
The primary reason behind this rate cut is the Bank’s effort to stimulate economic activity by making borrowing cheaper.
With the cost of borrowing now at its lowest level since June 2023, homeowners with variable rate or tracker mortgages will see immediate relief, with monthly repayments expected to decrease by approximately £29 per month on an average mortgage.
Small businesses, which have been struggling under heavy borrowing burdens, are also expected to benefit from this move.
Growth concerns linger
The Bank’s decision follows a series of disappointing economic indicators. The latest GDP figures showed that the economy only grew by 0.1% in November 2024, falling short of economists’ forecasts.
This sluggish growth, coupled with two months of falling output, has led the Bank to revise its growth forecast for 2025 downward.
The Bank now anticipates no growth during the fourth quarter of the year, and some economists are predicting as many as six rate cuts this year, potentially bringing the rate down to 3.25%.
While the rate cut is expected to provide some relief to borrowers, it also raises concerns about the long-term impact on savings and investment. With interest rates at historic lows, savers may find it challenging to earn meaningful returns on their deposits.
Additionally, the low-interest rate environment could encourage excessive borrowing and lead to asset bubbles, posing risks to financial stability. Has inflation finished?
The Bank of England’s decision to cut interest rates to 4.50% is a strategic move aimed at boosting economic activity and providing relief to businesses and homeowners.
The UK inflation rate has gone up for the second month in a row, rising at the fastest pace since March 2024. The UK inflation rate rose to 2.6% in the year to November 2024, according to official figures.
However, the rise was predicted by economists and was apparently within the range of the expected increase anticipated.
Fuel and clothing were significant contributors to the increase. Additionally, rising ticket prices for concerts and theatrical performances played a role according to data from the Office for National Statistics (ONS).
The Bank of England raises interest rates to maintain inflation at its target of %. The next rate decision is on Thursday 19th December 2024 and economists anticipate that rates will remain at 4.75%.
Prices for food and non-alcoholic drinks, alcohol and tobacco, and footwear all rose at a faster pace last month.
A wider measure of inflation showed housing and household services costs, including rent, rose by 3.5%.
The Personal Consumption Expenditures (PCE) price index announced 27th November 2025, rose by 0.2% monthly, matching a 12-month inflation rate of 2.3%, aligning with expectations.
Core U.S. inflation recorded more robust figures, climbing 0.3% monthly and reaching an annual rate of 2.8%, but also in accordance with forecasts.
Consumer spending increased by 0.4% monthly, as expected, while personal income surged by 0.6%, exceeding the estimated 0.3%.
The Federal Reserve is now likely searching for economic clues on how to proceed at its next interest rate meeting.
The inflation rate, which measures price changes, hit 2.3% in the year to October 2024, a bigger-than-expected increase from 1.7% in September 2024.
The increase was in part due to an increase in the regulator-set energy price cap that took effect in October 2024, which is expected to increase energy price inflation through the winter.
The Office for National Statistics (ONS), said while higher energy costs had contributed, this increase was offset by falls in live music and theatre ticket prices.
The Bank of England cut interest rates by 0.25% Thursday 7th November 2024, even as Labour’s budget announcement confuses the outlook for future policy easing.
The anticipated reduction, marking the central bank’s second this year, lowers the key rate to 4.75%.
Financial markets had forecast a high probability of the quarter-point decrease at the November 2024 meeting, although analysts cautioned that future cuts might be postponed due to the Labour government’s tax-and-spend budget.
Investors are now awaiting remarks from Governor Andrew Bailey and his team regarding their updated economic forecast following the budget and the U.S. presidential election.
Inflation saw a modest rise in September 2024, edging closer to the Federal Reserve’s target, as reported by the Commerce Department on Thursday 31st October 2024.
The personal consumption expenditures (PCE) price index recorded a seasonally adjusted increase of 0.2% for the month, and the year-over-year inflation rate stood at 2.1%, aligning with predictions. The PCE index is the Fed’s preferred inflation measure, although officials monitor various other indicators as well.
The Fed aims for a 2% yearly inflation rate, a benchmark not met since February 2021.
Despite the main figure indicating that the central bank is approaching its objective, the inflation rate, excluding food and energy, was at 2.7%. This core inflation metric rose by 0.3% monthly, with the annual rate exceeding expectations by 0.1 percentage points.
This report arrives as markets strongly anticipate the Fed will reduce its benchmark short-term interest rate at the upcoming meeting. In September 2024, the Fed made a significant half-percentage-point rate cut, a rare action during an economic upturn.
Officials remain optimistic that inflation will realign with their target, yet they are wary about the labour market’s condition, even as most data suggests steady hiring and low layoff rates.
On Wednesday 23rd October 2024, the U.S. 10-year Treasury yield climbed again as traders considered recent remarks from Federal Reserve officials regarding the direction of interest rate reductions
The U.S. 10-year Treasury yield increased by over 0.030% to approximately 4.24%. The benchmark rate peaked at 4.26% during the session, its highest since July 2024. This surge followed a 12-basis point leap on Monday 21st and a rise above 4.2% on Tuesday 22nd.
The U.S. 2-year Treasury yield also rose, reaching 4.06%, up by roughly 0.030%. Earlier in the day, it achieved a high of 4.072%.
Yields and equity prices have an inverse relationship. A single basis point is equivalent to 0.01%
Elevated Treasury yields are exerting pressure on the equity market, causing U.S. stock futures to drop. This downturn follows the S&P 500‘s first consecutive loss since the beginning of September.
Despite a half-point reduction by the Federal Reserve in September 2024, strong economic indicators and concerns about the deficit have contributed to the increase in the 10-year Treasury yield.
Traders are worried that the central bank might be reluctant to lower rates further, even though the Fed predicted additional cuts amounting to half a point by the end of the year.
Federal Reserve Chair Jerome Powell recently stated that the latest half-percent reduction in interest rates should not be interpreted as a sign that future measures will be equally as aggressive.
The Fed suggests that subsequent adjustments will likely be more ‘modest’.
In his address, the central bank’s chief highlighted their goal to balance curbing inflation with maintaining a robust labour market, basing future decisions on data insights.
‘Moving forward, should the economy evolve as widely expected, our policy stance will progressively adjust towards neutrality. Yet, we are not bound to a fixed course,‘ he clarified during in his statement. ‘Risks are two-way, and our resolutions will be determined one meeting at a time.‘
The Federal Reserve believe, as noted in a recent update, that they are just millimetres away from that ‘elusive’ economic soft landing.
New Zealand’s central bank has reduced its benchmark interest rate by 0.50% points following its monetary policy meeting, resulting in a consecutive interest rate reduction
This decrease sets the Reserve Bank of New Zealand’s interest rate at 4.75%, down from 5.25%. Economists surveyed by Reuters had anticipated this move.
Previously in August, the RBNZ made an ‘unexpected’ interest rate cut of 25 basis points. The central bank indicated that the extent of future reductions would hinge on its confidence in maintaining a low inflation environment.
In a statement, the central bank stated that it ‘assesses that annual consumer price inflation is within its 1% to 3% inflation target range and converging on the 2 percent midpoint.“
New Zealand’s annual inflation rate reached 7.3% in the June quarter 2022, its highest level in over some 30 years. NZ inflation has since dropped to 3.3% as of June 2024, but still remains above the central banks medium term target range of between 1% and 3%.
Analysts are expecting a further cut in November 2024.