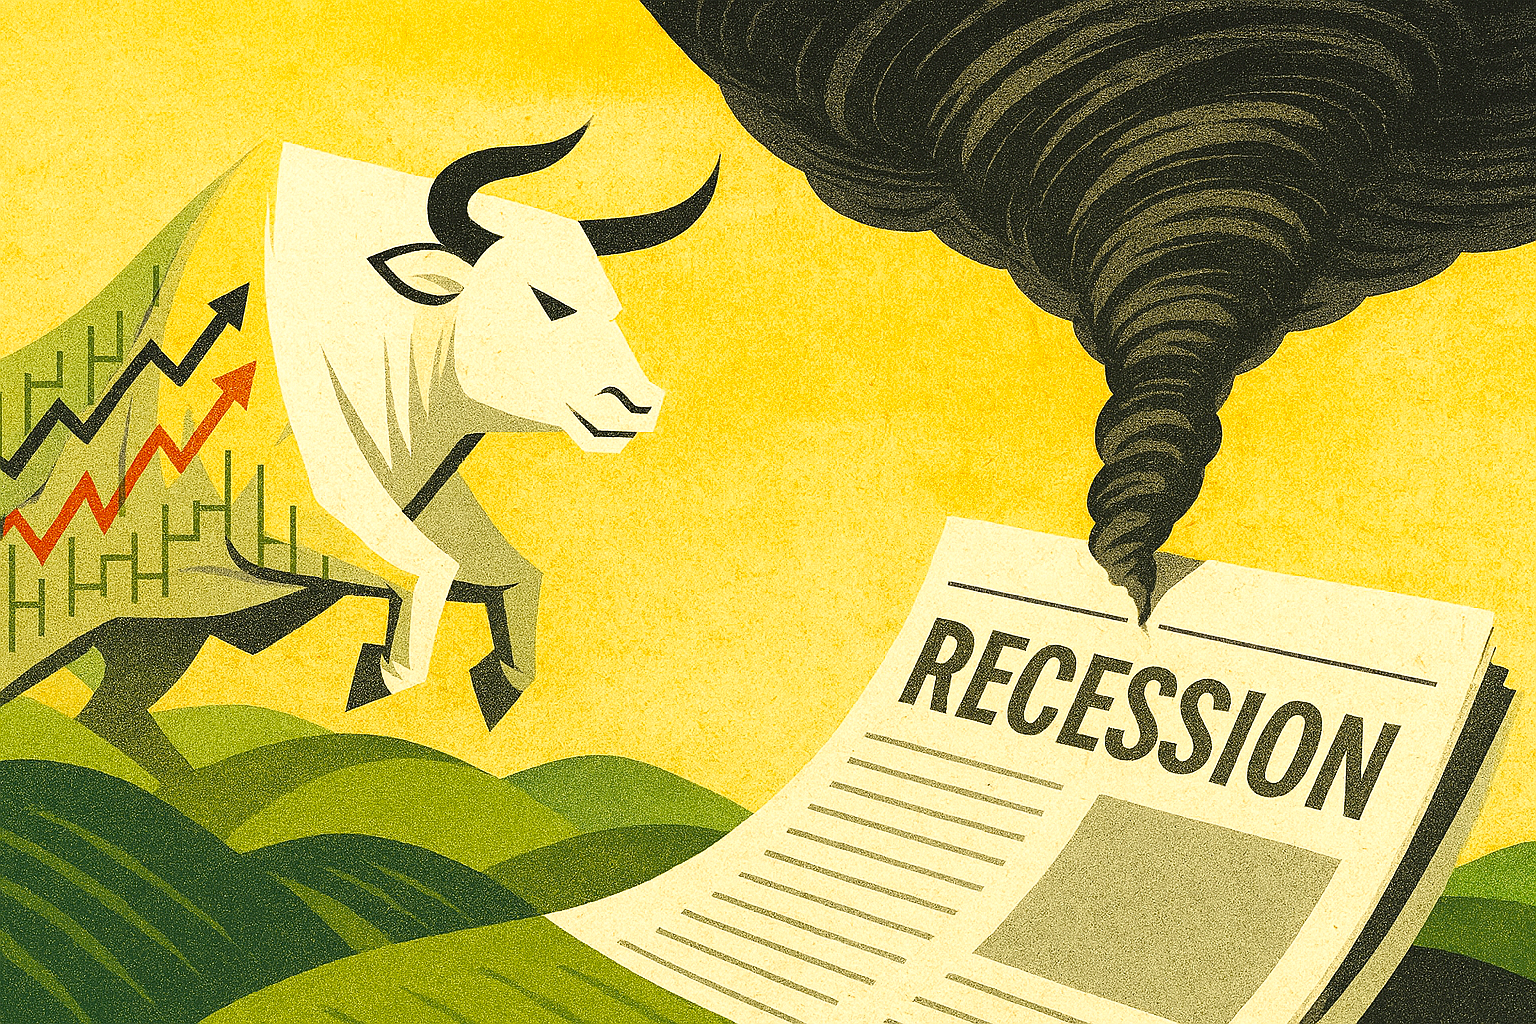
In the world of stock markets, few phenomena are as captivating—or as perilous—as bull runs and speculative bubbles.
Though often conflated, these two forces represent distinct psychological and financial dynamics that shape investor behaviour and market outcomes.
Bull Markets: Confidence with Momentum
A bull market is defined by sustained price increases across major indices. Typically driven by strong economic fundamentals, corporate earnings growth, and investor optimism.
In the U.S., iconic bull runs include the post-World War II expansion. The 1980s Reagan-era boom, and the tech-fuelled rally of the 2010s. The Dot-Com bull run, and subsequesnt crash is probably the most famous.
Bull markets feed on confidence: low interest rates, rising employment, and technological innovation often act as catalysts. Investors pile in, believing the upward trajectory will continue—sometimes for years.
But even bulls can lose their footing. When valuations stretch beyond reasonable earnings expectations, the line between bullish enthusiasm and irrational exuberance begins to blur.
Bubbles: Euphoria Untethered from Reality
A bubble occurs when asset prices inflate far beyond their intrinsic value. This is fuelled not by fundamentals but by speculation and herd mentality.
The dot-com bubble of the late 1990s is a textbook example. Companies with no profits—or even products—saw their valuations soar simply for having ‘.com’ in their name.
Similarly, the U.S. housing bubble of the mid-2000s was driven by easy credit and the belief that property prices could only go up.
Bubbles often follow a predictable arc: stealth accumulation, media attention, public enthusiasm, and finally, a euphoric peak.
When reality sets in—be it through disappointing earnings, regulatory shifts, or macroeconomic shocks—the bubble bursts! Leaving behind financial wreckage and a trail of disillusioned investors.
Spotting the Difference
While bull markets can be healthy and sustainable, bubbles are inherently unstable. The key distinction lies in valuation discipline.
Bulls are supported by earnings and growth; bubbles are driven by hype and fear of missing out (FOMO).
Tools like the cyclically adjusted price-to-earnings (CAPE) ratio and historical trend analysis can help investors discern whether they’re riding a bull or inflating a bubble.
📉 The Aftermath and Opportunity Ironically, the collapse of a bubble often sows the seeds for the next bull market. As excesses are purged and valuations reset, long-term investors find opportunities in the rubble.
The challenge lies in resisting the emotional extremes—greed during the rise, panic during the fall—and maintaining a clear-eyed view of value.
In markets, as in life, not every rise is rational, and not every fall is fatal
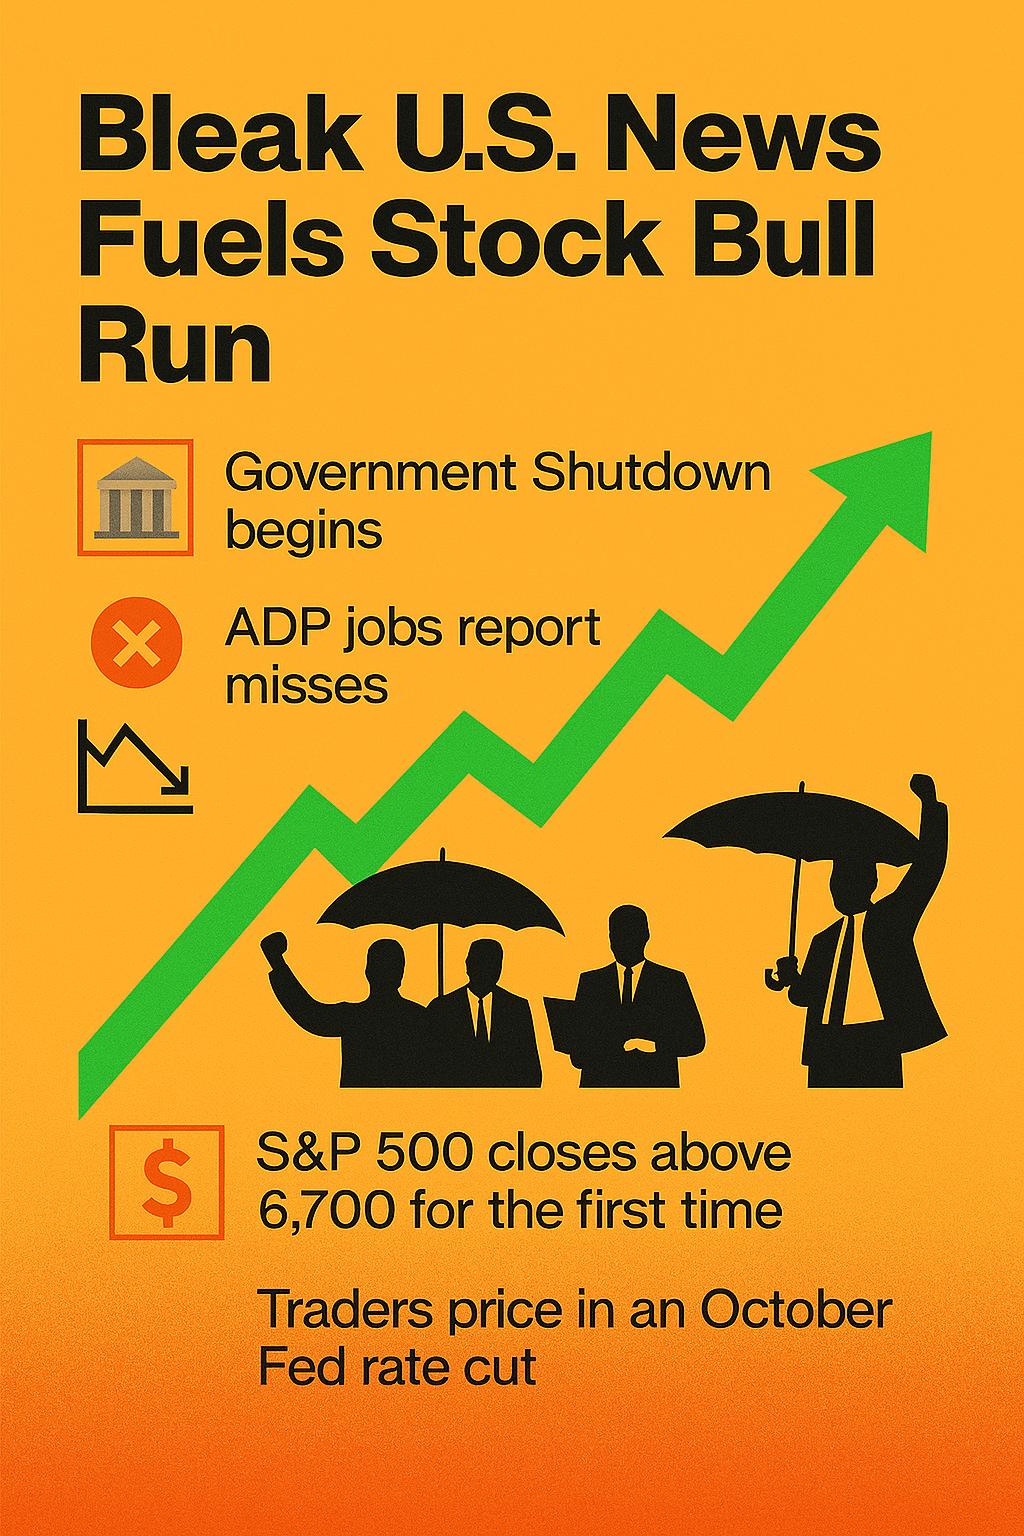
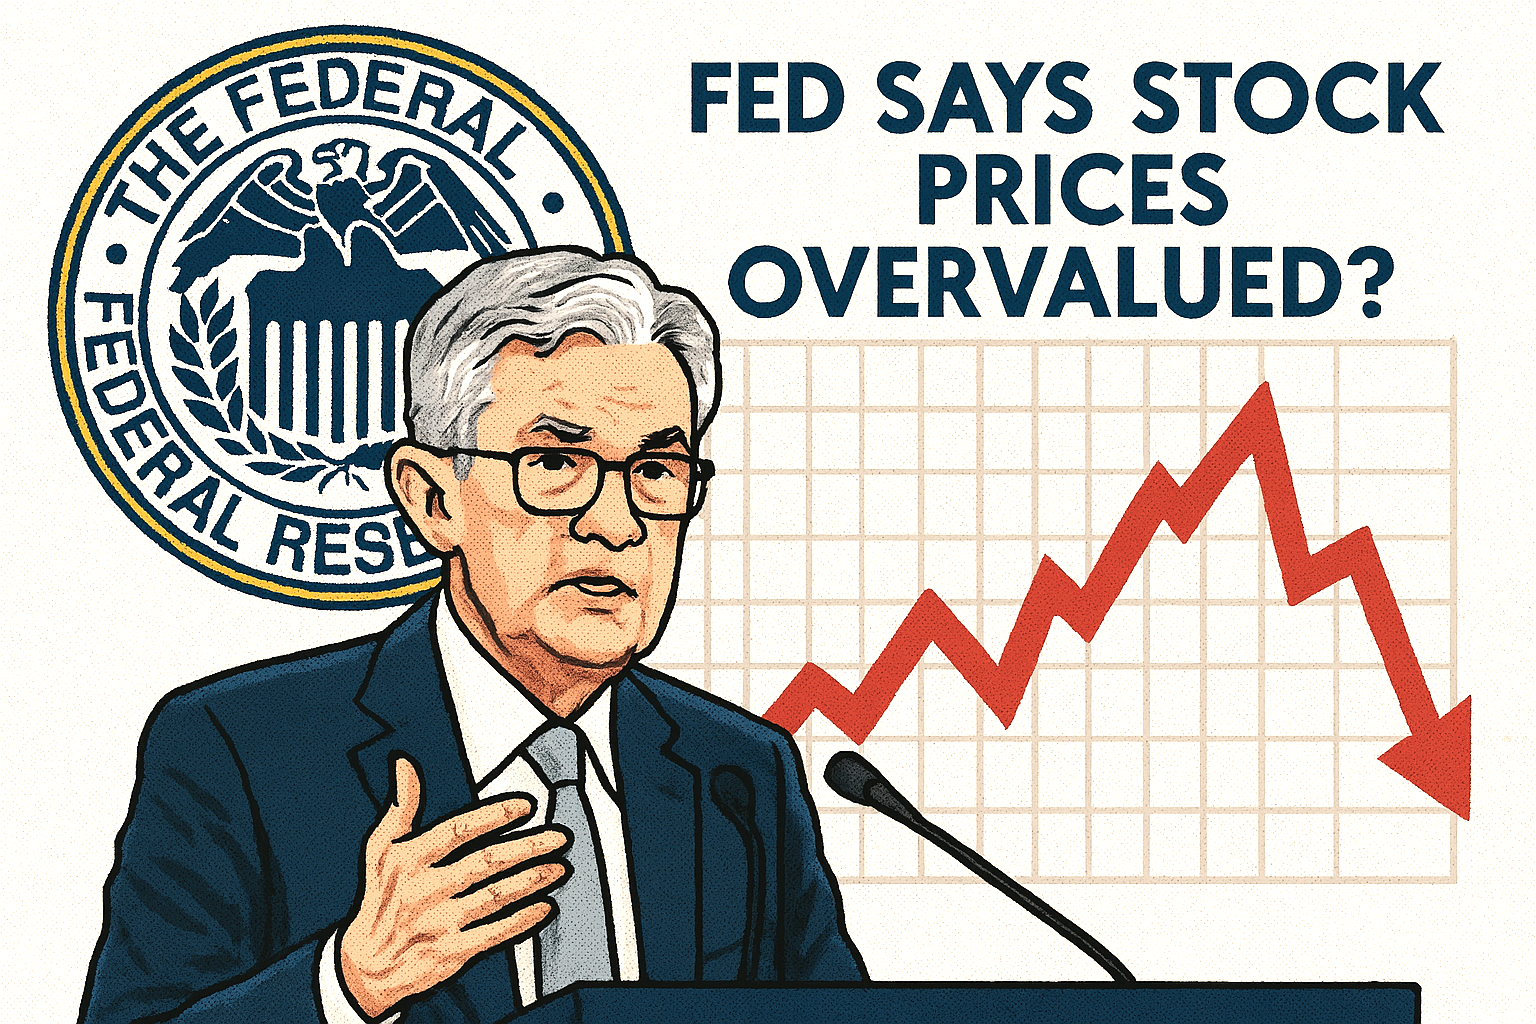
As of October 2025, many analysts argue that the U.S. stock market is exhibiting classic signs of a bubble. Valuations stretched across major indices and speculative behaviour intensifying—particularly in mega-cap tech stocks and passive index funds.
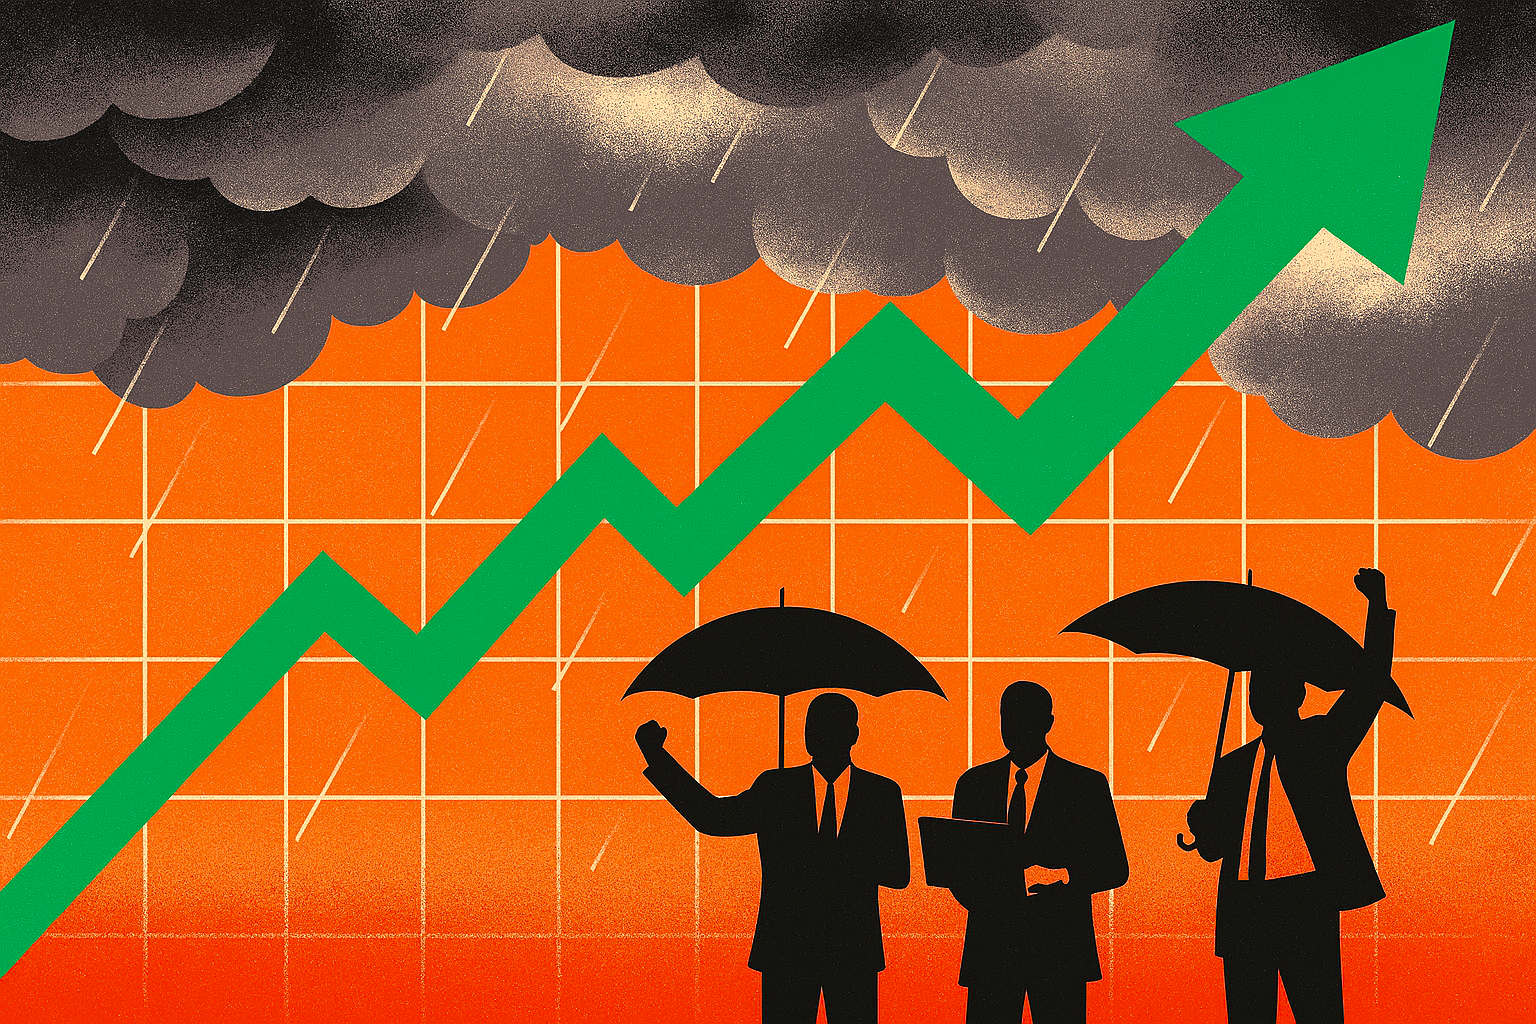
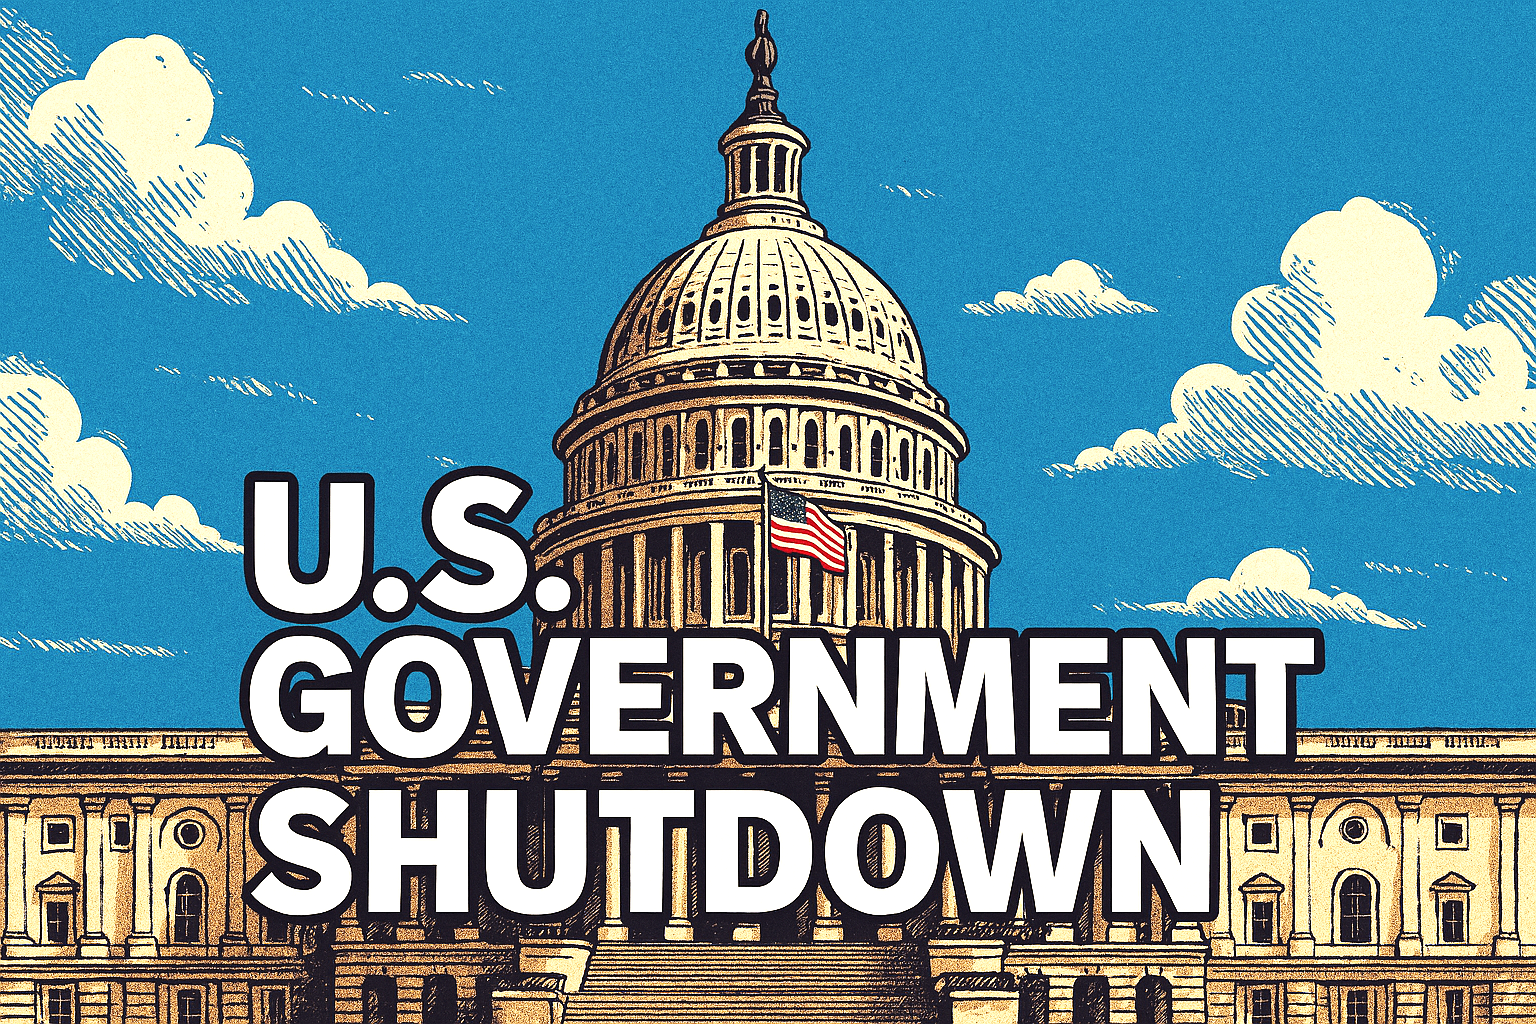
The S&P 500 recently hit record highs despite a backdrop of political gridlock and a government shutdown. This suggests a disconnect between price momentum and underlying economic risks.
Indicators like Market Cap to Gross Value Added (GVA) and excessive investor sentiment point to a speculative mania. Some experts are calling it the largest asset bubble in U.S. history.
While a full-blown crash hasn’t materialised yet, the market’s frothy conditions and historical October volatility have many bracing for a potential correction.