
The AI Revolution Is Real — But So Is the Bubble Risk

Is the AI bubble real?

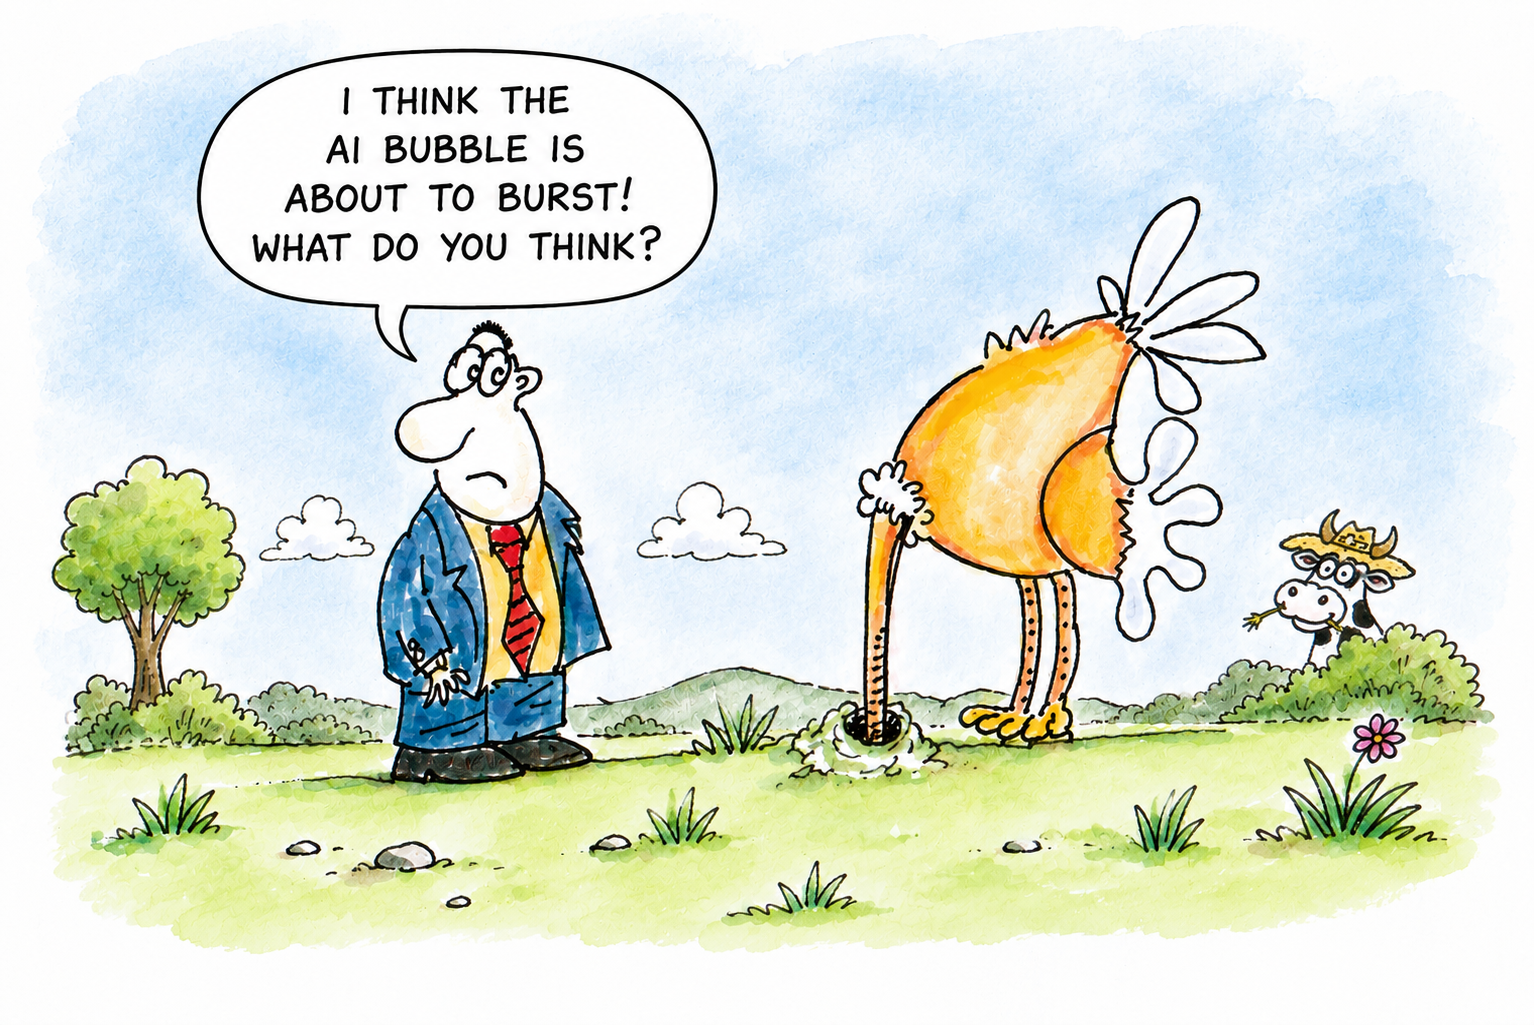
Hermann Hauser has seen technology revolutions come and go. As the co-founder of Arm and a veteran technology investor, his latest warning about artificial intelligence deserves attention — particularly because he is not predicting that the AI boom will collapse.

Quite the opposite

Hauser believes AI could create more economic value than any previous technology revolution.

But he also describes the journey ahead as a “rollercoaster”, arguing that some valuations have already raced far beyond what the underlying businesses can reasonably justify.

That distinction is important. The technology can be transformational while the financial markets surrounding it become overheated.

Billions

Billions are pouring into AI companies, data centres, chips and infrastructure. At the same time, some of the industry’s biggest players are increasingly intertwined financially, creating concerns about circular investment — money flowing between chip companies, AI developers and infrastructure providers.

Hauser reportedly believes a correction could therefore be painful, even if the technology itself continues advancing.

Yet he does not see the largest AI laboratories as necessarily being the biggest casualties. Companies with substantial capital and genuine demand for their products may be capable of surviving a market reset.

The bigger question is whether investors have confused technological potential with guaranteed financial returns.

History lesson

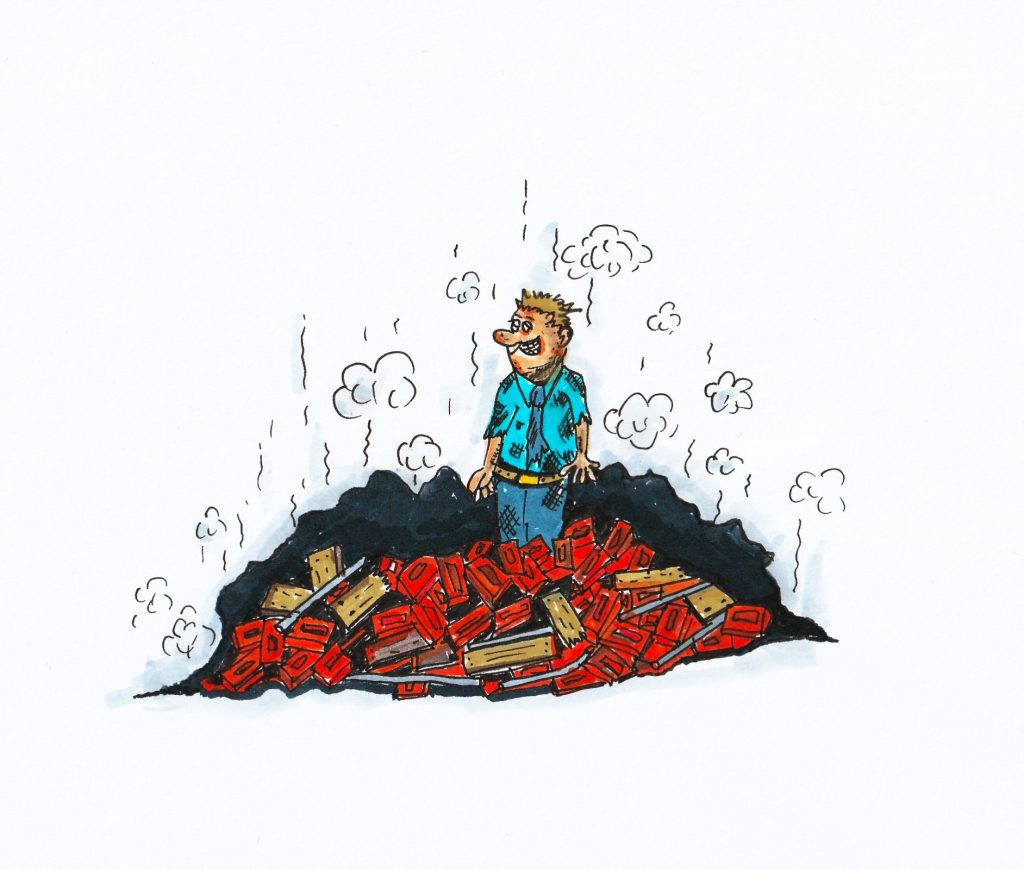
History offers plenty of warnings. The internet genuinely transformed the world, but that did not prevent the dot-com bubble from destroying enormous amounts of wealth. Great technology and terrible investment decisions can exist at the same time.

Hauser’s message is therefore neither “AI is a fraud” nor “AI stocks can only go higher”.

It is much more uncomfortable: the revolution may be real — and the bubble may be real too.

For investors, that could be the most important warning of all.

Technical Signals: Cracks beneath the surface – are U.S. stocks beginning to stumble?

Stock correction?

There are increasingly credible signs that U.S. stocks may be heading into a deeper adjustment phase.

Here’s a breakdown of the key indicators and risks that suggest the current stumble could be more than a seasonal wobble. It’s just a hypothesis, but…

  • S&P 500 clinging to its 200-day moving average: While the long-term trend remains intact, short-term averages (5-day and 20-day) have turned negative.
  • Volatility Index (VIX) rising: A 7.61% surge in the 20-day average VIX suggests growing unease, even as prices remain elevated.
  • Diverging ADX readings: The S&P 500’s ADX (trend strength) is weak at 7.57, while the VIX’s ADX is strong at 45.37—classic signs of instability brewing.

🧠 Sentiment & Positioning: Optimism with Defensive Undercurrents

  • Investor sentiment is bullish (40.3%), but rising put/call ratios and a complacent Fear & Greed Index hint at hidden caution.
  • Historical parallels: Similar sentiment setups preceded corrections in 2021 and 2009. We’re not at extremes yet, but the complacency is notable.

🌍 Macroeconomic Risks: Tariffs, Fed Policy, and Structural Headwinds

  • Tariff escalation: Trump’s recent executive order raised effective tariffs to 15–20%, with new duties on rare earths and tech-critical imports.
  • Labour market weakening: July’s jobs report showed just 73,000 new jobs, with massive downward revisions to prior months. Unemployment ticked up to 4.2%.
  • Fed indecision: The central bank is split, with no clear path on rate cuts. This uncertainty is amplifying volatility.
  • Structural drag: Reduced immigration and R&D funding are eroding long-term growth potential.
  • 🛡️ Strategic Implications: How Investors Are Hedging
  • Defensive sectors like utilities, healthcare, and gold are gaining traction.
  • VIX futures and Treasury bonds are being used to hedge against volatility.
  • Emerging markets with trade deals (e.g., Vietnam, Japan) may outperform amid global realignment.
  • 🗓️ Seasonal Weakness: August and September Historically Slump
  • August is the worst month for the Dow since 1988, and the second worst for the S&P 500 and Nasdaq.
  • Wolfe Research reportedly notes average declines of 0.3% (August) and 0.7% (September) since 1990.
  • Sahm Rule: Recession indicator.

Now what?

While the broader market still shows resilience—especially in mega-cap tech—the underlying signals point to fragility.

Elevated valuations, weakening macro data, and geopolitical uncertainty are converging. A deeper correction isn’t guaranteed, but the setup is increasingly asymmetric: limited upside, growing downside risk.

U.S. and China reportedly reach agreement to cooperate on financial stability

U.S. & China flags

The U.S. and China recently signed an agreement to cooperate on financial stability. This agreement was part of a meeting of the U.S. – China Financial Working Group held in Shanghai. 

The discussions were reportedly described as professional, pragmatic, candid, and constructive.

The agreement includes measures for both countries to collaborate on capital markets, cross-border payments, and monetary policy. Representatives from various financial institutions and regulatory bodies from both nations participated in the meeting.

This cooperation aims to enhance financial stability and address potential financial risks more effectively. It’s a significant step towards fostering economic collaboration between the two largest economies in the world.

See full report here