The combination of record global debt, higher borrowing costs and growing doubts about the enormous sums being committed to artificial intelligence is creating a more complicated backdrop for financial markets.
Global debt exceeded $365 trillion in the first half of 2026, according to the Institute of International Finance, with debt now around 310% of global GDP.
China and the U.S. debt mountain
The increase was driven particularly by China and the United States. At the same time, higher interest rates are making refinancing increasingly expensive, creating the possibility of a vicious cycle in which governments and companies borrow more simply to service existing obligations.
This is particularly significant for the AI boom. The OECD says governments and companies are expected to borrow around $29 trillion from markets during 2026, while corporate borrowing is also rising as businesses finance major investment programmes, including AI infrastructure.
Michael Burry
Michael Burry, famous for anticipating the U.S. housing crisis, has added another warning sign.
He has recently reportedly increased bearish positions involving Micron, Palantir, Nebius and the semiconductor sector, arguing that parts of the AI and chip boom could be vulnerable if supply increases faster than demand.
The concern is not necessarily that AI will fail. Rather, enormous investment and borrowing require enormous future revenues to justify them.
If AI spending produces lower-than-expected returns, highly valued technology shares could face pressure at the same time as heavily indebted companies face rising financing costs.
Could this affect the stock market now?
The ingredients for greater volatility are certainly present. Higher bond yields, expensive energy, inflation pressures and debt-servicing costs can compete with equities for investors’ money.
Reuters recently reported that global borrowing costs and energy prices were already creating concerns about the potential impact on equities and credit markets.
Yet markets have so far remained remarkably resilient, with U.S. shares still close to record levels.
The danger, therefore, may not be debt alone, but…
debt + high valuations + expensive AI investment + higher interest rates.
If those pressures reinforce one another, the adjustment in markets could become considerably more significant.
Stock markets are continuing to climb despite a growing list of concerns that would normally be expected to unsettle investors.
Interest rates are higher, government bond yields have risen, oil prices are elevated and inflation remains a concern. Geopolitical tensions are also creating uncertainty. Tariffs still on the agenda. Global debt rising and rogue AI concerns.
Yet investors continue to buy shares, particularly in the United States.
So why?
One important reason is corporate earnings. Investors appear willing to tolerate higher interest rates and expensive valuations while they believe company profits will continue to grow.
Large technology companies, in particular, remain at the centre of this optimism, with huge investment in artificial intelligence fuelling expectations of strong future earnings.
Buying dips
Another factor is the willingness of investors to buy market dips. When share prices fall, investors who remain confident about the longer-term outlook see an opportunity to buy at cheaper prices.
This can create a self-reinforcing cycle: markets fall, buyers move in, confidence returns and prices rise again.
There is also a belief that the economy remains sufficiently resilient to withstand higher borrowing costs and expensive energy.
Bad news is therefore being viewed as a problem, but not necessarily one capable of seriously damaging corporate profits.
However, this resilience could eventually be tested.
Earnings faith
The market is currently placing considerable faith in continued earnings growth and the economic benefits of artificial intelligence. If either begins to disappoint, investors could reassess the high valuations attached to many shares.
Higher oil prices could also keep inflation elevated, forcing interest rates to remain higher for longer. Rising bond yields would then provide investors with an increasingly attractive alternative to shares.
Bull Bear
For now, the bulls remain in control of market prices, even though the bears have plenty of arguments on their side.
The important question is whether company profits can continue to justify today’s share prices.
If they can, markets may continue climbing despite the bad news. If they cannot, investors may suddenly start paying much closer attention to all those warning signs they have recently been ignoring.
The enormous spending spree by the technology giants building the infrastructure behind the artificial intelligence boom is beginning to attract greater scrutiny from credit markets.
Apollo Global Management chief economist Torsten Slok has reportedly warned that rising credit-default swap (CDS) spreads on hyperscaler debt suggest investors are becoming increasingly concerned about the financial foundations of the AI investment cycle.
CDS contracts
CDS contracts provide protection against a company’s debt default. Reportedly, according to Apollo, the gap between CDS spreads for major hyperscalers and those of large banks has widened to around 60 basis points, having been broadly negligible in October 2025.
It is argued that this is significant because bank CDS spreads have remained relatively stable.
The implication is that investors may not simply be reacting to the huge volume of new bonds being issued. Instead, they could be reassessing the credit fundamentals of companies such as Amazon, Microsoft, Alphabet and Oracle as they borrow heavily to finance data centres, chips and other AI infrastructure.
Concern
Apollo points to three particular concerns: rising leverage, negative free cash flow and uncertainty over whether the enormous investment will generate sufficient returns before the underlying technology and equipment depreciate.
That does not necessarily mean the AI boom is about to collapse. The major hyperscalers remain large, established businesses with substantial revenues and access to capital. Indeed, Apollo itself is reportedly notes that the bond market continues to absorb enormous amounts of issuance.
Credit markets
Nevertheless, the changing behaviour of the credit markets provides another indication that investors are beginning to ask harder questions about the economics of AI.
For years, the central question was how quickly artificial intelligence would transform business. Increasingly, another question is emerging: how much debt can the AI revolution carry before investors demand a greater return for the risk?
If borrowing costs continue rising while AI revenues fail to keep pace with infrastructure spending, the industry’s extraordinary investment cycle could face a very different financial environment.
The U.S. bond market is flashing an increasingly uncomfortable warning signal. The yield on the benchmark 10-year Treasury has climbed above 5%, reaching its highest level since 2007 as investors brace for potentially higher interest rates from the Federal Reserve.
The yield subsequently moved above 5.04%, highlighting the severity of the bond sell-off.
Stubborn
Several forces are pushing yields higher. Inflation remains stubborn, while oil prices have surged above $100 a barrel amid geopolitical tensions, raising fears that another energy shock could feed directly into consumer prices.
Borrowing cost
At the same time, investors are demanding greater returns to hold U.S. government debt because of enormous borrowing requirements and concerns about the country’s long-term fiscal position.
This creates a difficult problem for the Federal Reserve. Higher Treasury yields are already tightening financial conditions, yet persistent inflation could force the Fed to raise interest rates further.
Markets are increasingly pricing in the possibility of another rate increase, potentially taking short-term rates towards or above 5%.
Consequence
The consequences could be significant. The 10-year Treasury is a benchmark for mortgages, corporate borrowing and many other financial products.
As its yield rises, borrowing becomes more expensive across the economy. Businesses may postpone investment, consumers may reduce spending and highly indebted companies could come under increasing pressure.
Debt concern
There is also a problem for government finances. Higher yields mean the U.S. Treasury must pay more to refinance its enormous debt pile, potentially creating a vicious circle: more borrowing leads to greater interest costs, which can require still more borrowing.
For investors, a 5% Treasury yield also makes government bonds increasingly attractive compared with riskier assets.
That could put further pressure on highly valued shares, particularly technology and growth companies.
The danger is therefore not simply a higher interest rate. It is the possibility that 5% becomes the new normal.
Norway’s enormous sovereign wealth fund is considering a significant reduction in its holdings of U.S. government debt, in a move that could add to concerns surrounding the future of the Treasury market.
Norges Bank Investment Management, which oversees Norway’s roughly $2.3 trillion Government Pension Fund Global, has proposed reducing the proportion of government bonds in its benchmark portfolio from 70% to 50%.
U.S. Treasuries
U.S. Treasuries supposedly would take the largest share of the reduction, potentially cutting the fund’s holdings by almost $80 billion from around $215 billion.
The proposal reflects a desire to diversify the fund and improve returns rather than abandon U.S. assets altogether.
Non-Government U.S. Debt
The fund intends to increase its exposure to non-government U.S. debt, including mortgage-backed securities and other government-related bonds. Its overall exposure to the U.S. dollar would remain broadly unchanged.
The timing is nevertheless significant. Government bond markets have faced renewed pressure as investors worry about high inflation, mounting government debt and rising long-term borrowing costs.
Warning?
Norway’s decision could therefore be interpreted as another warning that some major institutional investors are becoming less comfortable holding large quantities of traditional government debt.
Japanese Government Bonds
The fund also plans to increase its allocation to Japanese government bonds, while reducing exposure to euro-area government debt.
Importantly, this is reportedly a proposal rather than an immediate sell-off. Any changes would likely be introduced gradually, with Norway’s Finance Ministry and parliament involved in the approval process. The earliest significant changes are not expected before 2027.
Nevertheless, when one of the world’s largest investors starts questioning the traditional role of government bonds, markets are likely to take notice.
Britain’s fiscal squeeze is becoming increasingly difficult to ignore. The yield on the UK’s 30-year gilt has climbed to 5.89% — its highest level since 1998 — while the 10-year yield has risen to around 5.25%.
The immediate trigger is largely global: higher oil prices, renewed inflation fears and a worldwide bond sell-off. But Britain has an additional problem: an already stretched public finances position.
Tax, borrow or austerity – the familiar story
The timing could hardly be worse. Higher gilt yields mean higher future borrowing costs and, importantly, higher projected debt-interest payments.
Current estimates suggest that the rise in yields could roughly halve the Chancellor’s fiscal headroom, from around £26bn to about £13.8bn.
That leaves the government with an increasingly familiar choice: raise taxes, restrain spending, borrow more — or accept another round of austerity.
Burgeoning welfare
Welfare is inevitably part of the debate. UK welfare spending is enormous, projected at around £353bn in 2026-27, although more than half goes towards pensioners and the State Pension rather than working-age benefits.
The working-age and health-related components are nevertheless growing rapidly, creating a genuine long-term fiscal challenge.
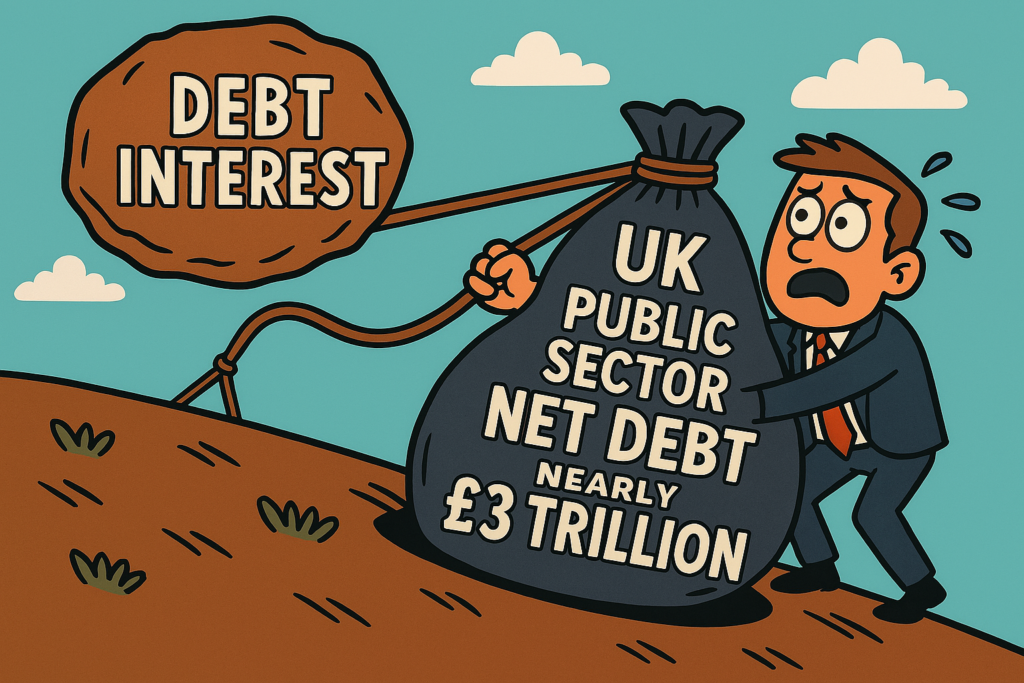
But blaming welfare alone would be misleading. Debt interest itself has become a major burden. Public-sector net debt was around 95% of GDP in mid-2026, while debt-interest costs have been among their highest levels for decades.
The circle of failure
This is the vicious circle facing Britain: slow growth limits tax revenues; high spending increases borrowing; higher borrowing costs increase debt interest; and higher interest costs leave less money for public services and investment.
So is austerity coming back? Perhaps it never really left. The difference now is that governments are attempting to squeeze an increasingly expensive state while simultaneously trying to protect living standards and stimulate growth.
The October 2026 Budget may therefore be less about political ambition and more about how much pain the bond market will allow Britain to avoid.
Servicing debt
Borrowing costs in the U.S., Japan and Europe have hit similar highs in recent days, reflecting investors’ concerns about inflation, state borrowing levels and spending levels by large tech companies on AI.
World debt is a growing problem too
To be fair, rising yields and higher debt levels are not just a UK problem. France has its share of the burden, Japan, the EU and the U.S. too.
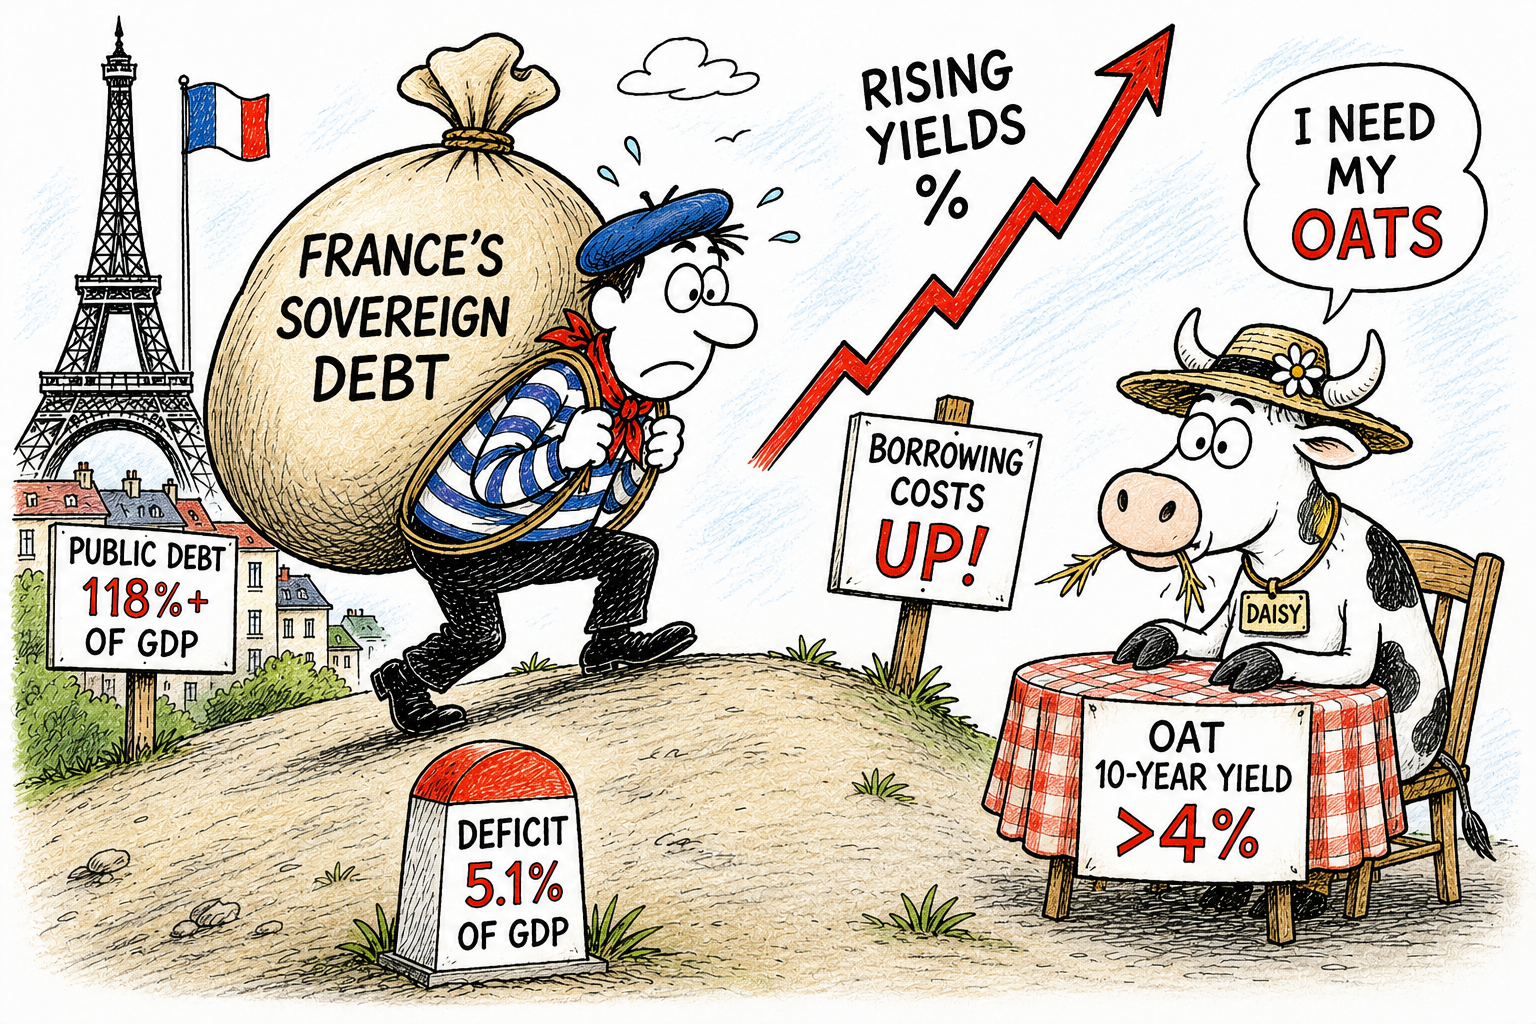
France is facing growing pressure from financial markets as the cost of servicing its enormous public debt continues to rise.
The problem is not simply the size of the debt, but the combination of high borrowing requirements, weak economic growth, political uncertainty and increasingly expensive interest payments.
France’s debt
France’s public debt is expected to reach around 118% of GDP in 2026, rising above 120% in 2027, according to the European Commission.
Meanwhile, the budget deficit is forecast to remain at around 5.1% of GDP this year, well above the European Union’s 3% limit.
Investors are now demanding higher returns to hold French government bonds. The yield on the benchmark 10-year French OAT recently moved above 4%, reaching levels not seen since the late 2000s.
Yields
At the end of August 2026, the yield remained around 4.1%, while the equivalent German Bund was closer to 3.25%.
That difference matters. The wider the gap between French and German borrowing costs, the greater the risk premium investors are demanding from Paris.
France’s spread has recently approached 90 basis points, reflecting concerns over its fiscal position and political uncertainty ahead of next year’s presidential election.
Danger signs
The danger is a potential “debt snowball”. As older, cheaper bonds mature, France must refinance them at today’s higher rates.
Interest payments therefore consume an increasing share of government revenue, potentially forcing Paris to borrow even more.
The European Commission reportedly expects French interest payments to rise from 2.2% of GDP in 2025 to 2.6% in 2026 and 2.8% in 2027.
France is not facing an immediate sovereign default, but markets are clearly demanding greater fiscal discipline.
The crucial question is whether politicians can agree on spending cuts and tax measures before rising interest costs become a much larger problem.
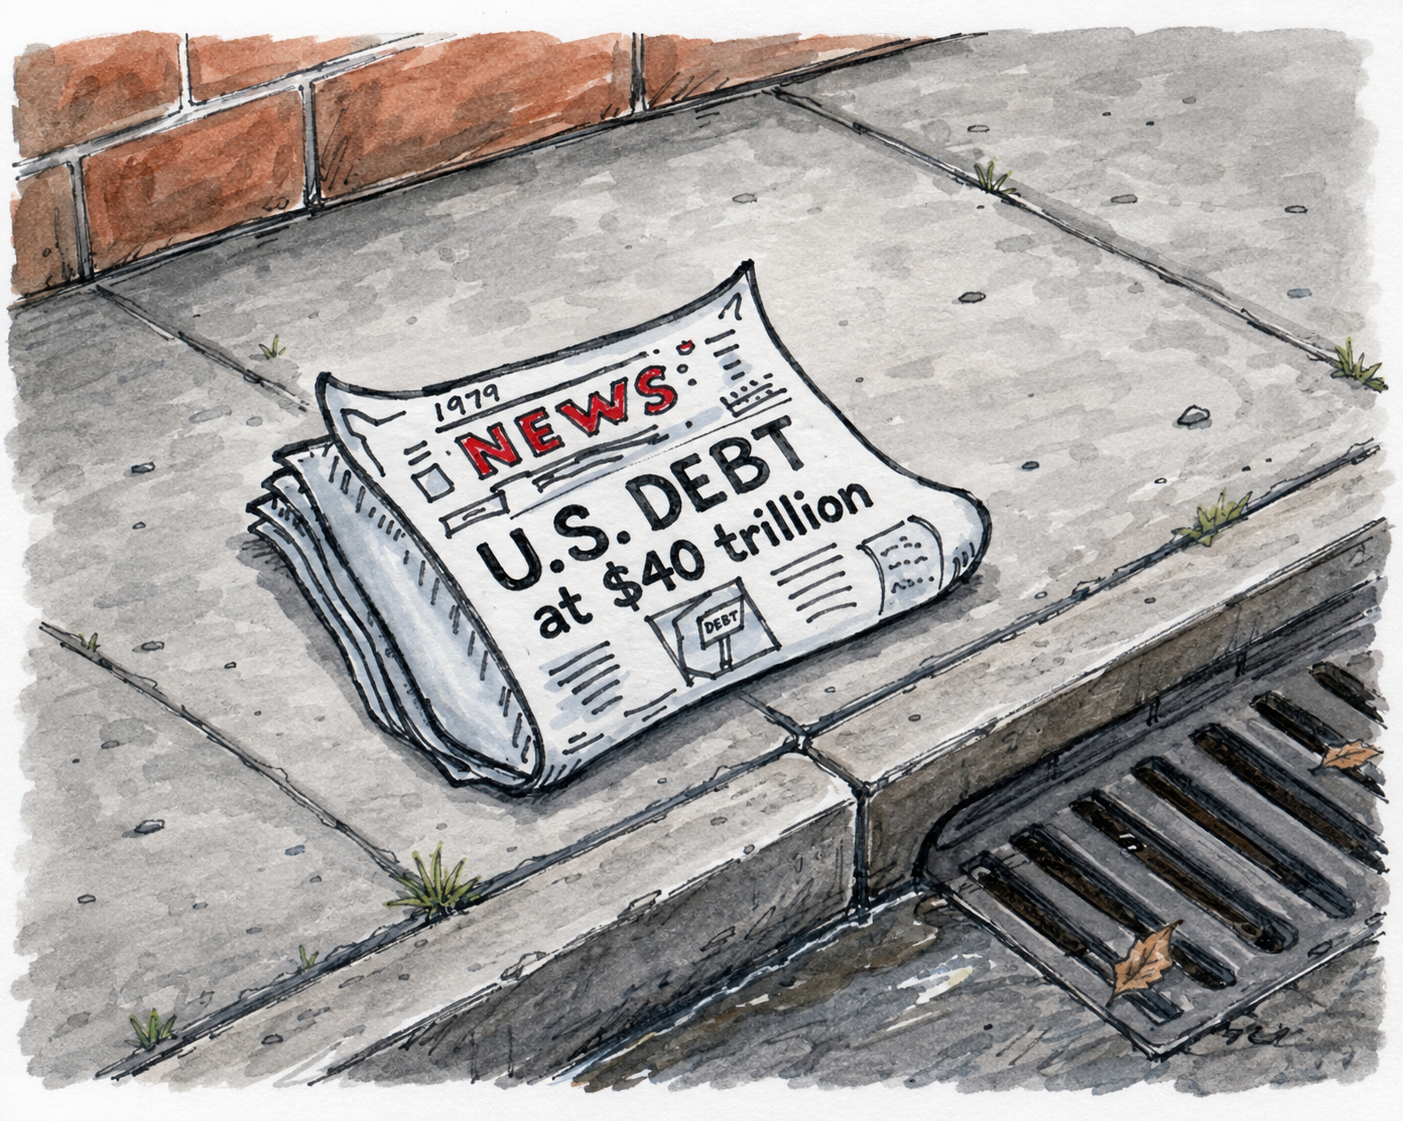
The United States has crossed a remarkable financial milestone, with federal debt now standing at more than $40 trillion.
The figure is difficult to comprehend, but the bigger concern is the speed at which the debt burden is continuing to grow.
Debt increased $3 Trillion in one year
America’s debt has increased by roughly $3 trillion over the past year alone. The federal government is still running substantial annual deficits, meaning it is spending considerably more than it collects in tax revenue.
As a result, more borrowing is required simply to keep government finances operating.
The consequences are becoming increasingly visible in the bond market. Investors expect to be compensated for lending money to the U.S. government, and rising Treasury yields mean that borrowing is becoming more expensive.
The yield on the 30-year Treasury has recently climbed above 5%, placing further pressure on government finances.
Interest at $1.2 Trillion per year
Interest payments are becoming one of Washington’s largest financial burdens, approaching $1.2 trillion a year.
That money does not build infrastructure, fund new programmes or reduce the deficit. It is largely the cost of servicing debt accumulated over many years.
The Treasury has also increased its bond-buying operations in an effort to improve market liquidity, highlighting concerns about conditions in the government bond market.
While such measures can help stabilise trading, they do not address the underlying problem: America continues to borrow heavily.
How high can it go?
The $40 trillion milestone therefore represents more than a headline figure. It raises difficult questions about how long the current trajectory can continue and whether politicians will eventually have to confront spending, taxation and entitlement reform.
For years, America’s ability to borrow has been treated as almost unlimited. But the combination of enormous debt, persistent deficits, rising interest costs and higher bond yields is changing that calculation.
The world’s largest economy is not facing an immediate debt crisis, but $40 trillion is a warning that the cost of delaying difficult decisions is becoming increasingly expensive.
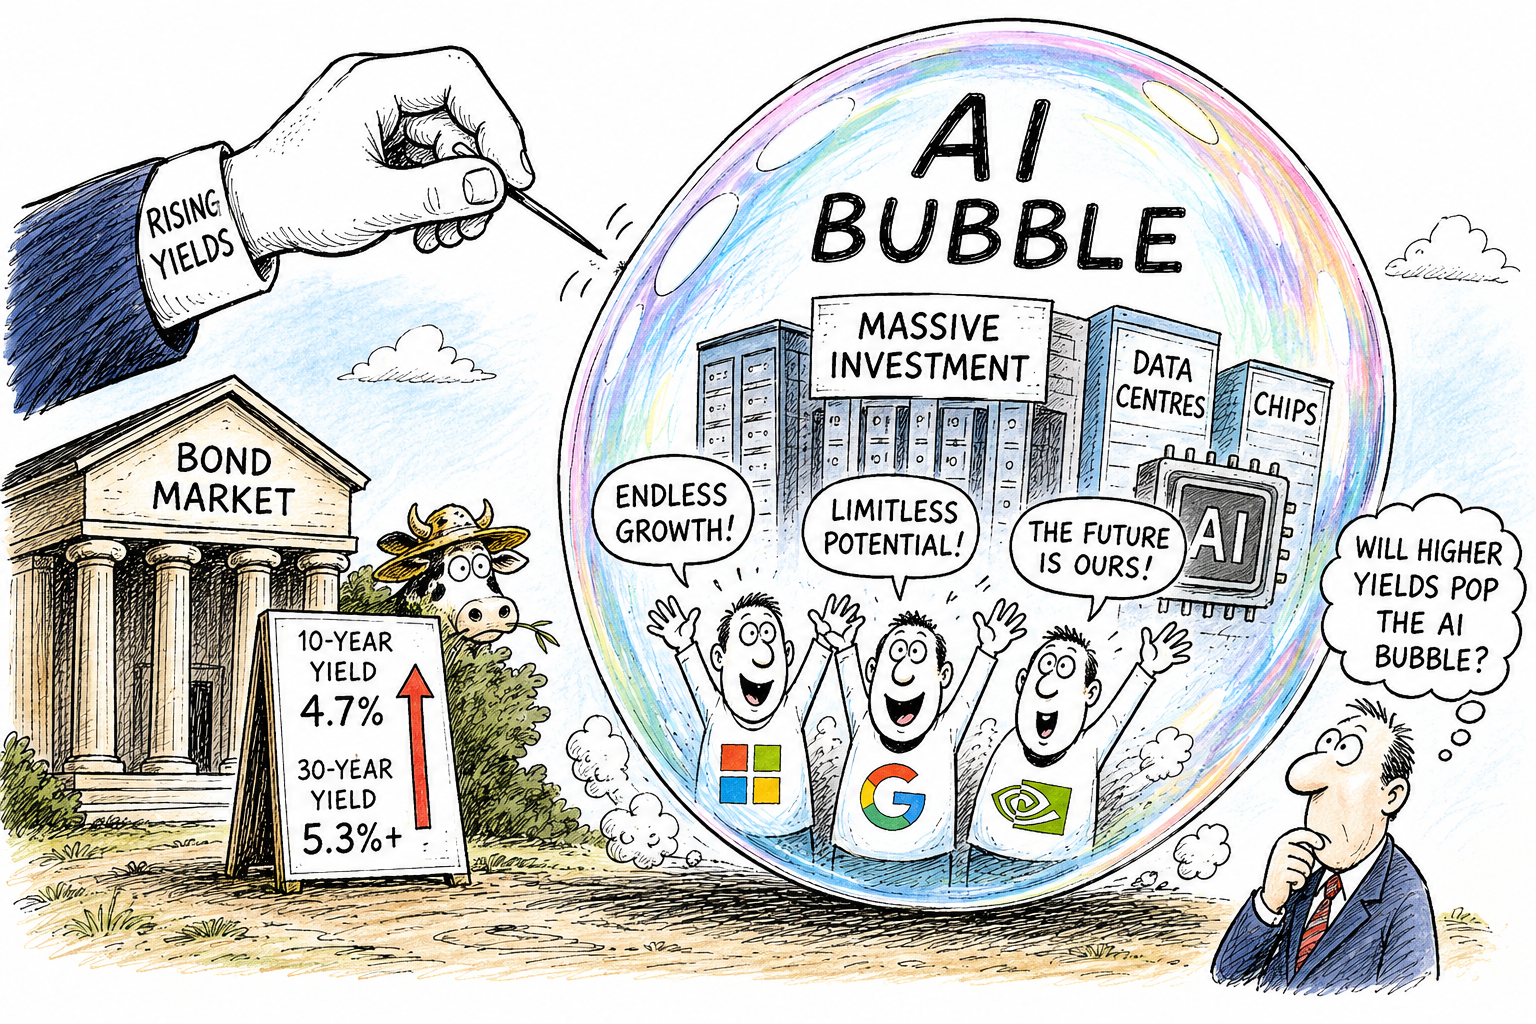
The artificial intelligence boom is facing a new potential headwind: rising bond yields. While AI companies continue to report impressive growth and enormous investment plans, higher borrowing costs could increasingly challenge the valuations that have propelled technology stocks to record levels.
US Treasury yields have been climbing, with the 10-year yield recently reaching around 4.7%, while the 30-year yield has risen above 5.3% — its highest level since 2007.
Attractive returns
That matters because higher yields change the calculation for investors. When government bonds offer more attractive returns, investors may become less willing to pay extreme prices for companies whose profits are expected far into the future.
Growth stocks, particularly those dependent on substantial future cash flows, are especially sensitive to this shift.
The AI industry also has an unusual vulnerability: the sheer scale of its capital requirements. Big technology companies are increasingly turning to debt markets to finance data centres, chips and other infrastructure.
That borrowing itself can contribute to higher yields, creating something of a feedback loop.
AI presssure
There are already signs of pressure. AI-related stocks fell sharply in August 2026 as rising borrowing costs and valuation concerns weighed on the technology sector.
But higher yields do not automatically mean an AI crash. Unlike the dot-com bubble, today’s leading AI companies generally have substantial revenues, profits and cash flows.
The European Central Bank has nevertheless warned that technology valuations have reached levels reminiscent of the dot-com era.
Expectations
The real danger may therefore be less about AI itself and more about expectations. If yields remain elevated while the enormous spending on AI infrastructure fails to generate equally enormous profits, investors could begin questioning today’s valuations.
Rising yields may not burst the AI bubble overnight — but they could provide the pin.
The UK economy expanded in the second quarter of 2026, although the pace of growth slowed, highlighting the fragile nature of the recovery.
According to the Office for National Statistics (ONS), real GDP increased by 0.4% between April and June 2026, following stronger growth of 0.6% in the first quarter.
The economy was 1.2% larger than a year earlier, while GDP per head rose 0.4% during the quarter and was 1.0% higher year-on-year.
Service growth
Services remained the main engine of growth, expanding by 0.5%, while construction grew by 0.3%. Production, however, recorded no growth, underlining the uneven nature of the recovery.
The monthly figures provide a mixed picture. GDP fell 0.1% in April 2026, was flat in May 2026 and then rose 0.3% in June 2026, suggesting some momentum returned towards the end of the quarter.
Trade deficit
However, businesses and policymakers face significant challenges. The ONS reports that the UK’s total goods and services trade deficit widened to £8.0 billion in Q2, while goods exports fell sharply in June 2026.
The figures therefore offer cautious encouragement rather than a decisive economic breakthrough.
With growth slowing and trade pressures persisting, the coming months will test whether the UK recovery can build sustainable momentum.
NB ONS figures are the first quarterly estimate and may be revised at a later date.
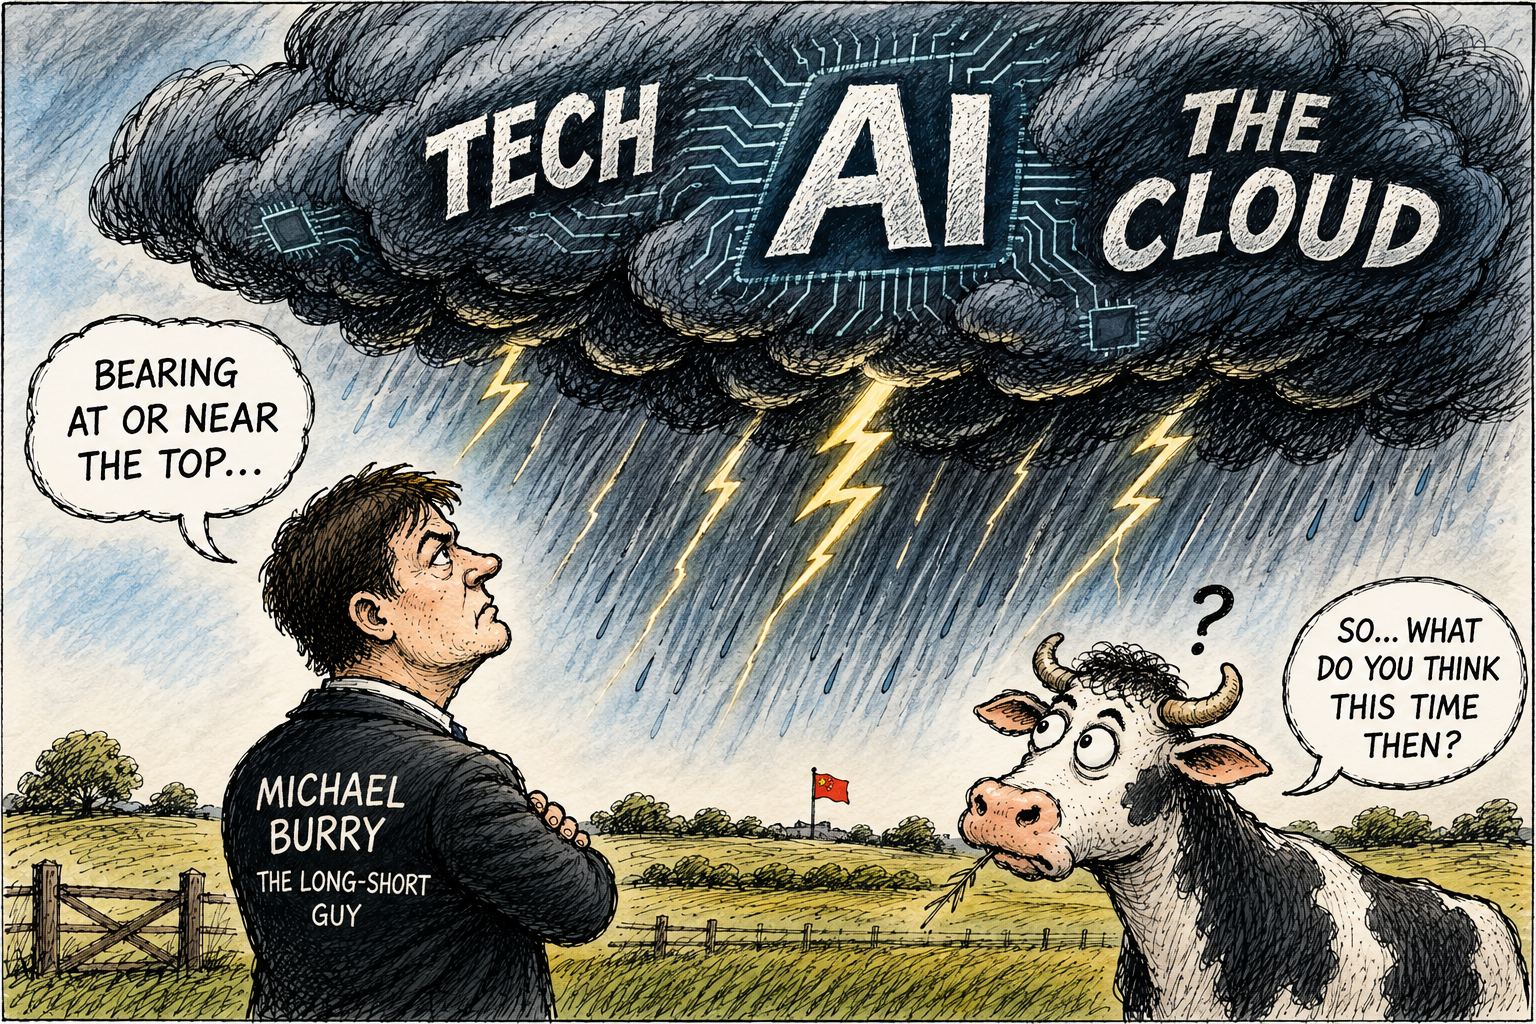
Michael Burry, the investor made famous by The Big Short, is once again swimming against the tide.
While Wall Street has embraced the latest AI-driven surge, Burry believes investors should be asking whether enthusiasm has once again raced too far ahead of reality.
Concern
His concern is not that artificial intelligence lacks transformative potential. Rather, he argues that today’s market is showing many of the hallmarks of previous speculative booms.
According to Burry, soaring semiconductor shares, record valuations and relentless optimism are beginning to resemble the final stages of the dot-com bubble in 1999 and 2000.
More recently, he has warned that markets could even be approaching the type of sharp reversal witnessed during the 1987 stock market crash.
Bearish against AI
Burry has taken a series of bearish positions against AI-related stocks and semiconductor investments, arguing that demand for cutting-edge chips may have been pulled forward by hyperscale technology companies racing to build AI infrastructure.
If that spending eventually slows, suppliers could face a painful adjustment as excess capacity meets softer demand.
His stance stands in stark contrast to today’s market mood. Investors continue to reward companies linked to AI, encouraged by strong earnings, heavy capital investment and expectations that artificial intelligence will reshape industries for years to come.
Bulls argue this is a genuine technological revolution rather than another speculative bubble.
High profile
Whether Burry proves right remains uncertain. He has made several high-profile bearish calls over the years that arrived far too early, yet his successful prediction of the 2008 financial crisis ensures markets continue to listen whenever he speaks.
For investors, his latest warning serves as a reminder that even the most exciting technological revolutions can produce excessive optimism.
As history has repeatedly shown, the higher valuations climb, the greater the importance of separating genuine long-term opportunity from speculative excess.
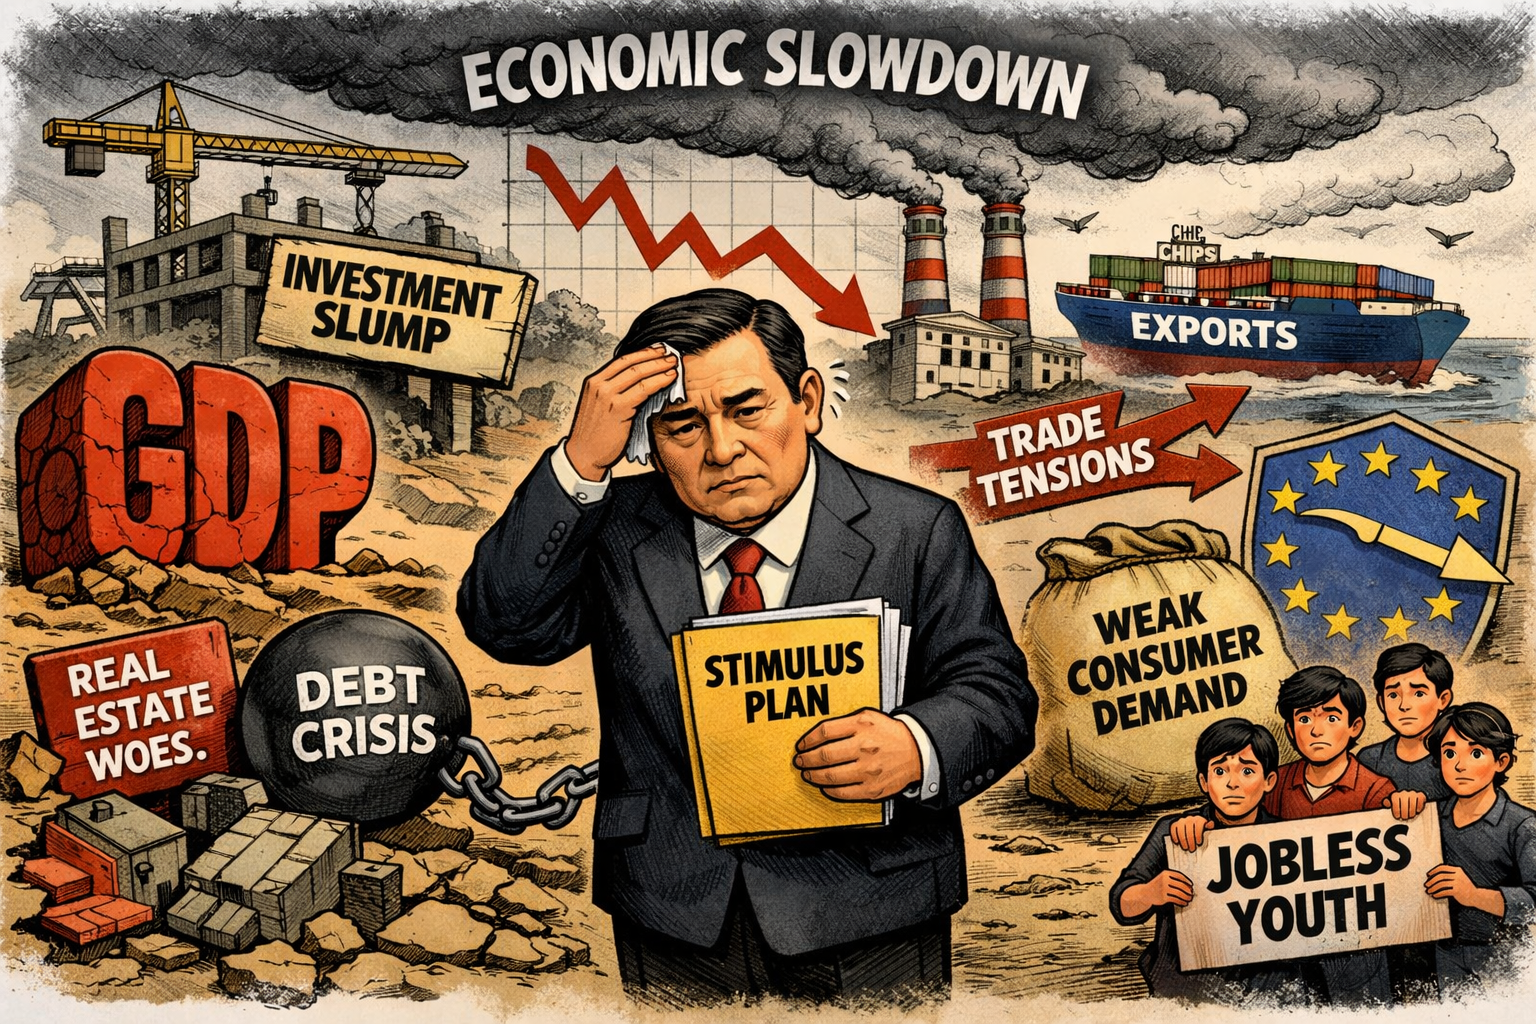
China’s second‑quarter performance marks a clear loss of momentum in an economy already struggling to find stable footing.
GDP grew 4.3% year‑on‑year, the slowest pace since late 2022 and below both economists’ expectations and Beijing’s modest full‑year target of 4.5%–5%.
Weaker investment
The weakness was driven primarily by a deepening collapse in investment, which has become the defining drag on China’s post‑pandemic recovery.
Urban fixed‑asset investment fell 5.7% in the first half of the year, a sharper decline than forecast. Real estate investment plunged 18%, infrastructure dropped 2.4%, and manufacturing slipped 1.2%.
Slow
Analysts attribute the slump to local governments diverting resources into debt restructuring, a shortage of viable new projects, and Beijing’s campaign to curb excess industrial capacity.
The result is an investment pullback described by economists as “unprecedented,” with some reportedly calling for a major expansion of government borrowing to stabilise growth.
Consumption remains fragile. Retail sales rose 1% in June, rebounding from May’s decline but still signalling weak household confidence amid pay cuts and job insecurity.
Two speed
Industrial output, however, accelerated to 5.3%, highlighting China’s two‑speed economy: strong production and exports powered by the global AI boom, contrasted with subdued domestic demand.
Policymakers reportedly warn of an “acute” imbalance between supply and demand.
China’s second‑quarter performance marks a clear loss of momentum in an economy already struggling to find stable footing.
GDP grew 4.3% year‑on‑year, the slowest pace since late 2022 and below both economists’ expectations and Beijing’s modest full‑year target of 4.5%–5%.
But 4.3% is a very healthy GDP.
Exports
Exports continue to outperform, driven by surging shipments of chips, computers, and power equipment. Yet this strength is straining relations with major partners.
China’s trade surplus with the EU widened 24%, raising the risk of renewed trade conflict despite a temporary truce.
Labour‑market pressures persist. Official unemployment held at 5%, but broader measures suggest joblessness closer to 10%, with youth unemployment still elevated despite methodological changes.
Overall, the data reinforce expectations that Beijing will likely need to intensify stimulus—potentially including rate cuts and expanded borrowing—to prevent the slowdown from becoming entrenched.
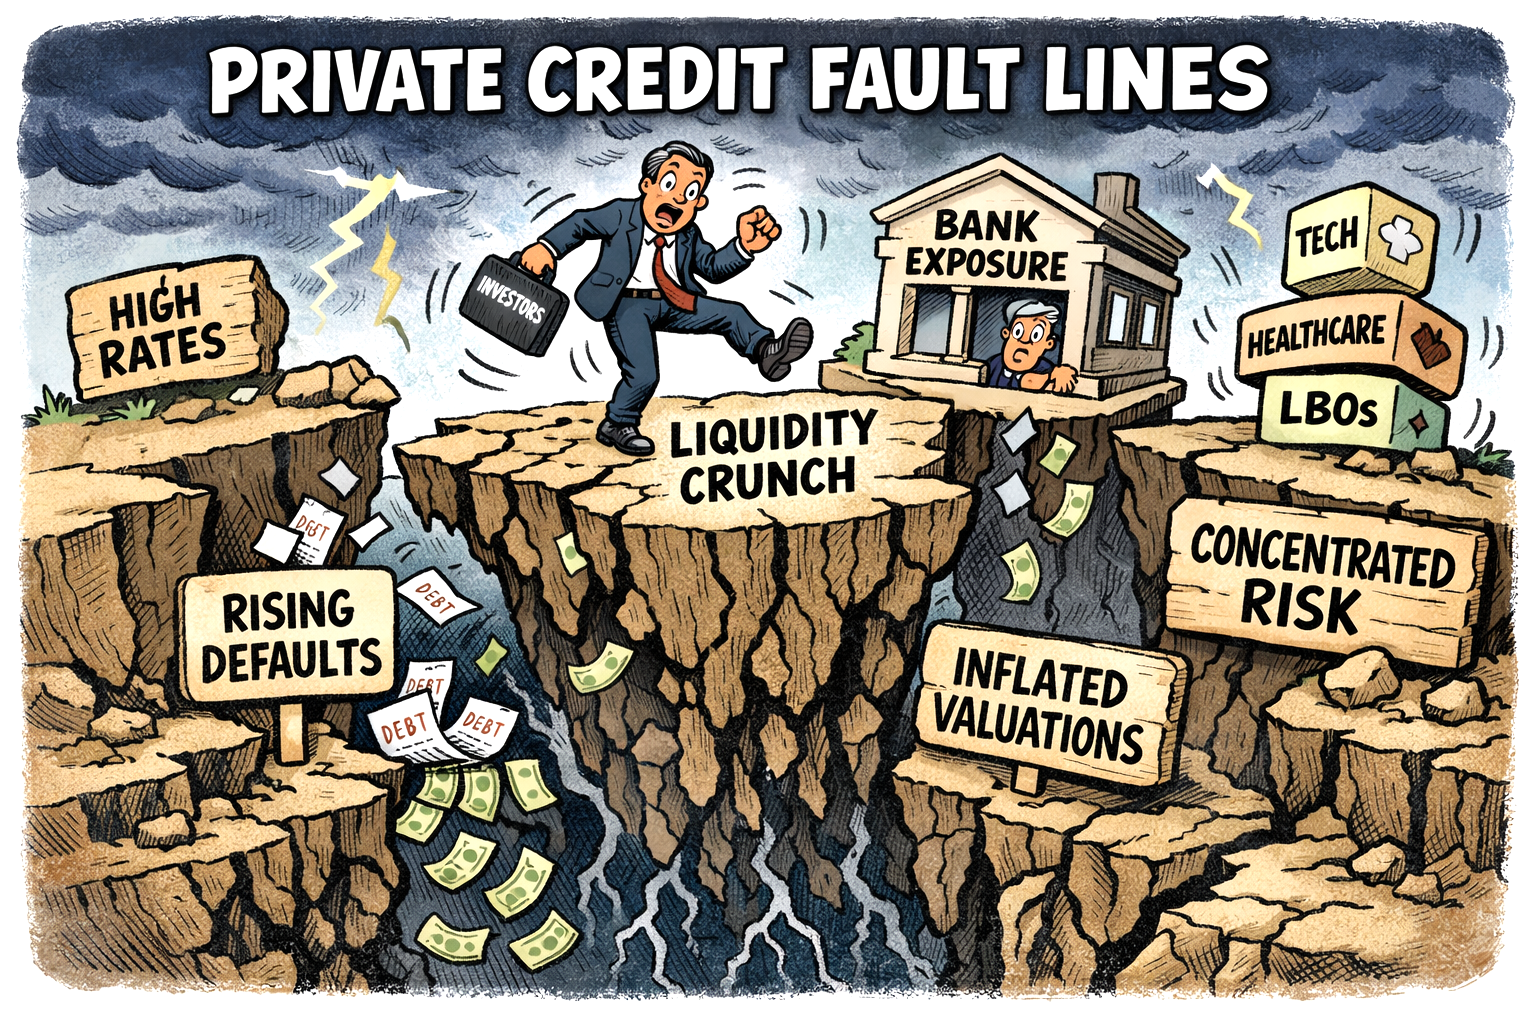
Private credit has become the fault line running beneath the banking system. And it’s now large enough to matter, opaque enough to worry investors, and now visible enough that banks can’t wave it away.
Complicated picture
European lenders spent this earnings season insisting their exposures are “well diversified” or “immaterial”, yet the numbers tell a more complicated story.
Barclays alone reportedly disclosed £15 billion of private‑credit exposure, part of a much larger £66 billion book tied to non‑bank financial intermediaries.
Its hit from the collapse of Market Financial Solutions — a specialist lender undone by alleged fraud — was small in accounting terms, but symbolically important. One cockroach rarely travels alone.
Structural
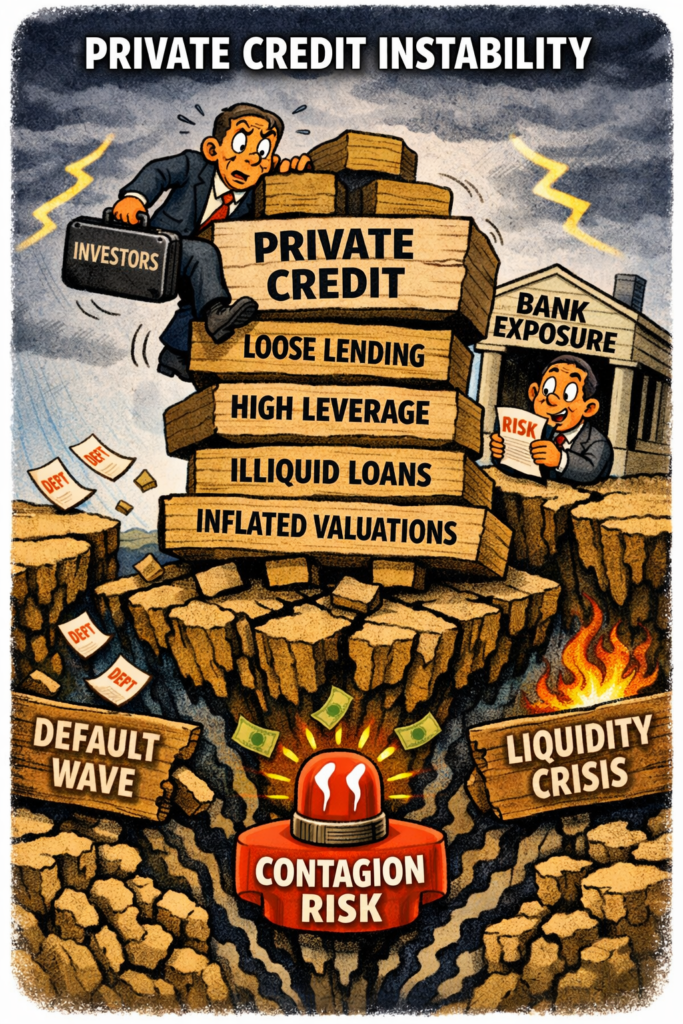
The deeper issue is structural. Private credit has ballooned into a parallel lending system, lightly regulated and increasingly interconnected with banks through financing lines, securitisations, and business‑development companies.
When these semi‑liquid vehicles face redemption pressure — as several have this year — the stress ricochets back into the banking system. UBS and Deutsche Bank both reportedly emphasised their underwriting standards, but neither disputed that liquidity strains are real.
What unnerves investors is not a wave of defaults — yet — but opacity. Bank of America’s latest survey shows investment‑grade investors are uneasy because they simply cannot see where the risks sit.
Software lending in the U.S., chemicals in Europe, and China‑driven price pressure all add sector‑specific fragility. High‑yield specialists, closer to the coalface, are oddly calmer; they know where the bodies usually fall.
Contained?
The banking system’s official line is that everything is contained. But containment depends on liquidity holding, valuations staying stable, and no further MFS‑style surprises emerging.
Private credit has grown faster than transparency, and faster than the regulatory perimeter. That mismatch — not any single default — is what now shadows the banks.
The issue
The central concern with private credit is simple: it has grown faster than the safeguards designed to contain it.
What was once a niche corner of finance is now a multi‑trillion‑pound shadow banking system whose risks are only partially visible to regulators, banks, or investors. That opacity is now becoming a problem.
Expansion
Private‑credit funds have expanded aggressively by offering speed, flexibility, and looser covenants than traditional banks. In a low‑rate world, that model looked benign. In a high‑rate world, it looks fragile.
Many borrowers were underwritten on assumptions that no longer hold: stable cashflows, cheap refinancing, and buoyant valuations. As rates stay elevated, those assumptions are breaking down.
Defaults
Defaults are rising, and recovery values are uncertain because loans are bespoke, illiquid, and rarely traded.
Liquidity
Liquidity is the second fault line. Private‑credit vehicles promise semi‑liquid access to investors while holding assets that cannot be sold quickly without taking a loss.
When redemptions pick up, funds resort to withdrawal gates, side pockets, or emergency financing lines from banks.
That is where the contagion risk emerges. Banks insist their exposures are modest, but they provide leverage, subscription lines, and warehousing facilities to the very funds now under pressure.
A liquidity squeeze in private credit can therefore boomerang back into the regulated system.
Valuation
Valuation risk is the third issue. Because loans are marked to model rather than market, losses can be slow to surface.
That delays recognition, masks stress, and encourages complacency. When reality finally intrudes — through a default, a refinancing failure, or a forced sale — the adjustment can be abrupt.
The final concern is concentration. Private credit is heavily exposed to software, healthcare, and sponsor‑backed roll‑ups. If one of these sectors turns, the losses will not be isolated.
Private credit is not about to collapse as such. But it is large, opaque, and increasingly interconnected — and that combination is rarely harmless.
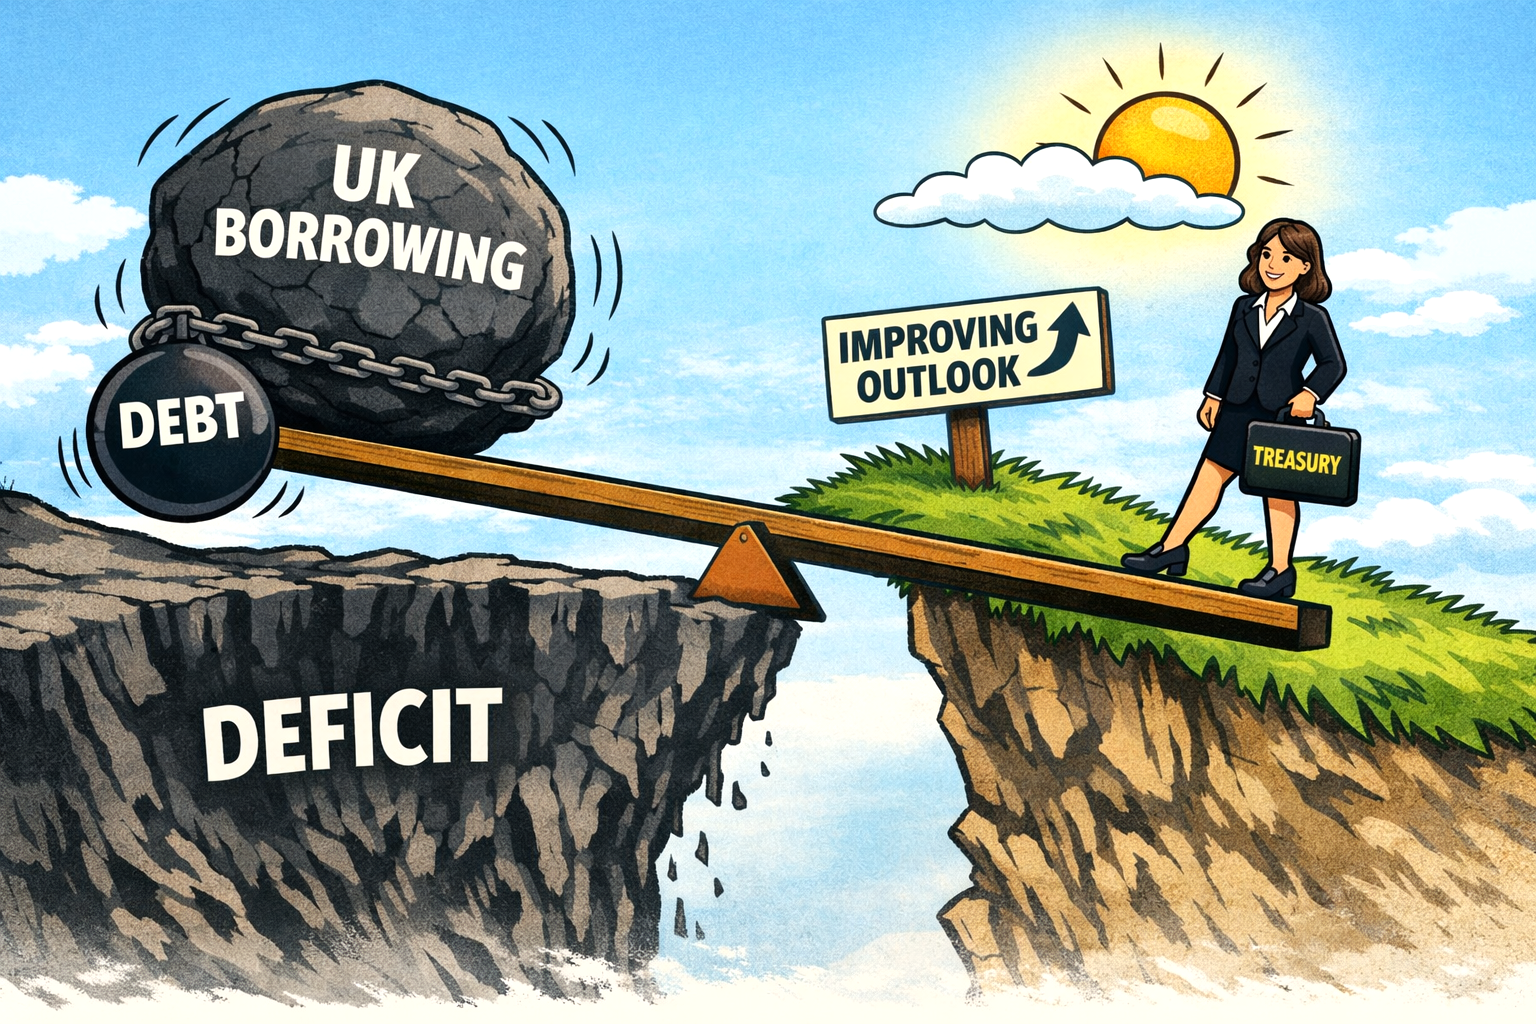
The latest public finance figures show that government borrowing has dropped to a lower‑than‑forecast level, helped by stronger tax receipts and easing inflationary pressures.
While the precise numbers will be scrutinised in the coming days, the headline outcome marks a modest but meaningful improvement in the UK’s fiscal position.
Softer inflation and lower interest rates
Analysts note that softer inflation has reduced the government’s debt‑interest bill, particularly on index‑linked gilts, which had surged during the inflation spike of the past two years.
The fall in borrowing also reflects a stabilising labour market and firmer wage growth, which have supported income‑tax and National Insurance receipts.
At the same time, lower market interest rates — driven by expectations of further Bank of England cuts after recent reductions to 3.75% — have eased short‑term financing costs for the Treasury.
High debt level
However, economists caution that the improvement should not be overstated. UK debt remains historically high, and pressures on public services, welfare spending, and capital investment persist.
Moreover, with growth still subdued and geopolitical risks keeping energy markets volatile, the fiscal outlook remains vulnerable to external shocks.
Even so, today’s figures provide the Chancellor with a welcome narrative shift: after years of deteriorating public finances, the government can point to early signs of stabilisation — albeit from a challenging starting point.
What the real data shows (ONS, published 23rd April 2026)
The latest ONS release confirms that UK government borrowing has indeed come in lower than expected, and the scale of the improvement is now clear:
Annual borrowing: £132.0 billion in the year to March 2026 — £19.8 billion lower than the previous year — £0.7 billion below the OBR forecast — Lowest level since 2022–23
March borrowing: £12.6 billion — £1.4 billion lower than March 2025 — Lowest March figure since 2022
Borrowing as % of GDP: — 4.3%, the lowest since 2019–20
The U.S./ Iran / Israel conflict with undoubtably hold the economy back as the effect has yet to fully filter through.
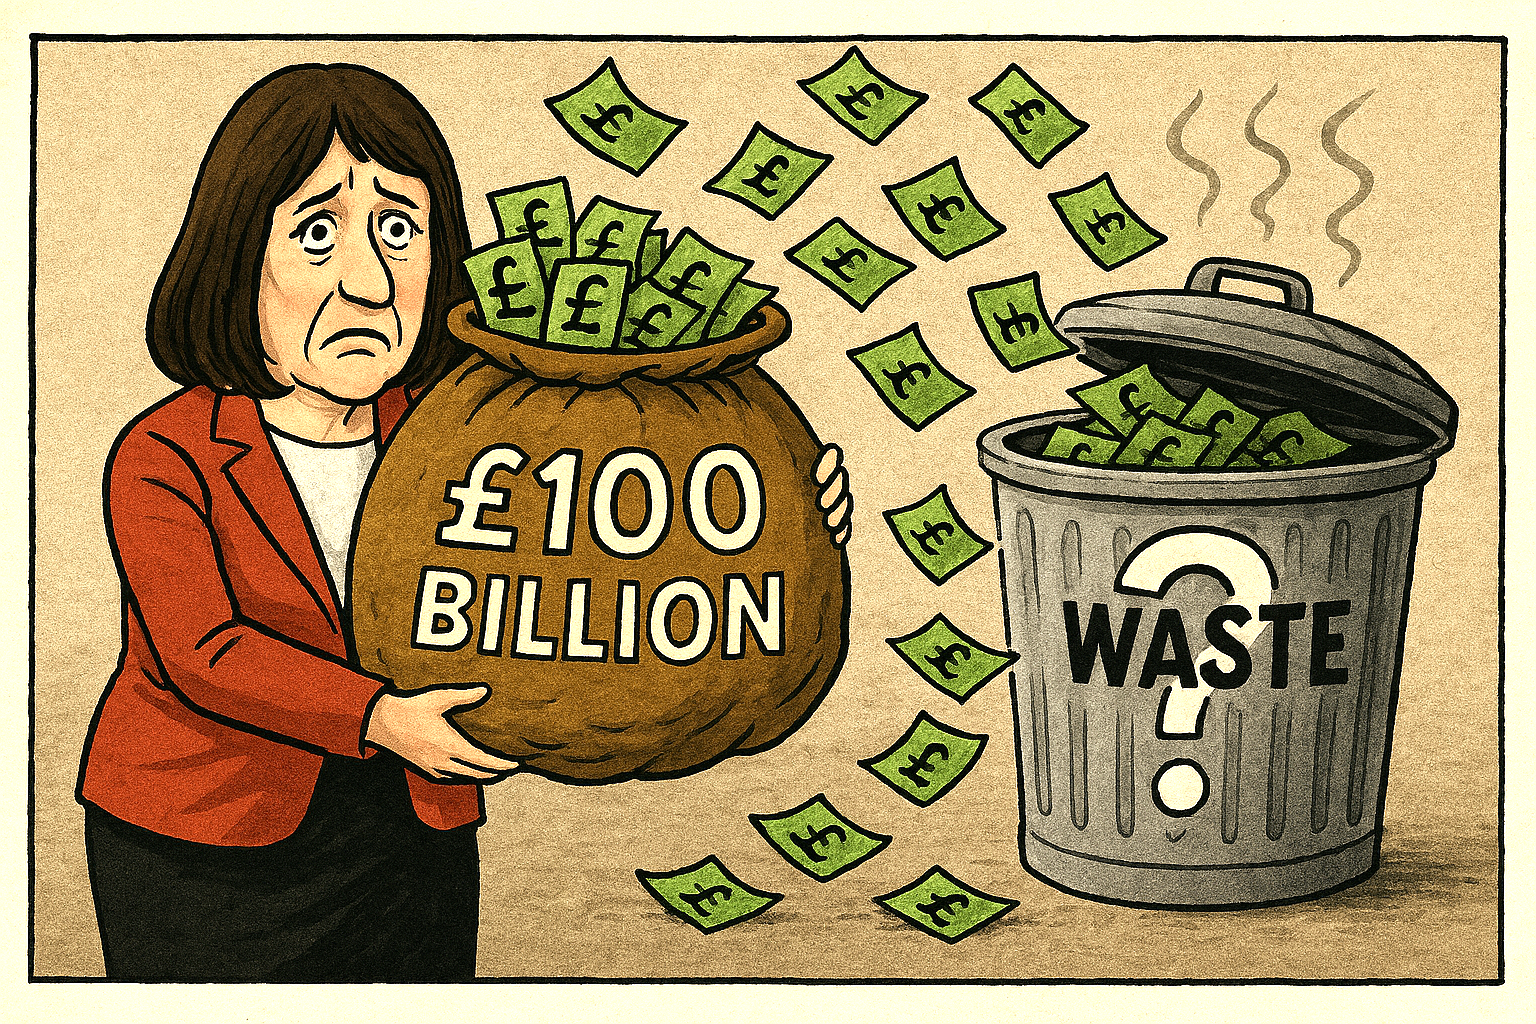
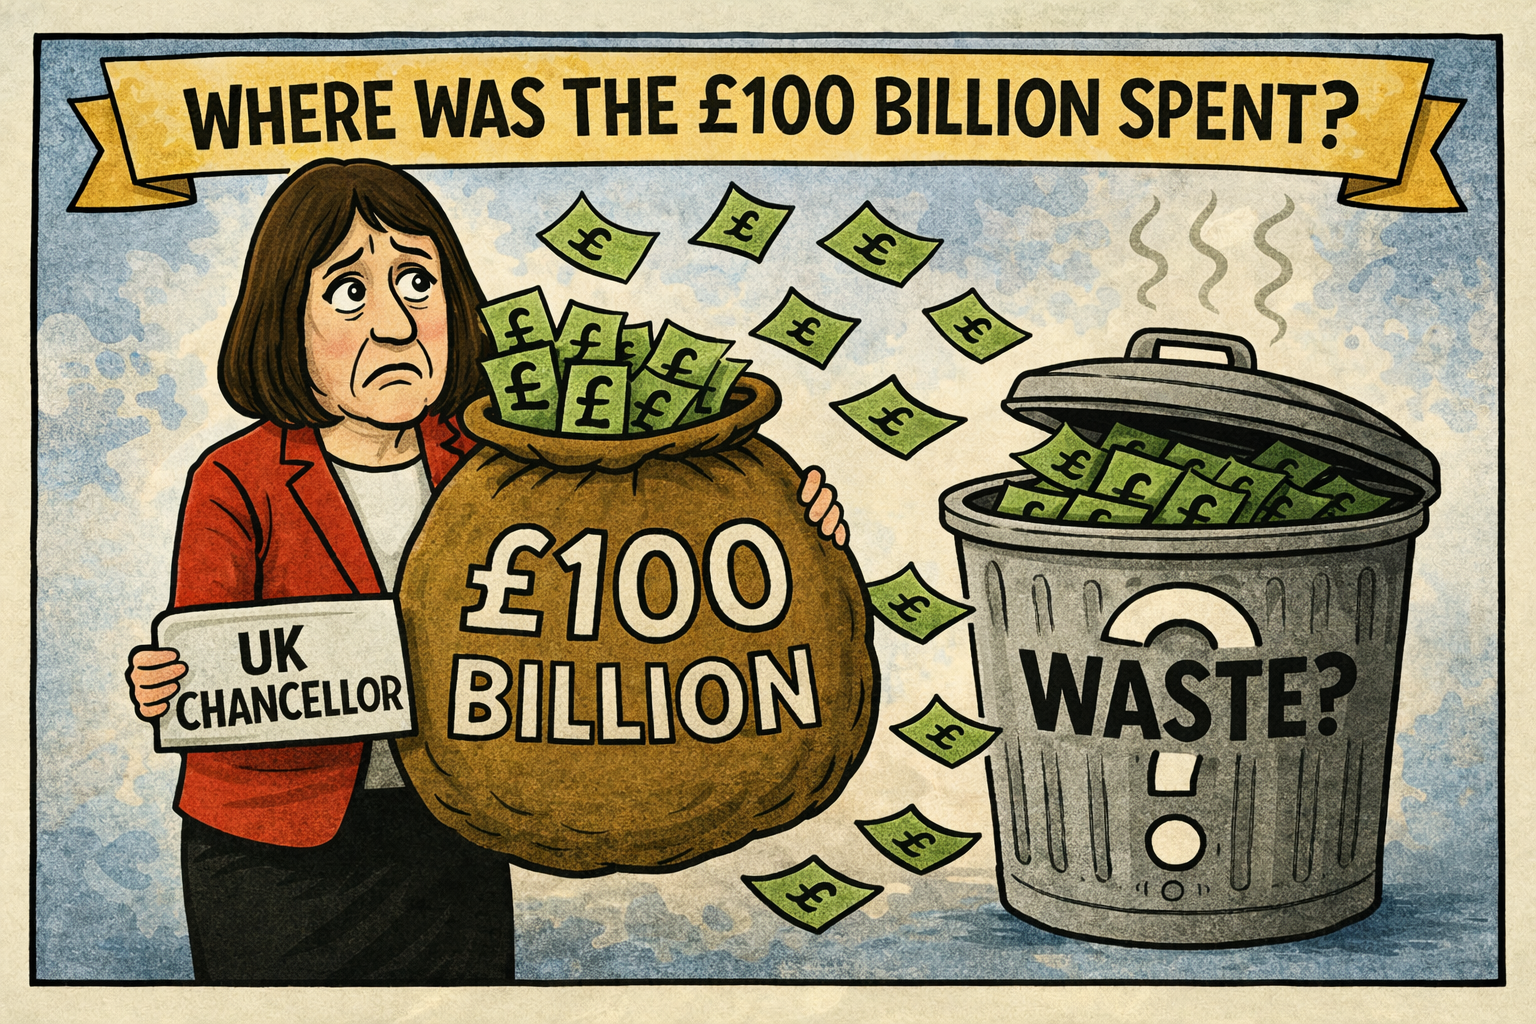
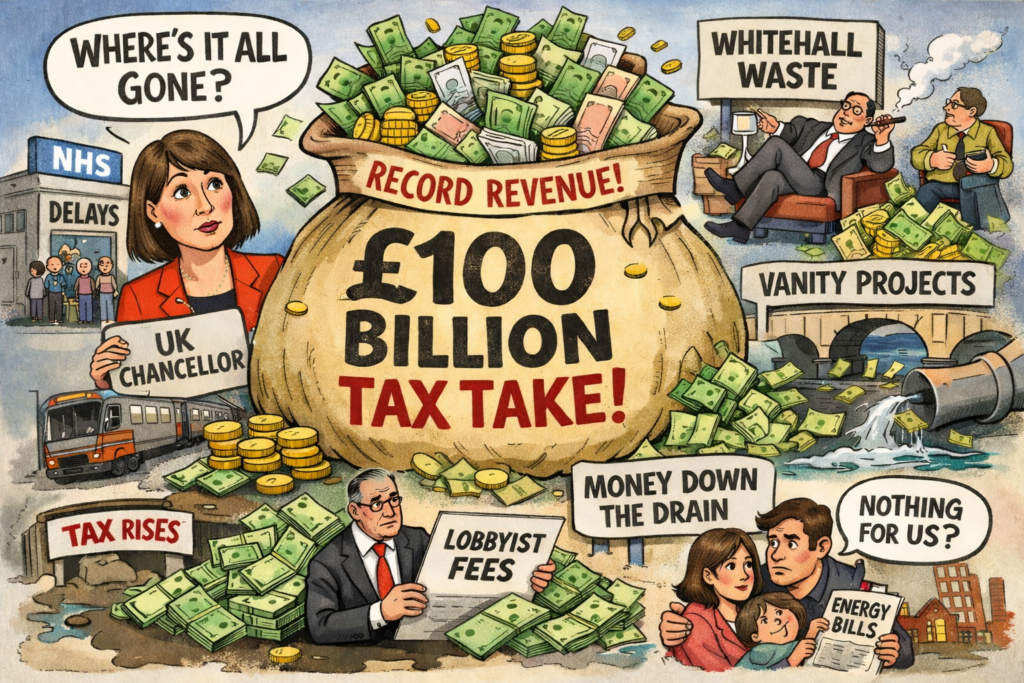
The Treasury’s latest figures reveal that the UK government collected more than £100 billion in taxes in a single month — a staggering sum that ought to signal a nation investing confidently in its future.
Yet the public mood tells a different story. For many households and businesses, the question is simple: if the money is flowing in at record levels, why does so little feel improved?
High Tax = Stable Economy?
ChancellorRachel Reeves has repeatedly argued that high tax receipts reflect a stabilising economy and the early impact of Labour’s ‘growth-first’ strategy.
(It could be argued that her first budget didn’t exactly help growth – remember higher employer N.I. changes)?
Income tax, corporation tax and VAT all contributed to the surge, boosted by wage inflation, fiscal drag, and stronger-than-expected corporate profits.
On paper, the numbers look impressive. In practice, the lived experience across the country is far less reassuring.
Public Services Stretched
Public services remain stretched to breaking point. NHS waiting lists have barely shifted, local councils warn of insolvency, and the school estate continues to creak under decades of underinvestment.
Commuters still face unreliable rail services, potholes remain a national embarrassment, and the promised acceleration of green infrastructure has yet to materialise in any visible way. For a government that insists it is rebuilding Britain, the early evidence is thin.
Reeves’ defenders argue that structural repair takes time. After years of fiscal instability, they say, the priority is stabilisation: paying down expensive debt, restoring credibility with markets, and creating the conditions for long-term investment.
More to Come
The UK Chancellor has also signalled that major spending commitments — particularly on housing, energy and industrial strategy — will ramp up later in the Parliament.
But this patience is wearing thin. Voters were promised renewal, not a holding pattern. When tax levels are at a post-war high, the public expects tangible returns: shorter hospital queues, safer streets, better transport, and a sense that the country is moving forward rather than treading water. Instead, many feel they are paying more for the same — or, in some cases, less.
The political risk for Reeves is clear. A £100 billion monthly tax take is a powerful headline, but it becomes a liability if people cannot see where the money is going.
Frustration?
Unless the government can convert revenue into visible progress — quickly and convincingly — the Chancellor may find that record receipts only fuel record frustration.
It’s a striking contradiction: a nation pulling in more than £100 billion in tax in a single month yet seeing almost none of the visible improvements such a windfall ought to deliver.
The reality is that much of this revenue is immediately swallowed by structural pressures — servicing an enormous debt pile, propping up struggling local authorities, covering inflation‑driven public‑sector pay settlements, and patching holes left by years of underinvestment.
What remains is too thinly spread to transform services that are already operating in crisis mode.
Slow Pace
High receipts don’t automatically translate into better outcomes when the state is effectively running just to stand still, and until the government can shift from firefighting to genuine renewal, even record‑breaking tax months will feel like money disappearing into a system that can no longer convert revenue into results.
First, it’s important to understand that a £100+ billion month (largely January, when self-assessment and corporation tax payments fall due) does not mean the government suddenly has £100 billion spare to spend. Most of it is absorbed by existing commitments.
Here’s broadly where UK tax revenue goes:
So, just how has the £100 billion tax haul likely been apportioned?
1. Health – The NHS
The National Health Service is the single largest area of public spending. Funding covers:
Hospitals and GP services
Staff wages (doctors, nurses, support staff)
Medicines and equipment
Reducing waiting lists
Health alone consumes well over £180 billion annually.
2. Welfare & Pensions
The biggest slice of all is often social protection:
State pensions
Universal Credit
Disability benefits
Housing support
An ageing population means pension spending continues to rise.
3. Debt Interest
Servicing national debt is expensive. With higher interest rates over the past two years, billions go purely on interest payments, not new services.
4. Education
Funding for:
Schools
Colleges
Universities
Early years provision
Teacher pay settlements and school building repairs are major costs.
5. Defence & Security
Including:
Armed forces
Intelligence services
Support for Ukraine
Nuclear deterrent maintenance
6. Transport & Infrastructure
Rail subsidies, road maintenance, major capital projects, and support during strikes or restructuring.
7. Local Government
Councils rely heavily on central funding for:
Social care
Waste collection
Housing services
So Why Doesn’t It Feel Like £100 Billion?
Because….
January is a seasonal spike, not a monthly average.
The UK still runs a large annual deficit.
Public debt is above £2.6 trillion.
Much of the revenue replaces borrowing rather than funds new projects.
In short, the money hasn’t vanished — it is largely sustaining an already over stretched ‘FAT’ state, servicing debt, and maintaining core services rather than delivering visible ‘new’ benefits.
As of January 2026, the Office for National Statistics (ONS) reported that public sector net debt excluding public sector banks stood at £2.65 trillion, which is approximately 96.5% of GDP.
While January 2026 saw a record monthly surplus of £30.4 billion — driven by strong self-assessed tax receipts — the overall debt burden remains historically high.
This level of debt reflects years of accumulated borrowing, pandemic-era spending, inflation-linked interest payments, and structural deficits.
Even with strong tax intake, the scale of the debt means that progress on reducing it is slow and incremental.
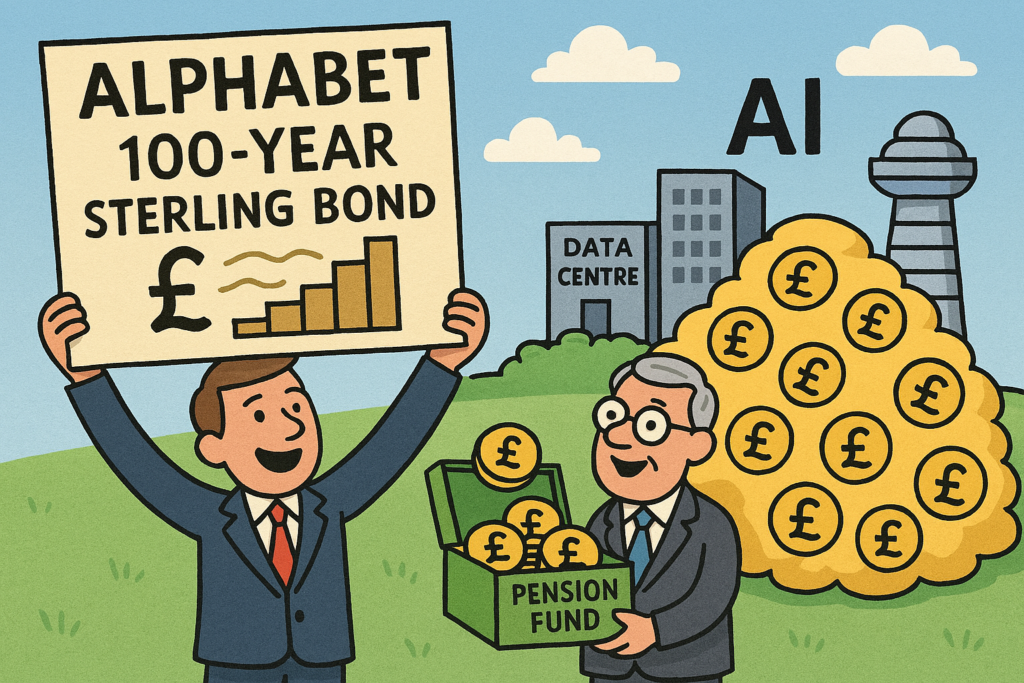
Alphabet’s decision to issue a 100-year sterling bond has captured the attention of global markets, not only because of its rarity but also because of what it signals about the escalating competition in artificial intelligence.
100 year sterling bond
A century-long bond denominated in pounds is an extraordinary financing move, particularly for a technology company.
It reflects both investor confidence in Alphabet’s long-term prospects and the scale of capital now required to compete in the AI era.
On the surface, the benefits are clear. Locking in funding for 100 years at today’s rates provides financial certainty. Alphabet can secure vast sums of capital without facing refinancing risk for generations.
In an industry defined by rapid change and enormous upfront costs — from data centres and semiconductor procurement to specialised AI chips and energy infrastructure — patient capital is invaluable.
Sterling
The sterling denomination also diversifies Alphabet’s funding base beyond U.S. dollar markets, potentially appealing to European institutional investors seeking stable, long-duration assets.
The bond may also be interpreted as a strategic signal. By committing to long-term financing, Alphabet demonstrates confidence in its ability to generate cash flows well into the next century.
It reinforces the company’s image as a durable, infrastructure-like enterprise rather than a volatile technology stock.
For investors such as pension funds and insurers, a 100-year instrument from a highly rated issuer can offer predictable returns in a world where long-term yield is scarce.
Cyclical
However, the move is not without shortcomings. Committing to fixed debt obligations over such an extended horizon reduces flexibility. While Alphabet currently enjoys strong balance sheet metrics, the technology sector is notoriously cyclical.
A century is an eternity in innovation terms. Business models, regulatory frameworks and geopolitical dynamics may shift dramatically.
Future generations of management will inherit the obligation, regardless of whether today’s AI investments deliver the expected returns.
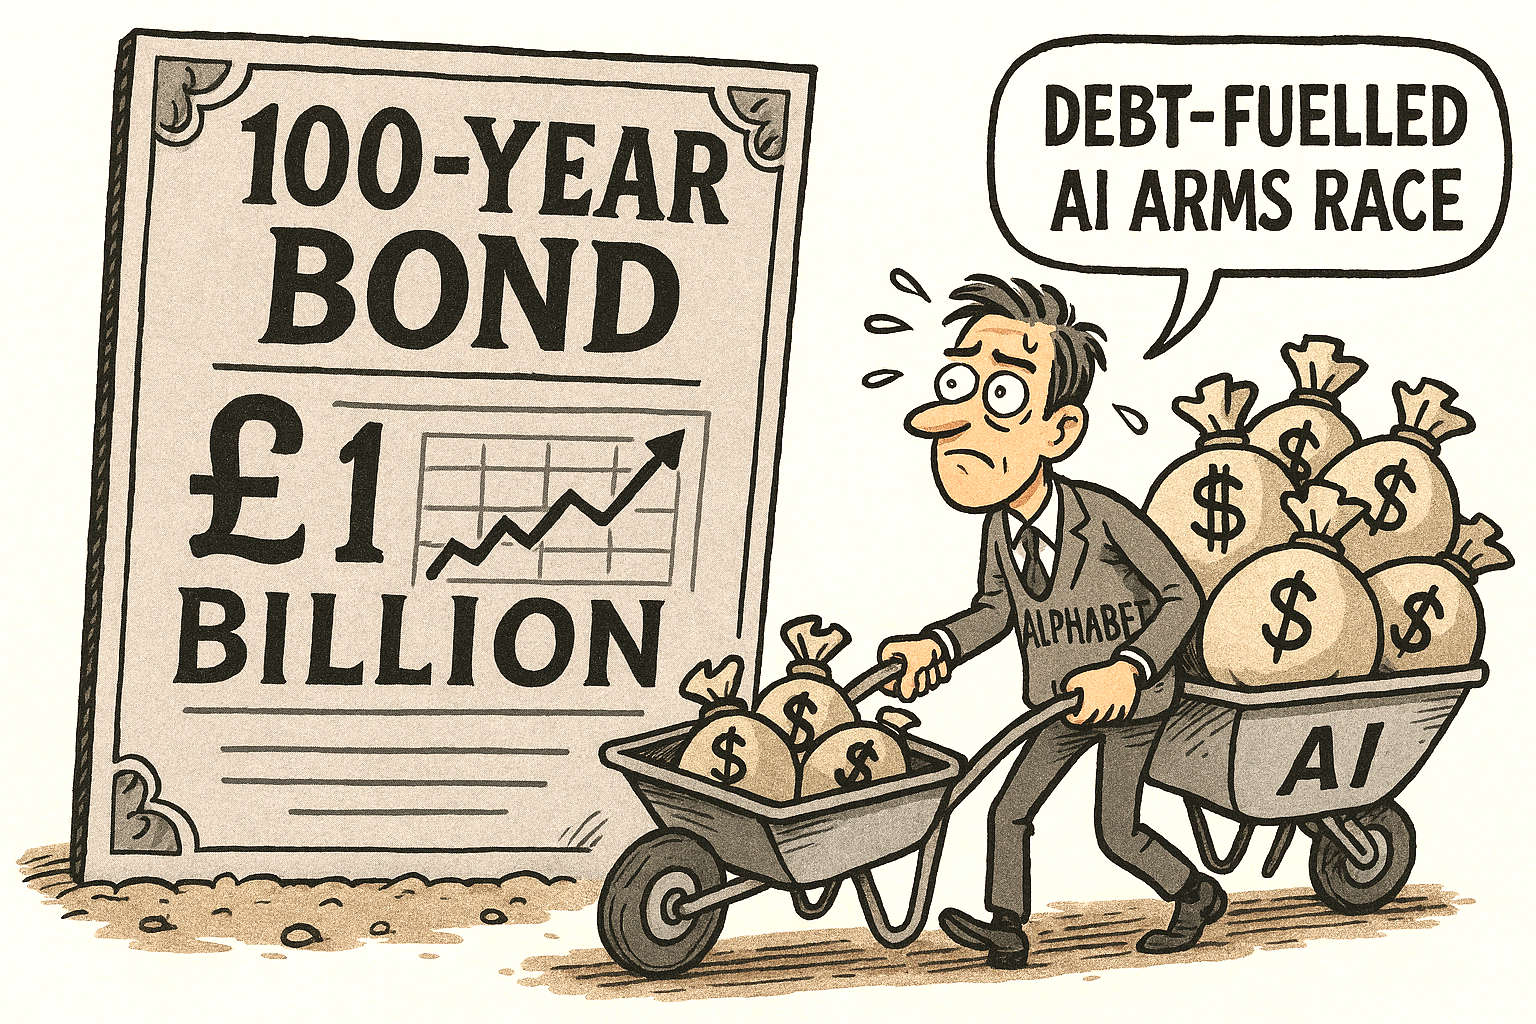
More broadly, the bond feeds concern about a debt-fuelled AI arms race. As technology giants pour tens of billions into AI research, chip design and cloud infrastructure, borrowing is becoming an increasingly prominent tool.
If rivals respond with similar long-dated issuance, the sector’s leverage could rise meaningfully. In a downturn or if AI monetisation disappoints; heavy debt burdens could amplify financial strain.
Ultimately, Alphabet’s 100-year sterling bond embodies both ambition and risk. It underlines the immense capital demands of the AI revolution while raising questions about whether today’s competitive fervour is encouraging companies to stretch their balance sheets too far in pursuit of technological dominance.
Systemic anxiety
The deeper anxiety is systemic. With Oracle, Amazon, Microsoft and others also scaling up borrowing, total tech‑sector issuance is projected to hit $3 trillion over five years.
Some analysts warn this resembles a late‑cycle credit boom, where investors chase thematic excitement rather than sober fundamentals.
Alphabet’s century bond may be a masterstroke of timing — or a marker of excess.
Either way, it crystallises the tension at the heart of the AI revolution: extraordinary promise, financed by extraordinary debt.
Why a Sterling Bond?
Alphabet issued its 100‑year sterling bond to tap deep UK demand for ultra‑long‑dated assets, especially from pension funds seeking to match long‑term liabilities.
The sterling market offered strong appetite, with orders reportedly reaching nearly ten times the £1 billion on offer.
It also formed part of Alphabet’s broader multi‑currency fundraising drive to finance massive AI‑related capital spending, including data‑centre expansion.
Issuing in sterling diversified its investor base, reduced reliance on U.S. dollar markets, and signalled confidence in its long‑term stability as a quasi‑infrastructure‑scale business.
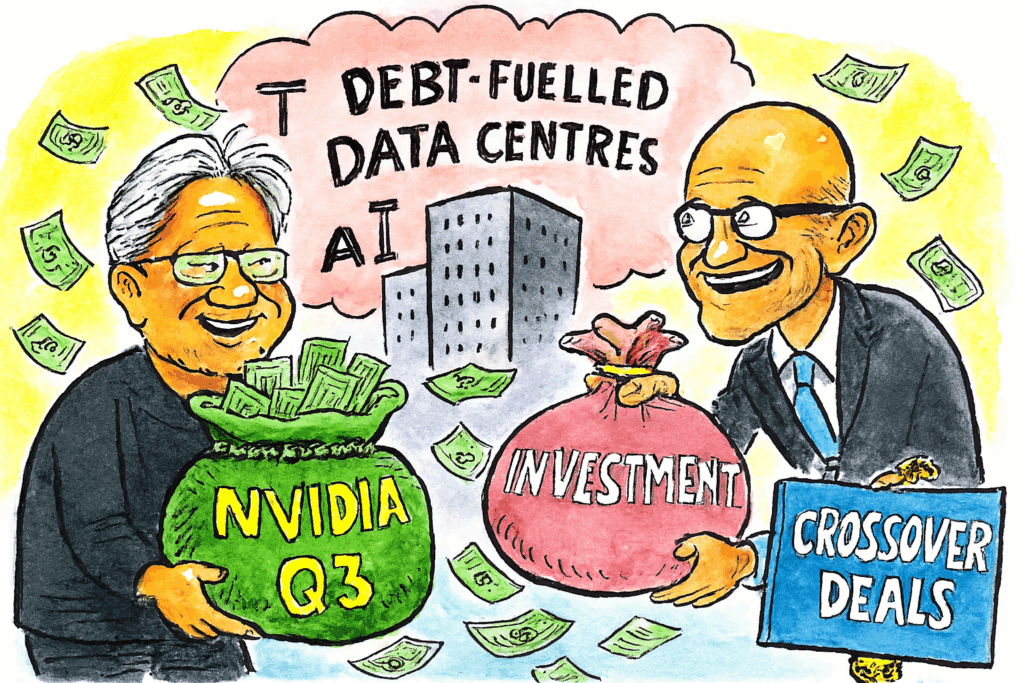
Nvidia’s Q3 results show strength, but the real risk of an AI bubble may lie in the debt-fuelled data centre boom and the circular crossover deals between tech giants.
Nvidia’s latest quarterly earnings were nothing short of spectacular. Revenue surged to $57 billion, up 62% year-on-year, with net income climbing to nearly $32 billion. The company’s data centre division alone contributed $51.2 billion, underscoring how central AI infrastructure has become to its growth.
These figures have reassured investors that Nvidia itself is not the weak link in the AI story. Yet, the question remains: if not Nvidia, where might the bubble be forming?
Data centre roll-out
The answer may lie in the debt-driven expansion of AI data centres. Building hyperscale facilities requires enormous capital outlays, not only for GPUs but also for power, cooling, and connectivity.
Many operators are financing this expansion through debt, betting that demand for AI services will continue to accelerate. While Nvidia’s chips are sold out and cloud providers are racing to secure supply, the sustainability of this debt-fuelled growth is less certain.
If AI adoption slows or monetisation lags, these projects could become overextended, leaving balance sheets strained.
Crossover deals
Another area of concern is the crossover deals between major technology companies. Nvidia’s Q3 was buoyed by agreements with Intel, OpenAI, Google Cloud, Microsoft, Meta, Oracle, and xAI.
These arrangements exemplify a circular investment pattern: companies simultaneously act as customers, suppliers, and investors in each other’s AI ventures.
While such deals create momentum and headline growth, they risk masking the true underlying demand.
If much of the revenue is generated by companies trading capacity and investment back and forth, the market could be inflating itself rather than reflecting genuine end-user adoption.
Bubble or not to bubble?
This dynamic is reminiscent of past bubbles, where infrastructure spending raced ahead of proven returns. The dot-com era saw fibre optic networks built faster than internet businesses could monetise them.
Today, AI data centres may be expanding faster than practical applications can justify. Nvidia’s results prove that demand for compute is real and immediate, but the broader ecosystem may be vulnerable if debt levels rise and crossover deals obscure the true picture of profitability.
In short, Nvidia’s strength does not eliminate bubble risk—it merely shifts the spotlight elsewhere. Investors and policymakers should scrutinise the sustainability of AI infrastructure financing and the circular nature of tech partnerships.
The AI revolution is undoubtedly transformative, but its foundations must rest on genuine demand rather than speculative debt and self-reinforcing deals.
Following the passage of President Donald Trump’s sweeping tax and spending legislation, dubbed the One Big Beautiful Bill, the U.S. national debt has officially soared to nearly $37 trillion, with projections suggesting it could hit $40 trillion by year’s end.
The bill, which extends 2017 tax cuts and introduces expansive spending on defence, border security, and domestic manufacturing, has sparked fierce debate across Washington and Wall Street.
Critics argue the legislation lacks meaningful offsets, with no new taxes or spending cuts to balance its provisions.
Interest payments alone reached $1.1 trillion in 2024, surpassing the defence budget. The Congressional Budget Office estimates the bill could add $3.3 trillion to the deficit over the next decade.
Musk has labelled the bill a ‘disgusting abominatio’ and warned it undermines fiscal responsibility.
He has reportedly pledged to fund primary challengers against Republicans who supported the measure, accusing them of betraying their promises to reduce spending.
Musk’s concerns go beyond economics. He argues the bill reflects a broken political system dominated by self-interest, calling for the creation of a new political movement, the America Party, to restore accountability.
While the White House insists the bill will spur economic growth and eventually reduce the debt-to-GDP ratio, sceptics remain unconvinced.
With the debt ceiling raised by a record $5 trillion, the long-term implications for America’s financial stability are now front and centre.
As the dust settles, the clash between Trump’s fiscal vision and Musk’s warnings sets the stage for a turbulent political and economic period ahead.
The U.S. bond market is experiencing some turbulence due to rising Treasury yields and concerns over government debt.
Investors are demanding higher yields because they’re worried about the GOP’s tax-cut plans, which could lead to increased borrowing and a larger deficit.
Additionally, the recent Trump tax bill has caused Treasury bond yields to surge, as investors anticipate more government debt issuance. Moody’s has also downgraded the U.S. credit rating, adding to market jitters.
The bond market’s reaction is significant because higher yields can lead to increased borrowing costs across the economy, affecting everything from mortgages to corporate financing.
Japan
Japan’s bond market is facing significant turbulence, with yields on 40-year government bonds hitting an all-time high. This surge in yields is causing concerns about capital repatriation, as Japanese investors may start pulling funds from the U.S. and other foreign markets.
The Bank of Japan’s reduced bond purchases have contributed to this trend, leading to weaker demand for long-term government debt. Analysts warn that if Japanese investors begin moving their capital back home, it could trigger a global financial market shake-up.
Additionally, Japan’s Finance Ministry is considering reducing the issuance of super-long bonds to stabilise the market. However, recent auctions have shown weak demand, raising concerns about the effectiveness of this strategy.
Europe
The European bond market is experiencing some shifts due to falling government bond yields and easing U.S. – EU trade tensions.
German 10-year bund yields dropped by 4 basis points, reflecting increased investor confidence.
UK and French 10-year bond yields also declined by 4 basis points, while Italian bonds saw a 2 basis point dip.
Long-term UK gilts experienced the biggest movement, with 20 and 30-year yields falling by 7 basis points.
This decline in yields suggests higher demand for European government debt, possibly due to investors shifting away from U.S. assets amid concerns over U.S. fiscal health.
UK
The UK bond market is facing some challenges, with the IMF warning that it is vulnerable to sudden shocks due to a growing reliance on hedge funds and foreign investors.
30-year gilt yields have hit 5.5%, the highest in over three decades.
The Bank of England’s quantitative tightening and increased bond issuance are putting pressure on the market.
Moody’s Investors Service has downgraded the United States’ sovereign credit rating from Aaa to Aa1, citing concerns over the country’s growing debt burden and rising interest costs.
This marks the first time Moody’s has lowered the U.S. rating, aligning it with previous downgrades by Standard & Poor’s (2011) and Fitch Ratings (2023).
The downgrade reflects the increasing difficulty the U.S. government faces in managing its fiscal deficit, which has ballooned to $1.05 trillion – a 13% increase from the previous year.
Moody’s analysts noted that successive administrations have failed to implement effective measures to curb spending, leading to a projected U.S. debt burden of 134% of GDP by 2035.
Market reactions were swift, with U.S. Treasury yields rising and stock futures sliding as investors reassessed the risk associated with U.S. assets. The downgrade could lead to higher borrowing costs for the government and businesses, potentially slowing economic growth.
Despite the downgrade, Moody’s emphasised that the U.S. retains exceptional credit strengths, including its large, resilient economy and the continued dominance of the U.S. dollar as the global reserve currency.
However, without significant fiscal reforms, further credit rating adjustments may be inevitable.
The latest UK borrowing figures, reveal a significant increase in public sector net borrowing. In December 2024, the UK government borrowed £17.8 billion, which is the highest figure for the month for four years.
This amount was reportedly £10.1 billion higher than the same month last year and exceeded the £14.1 billion forecast by most economists.
The reported rise in borrowing was driven by several factors, including increased spending on public services, benefits, debt interest, and capital transfers. The interest payable on central government debt alone was £8.3 billion, nearly £4 billion higher than the previous year.
Additionally, a reduction in National Insurance contributions following rate cuts earlier in 2024 partially offset the increase in tax receipts.
Chancellor Rachel Reeves faces a challenging fiscal environment, with borrowing costs rising due to lower economic growth, higher public sector wages, and increased benefits payments. The unexpected jump in December 2024’s borrowing highlights the difficulties in balancing the budget and maintaining economic stability. The Chancellor’s budget was one of growth, but employer NI hikes have unravelled her ‘growth’ plan.
Despite the rise in borrowing, government bond prices remained relatively stable, suggesting that traders were not overly concerned by the surge. However, the overall fiscal position remains precarious, with public sector net debt estimated at 97.2% of GDP, the highest level since the early 1960s.
The government has pledged to take a hard line on unnecessary spending and to ensure that every penny of taxpayer money is spent productively.
As the fiscal year progresses, the Chancellor will need to navigate these financial challenges carefully to maintain economic stability and growth.
However, it is anticipated next month, following the January tax income boost, figures will appear favourable for the government, albeit temporarily.
As of September 2024, the UK’s national debt stands at £2,685.6 billion, which is approximately 100% of the country’s GDP. This is the highest level of public sector debt since 1961.
UK debt and its borrowing
As of 2024, the United Kingdom’s national debt has reached a staggering £2,685.6 billion, an amount equivalent to the nation’s GDP. This surge in debt, driven by persistent borrowing, has sparked significant economic and political debate.
Historical context
The UK’s debt levels have fluctuated over time, influenced by wars, recessions, and policy decisions. However, the current debt level marks a significant peak not seen since the early 1960s.
The Financial Crisis of 2008 saw the debt-to-GDP ratio rise sharply as the government borrowed heavily to stabilize the banking sector and stimulate the economy. More recently, the COVID-19 pandemic necessitated extensive government borrowing to fund health services, furlough schemes, and business support measures, exacerbating the debt situation.
Government borrowing
Government borrowing, or public sector net borrowing, is the amount by which government expenditures exceed its revenues. This borrowing is essential for funding various public services, infrastructure projects, and welfare programs.
While borrowing can be a tool for stimulating economic growth, especially during downturns, it also raises concerns about fiscal sustainability and the burden on future generations.
Economic Implications
High levels of national debt can have profound economic implications. On the one hand, government spending can stimulate economic activity, create jobs, and drive growth. However, excessive borrowing can lead to increased interest payments, diverting resources from essential services like healthcare and education.
Additionally, high debt levels can reduce investor confidence, potentially leading to higher borrowing costs for the government and businesses.
Debt management strategies
The UK government employs various strategies to manage its debt. These include issuing government bonds to investors, which provide a relatively low-cost means of borrowing. The Bank of England also plays a crucial role, particularly through its monetary policies, such as setting interest rates and implementing quantitative easing programs.
The government’s fiscal policy, which includes tax and spending measures, is another key component in managing the debt.
The future
Looking ahead, the UK’s debt trajectory will depend on several factors, including economic growth rates, government policy decisions, and global economic conditions.
While reducing the debt burden is a priority, balancing fiscal responsibility with the need for economic stimulus remains a delicate act. Policymakers must navigate this complex landscape to ensure long-term economic stability and prosperity for future generations.
UK debt in direct relation to UK GDP from 1980 – 2024
Since the 1950s, UK debt has gone through several cycles. Post-World War II, debt was high due to reconstruction efforts.
The 1980s saw a decline in debt, thanks to privatisation and reduced public spending. However, the 2008 financial crisis caused a sharp increase, followed by more borrowing during the COVID-19 pandemic, reaching 100% of GDP in 2024.
UK public sector borrowing
Public sector debt as a proportion of GDP
How does the UK government borrow money?
The government raises funds by issuing financial instruments known as bonds. A bond represents a commitment to repay borrowed money in the future, typically with periodic interest payments until maturity.
UK government bonds, or ‘gilts’ are generally regarded as secure investments, carrying minimal risk of non-repayment. Institutions both within the UK and internationally, including pension funds, investment funds, banks, and insurance companies, are the primary purchasers of gilts.
Additionally, the Bank of England has purchased substantial amounts of government bonds in the past as an economic stimulus measure through a mechanism known as ‘quantitative easing’.
How much is the UK government borrowing?
The government’s borrowing fluctuates monthly. For example, in January, when tax returns are filed, there’s typically a surge in revenue as many pay a significant portion of their taxes at once. Therefore, it’s more informative to consider annual or year-to-date figures.
In the financial year ending March 2024, the government borrowed £121.9 billion. The latest data for September 2024 indicates borrowing at £16.6 billion, up by £2.1 billion compared to September 2023.
The national debt refers to the total amount owed by the government, which stands at approximately £2.8 trillion. This figure is comparable to the gross domestic product (GDP) of the UK, which is the total value of goods and services produced in the country annually.
The current debt level has more than doubled since the period from the 1980s up to the 2008 financial crisis. Factors such as the financial crash and the Covid pandemic have escalated the UK’s debt from its historical lows to where it is now.
However, when considering the economy’s size, the UK’s debt is relatively low compared to much of the previous century and to that of other major economies.
How much money does the UK government pay in interest?
As the national debt increases, so does the interest that the government must pay. This additional cost was manageable when interest rates were low throughout the 2010s, but it became more burdensome after the Bank of England increased interest rates.
The government’s interest payments on the national debt are variable and reached a 20-year peak in early October 2023. Approximately a quarter of the UK’s debt is tied to inflation, meaning that payments increase with rising inflation.
This situation led to a significant rise in the cost of debt service, though these payments have begun to decrease. If the government allocates more funds to debt repayment, it could result in reduced spending on public services, which were the original reason for the borrowing.
In conclusion, while the UK’s debt and borrowing levels present challenges, strategic management and informed policy decisions will be crucial in navigating the path forward.
The UK debt total vs GDP is now as of 2024 all but 100%
Highest ratio since the 1960’s and even higher than that reached during the Covid pandemic of 2020.
The UK’s national debt has reached its highest level since 1962.
Official figures from the ONS show that the total government debt amounted to 99.5% of the economy’s value in June 2024, surpassing the peak levels experienced during the coronavirus pandemic.
The current debt level is comparable to that last observed in the early 1960’s.
The world is in debt to the tune of $315 trillion, and counting.
$315,000,000,000,000
$315 trillion or $315,000,000,000,000 is a daunting number, it’s massive. In 2024, the global GDP reached just $109.5 trillion, just over a third of the global debt figure.
Perspective
To provide some perspective, with the world population at roughly 8.1 billion, if the debt were distributed evenly, each person would shoulder about $39,000 in debt.
As global debt reaches unprecedented levels, concerns naturally arise about its implications and origins.
Global debt
Global debt includes borrowings by households, businesses, and governments.
Household debt
Household debt, which many are familiar with, comprises mortgages, credit cards, and student loans. At the beginning of 2024, it stood at $59.1 trillion.
Corporate debt
Corporate debt, utilized by businesses for operations and growth, reached $164.5 trillion, with the financial sector contributing $70.4 trillion.
Government debt
Government debt, on the other hand, finances public services and projects without raising taxes. It can be obtained from other nations or institutions like the World Bank and the IMF, or through bond sales, which are essentially promises to pay with interest from the state to investors.
Public debt
Public debt was reported to be $91.4 trillion. While often perceived negatively, debt can be advantageous, supporting individuals in education and homeownership, aiding business expansion, and providing governments with means for economic development, social expenditures, or crisis management.
History
Historical evidence shows that public debt has been around for at least 2000 years, mainly for establishing settlements and financing wars, with governments accruing significant debts from conflicts such as the Napoleonic Wars.
Debt engulfs us all and is here to stay, but at what cost to society?
The federal debt reportedly reached $34.5 trillion, marking an increase of approximately $11 trillion since March 2020.
This surge has sparked discussions among government and financial leaders, with a notable Wall Street firm questioning whether the associated costs could threaten the stock market’s upward trend. The Congressional Budget Office projects that the public debt will soon surpass any previously recorded levels relative to GDP.
Federal Reserve Chair Jerome Powell has emphasized the urgency for elected officials to address this issue promptly.