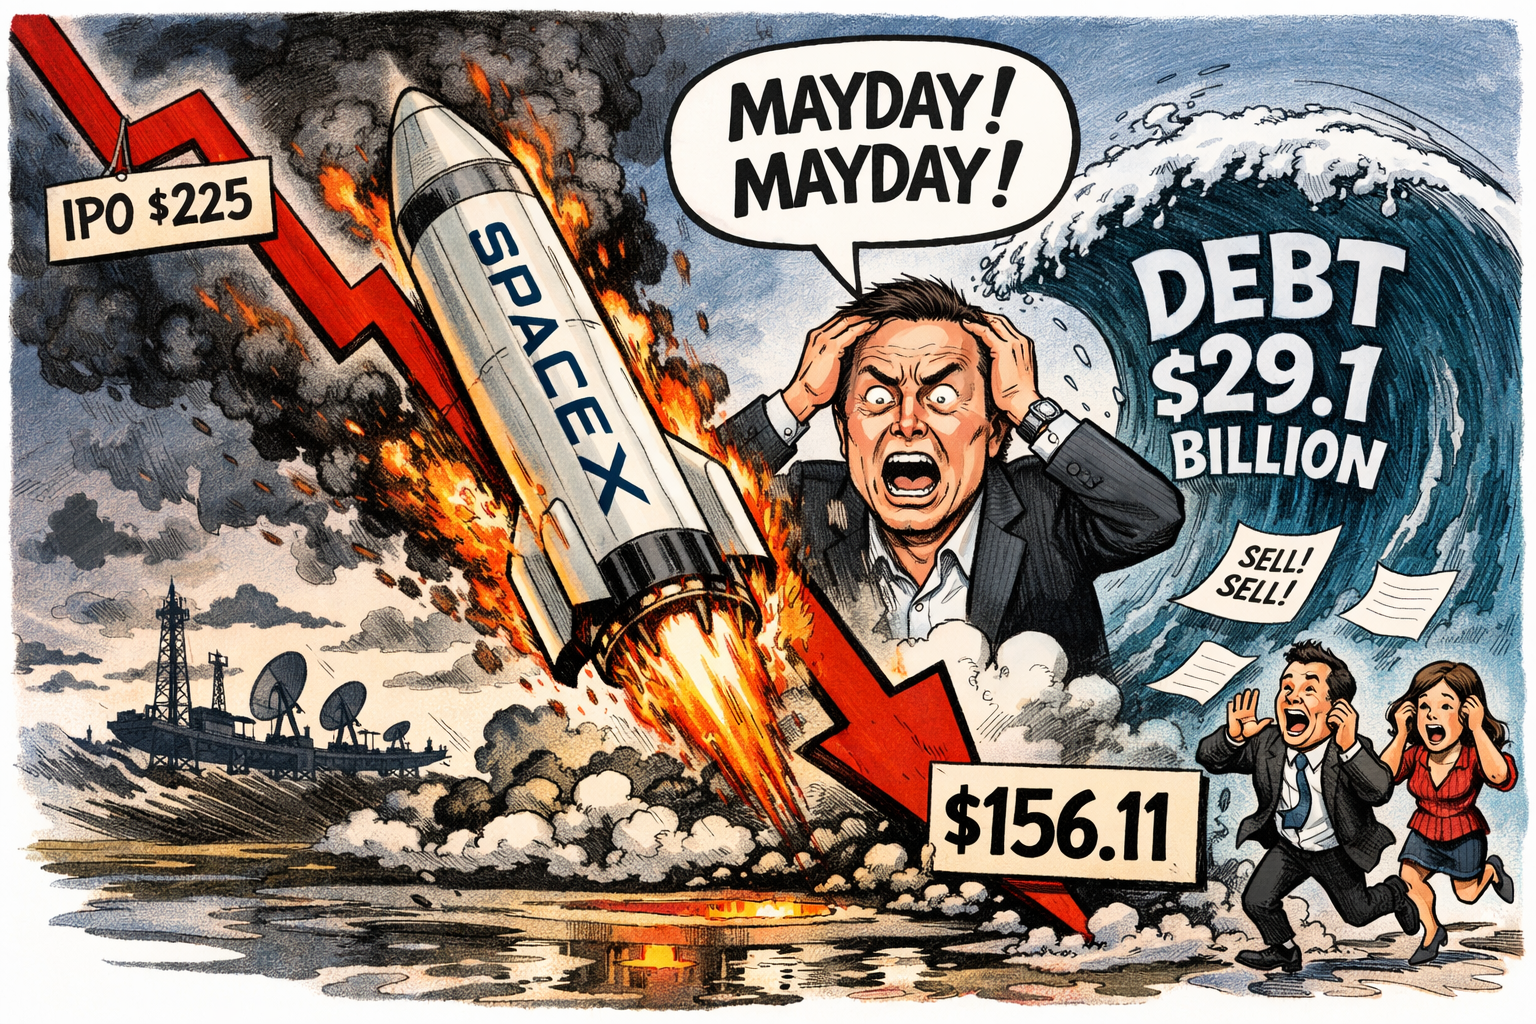
SpaceX shares now trade at $156.11, down more than 30% from their post‑IPO peak of $225.64, and the company is carrying roughly $29.1 billion in long‑term debt.
Less than two weeks after its record‑breaking IPO, SpaceX has surrendered the majority of its early gains. The stock, which opened for public trading at $150 and surged to an intraday high of $225.64 on 16 June, has since fallen more than 30%, briefly dipping below its debut price before stabilising around $156.11.
Dramatic reversal
The reversal has been dramatic. At its height, SpaceX’s valuation briefly exceeded Amazon and Microsoft, fuelled by a thin free float, intense retail demand, and exuberance around its AI‑compute ambitions.
But sentiment turned quickly as investors reassessed the sustainability of such rapid gains. A three‑day slide wiped out more than $600 billion in market value, dragging the company back toward its opening‑day levels.
Big one-day loss
Monday’s 16% plunge alone erased nearly $400 billion, one of the largest single‑day market‑cap losses in U.S. history. The stock’s volatility has been amplified by a broader tech sell‑off, with rising interest‑rate expectations hitting high‑valuation companies hardest.
Debt load: bridge financing, bond issuance, and the new capital structure
SpaceX’s debt position has become a central focus of the market’s reassessment. Ahead of the IPO, the company refinanced its borrowings with a $20 billion bridge loan, replacing five earlier debt facilities tied to both SpaceX and Musk’s AI venture, xAI. This brought total debt to $20.07 billion as of March.
Since listing, SpaceX has moved rapidly to restructure that short‑term financing. It has launched its first‑ever investment‑grade bond sale, targeting around $20–25 billion in new notes, with proceeds earmarked to repay the bridge loan and fund AI and Starship development.
Regulatory filings reportedly show the company now holds $29.1 billion in long‑term debt, alongside a massive $100.8 billion cash position built through the IPO and earlier funding rounds.
A company still in transition
SpaceX remains one of the world’s most valuable companies, but the market is now pricing it more soberly.
The stock is still above its $135 IPO price, yet the early euphoria has given way to questions about valuation, capital intensity, and the scale of its AI and space‑infrastructure ambitions.
Don’t forget – this is an Elon Musk company after all, and its early days.