China’s rare Earth clampdown continues to send shockwaves through global markets

Rare Earth Materials

China’s latest tightening of rare earth exports has reignited global concerns over supply chain fragility and strategic resource dependence.

With Beijing now requiring special permits for the export of key rare earth elements—used in everything from electric vehicles to missile guidance systems—the move is widely seen as a geopolitical lever in an increasingly fractured global trade landscape.

Rare earths, despite their name, are not scarce—but China controls over 60% of global production and an even larger share of refining capacity. The new restrictions, framed as national security measures, have already begun to ripple through equity markets.

Shares of Western mining firms such as Albemarle and MP Materials surged on the news, as investors bet on alternative sources gaining traction. Meanwhile, defence and tech stocks in Europe dipped, reflecting fears of supply bottlenecks and rising input costs1.

This isn’t China’s first foray into rare earth brinkmanship. Similar curbs in 2010 triggered a scramble for diversification, but progress has been slow.

The current squeeze coincides with rising tensions over semiconductor access and military technology, suggesting a broader strategy of resource weaponisation.

For investors, the message is clear: rare earths are no longer just a niche commodity—they’re a geopolitical flashpoint. Expect increased volatility in sectors reliant on high-performance magnets, batteries, and advanced optics.

Countries like the US, Australia, and Canada are accelerating domestic mining initiatives, but scaling up remains a long-term play.

In the short term, China’s grip on rare earths is tightening—and markets are reacting accordingly.

As the global economy pivots toward electrification and AI-driven infrastructure, the battle over these elemental building blocks is only just beginning. The stocks may rise and fall, but the strategic stakes are climbing ever higher.

China’s sweeping export restrictions on rare earths have triggered a sharp rally in related stocks, especially among U.S.-based producers and processors.

The market is interpreting Beijing’s move as both a supply threat and a strategic opportunity for non-Chinese firms to gain ground.

📈 Some companies in the spotlight

  • USA Rare Earth surged nearly 15% in a single day and is up 94% over the past five weeks, buoyed by speculation of a potential U.S. government investment and its vertically integrated magnet production pipeline.
  • NioCorp Developments, Ramaco Resources, and Energy Fuels all posted gains of approximately between 9–12%.
  • MP Materials, the largest U.S. rare earth miner, rose over 6% following news of tighter Chinese controls. The company recently secured a strategic equity deal with the U.S. Department of Defence.
  • Albemarle, Lithium Americas, and Trilogy Metals also saw modest gains, reflecting broader investor interest in critical mineral plays.
Company / SectorStock MovementStrategic Note
MP Materials (US)↑ +6%DoD-backed, key US supplier
USA Rare Earth↑ +15%Magnet pipeline, gov’t investment buzz
NioCorp / Ramaco / Energy Fuels↑ +9–12%Domestic mining surge
European Defence Stocks↓ 2–4%Supply chain fears
Chinese Magnet Producers↔ / ↓Export permit uncertainty

China’s new rules, effective December 1st, require export licences for any product containing more than 0.1% rare earths or using Chinese refining or magnet recycling tech. This has intensified scrutiny on global supply chains and elevated the strategic value of domestic alternatives.

🧭 Investor sentiment is shifting toward companies that can offer secure, non-Chinese sources of rare earths—especially those with downstream capabilities like magnet manufacturing. The rally suggests markets are pricing in long-term geopolitical risk and potential government backing.

Weekend update

Is President Trump in control of the stock market? A comment on TruthSocial suggesting that more China tariffs might be introduced in response to China’s restrictions on rare earth materials reportedly wipes out around $2 trillion from U.S. stocks.

Then it reverses as Trump says, ‘All will be fine’. Stocks climb back up. What’s going on?

It’s just a game.

But who is the game master?

AI Crash! Correction or pullback? Something is coming…

AI Bubble concerns

Influential figures and institutions are sounding the AI alarm—or at least raising eyebrows—about the frothy valuations and speculative fervour surrounding artificial intelligence.

Who’s Warning About the AI Bubble?

🏛️ Bank of England – Financial Policy Committee

  • View: Stark warning.
  • Quote: “The risk of a sharp market correction has increased.”
  • Why it matters: The BoE compares current AI stock valuations to the dotcom bubble, noting that the top five S&P 500 firms now command nearly 30% of market cap—the highest concentration in 50 years.

🏦 Jerome Powell – Chair, U.S. Federal Reserve

  • View: Cautiously sceptical.
  • Quote: Assets are “fairly highly valued.”
  • Why it matters: While not naming AI directly, Powell’s remarks echo broader concerns about tech valuations and investor exuberance.

🧮 Lisa Shalett – Chief Investment Officer, Morgan Stanley Wealth Management

  • View: Deeply concerned.
  • Quote: “This is not going to be pretty” if AI capital expenditure disappoints.
  • Why it matters: Shalett warns that 75% of S&P 500 returns are tied to AI hype, likening the moment to the “Cisco cliff” of the early 2000s.

🌍 Kristalina Georgieva – Managing Director, IMF

  • View: Watchful.
  • Quote: Financial conditions could “turn abruptly.”
  • Why it matters: Georgieva highlights the fragility of markets despite AI’s productivity promise, warning of sudden sentiment shifts.

🧨 Sam Altman – CEO, OpenAI

  • View: Self-aware caution.
  • Quote: “People will overinvest and lose money.”
  • Why it matters: Altman’s admission from inside the AI gold rush adds credibility to bubble concerns—even as his company fuels the hype.

📦 Jeff Bezos – Founder, Amazon

  • View: Bubble-aware.
  • Quote: Described the current environment as “kind of an industrial bubble.”
  • Why it matters: Bezos sees parallels with past tech manias, suggesting that infrastructure spending may be overextended.

🧠 Adam Slater – Lead Economist, Oxford Economics

  • View: Analytical.
  • Quote: “There are a few potential symptoms of a bubble.”
  • Why it matters: Slater points to stretched valuations and extreme optimism, noting that productivity projections vary wildly.

🏛️ Goldman Sachs – Investment Strategy Division

  • View: Cautiously optimistic.
  • Quote: “A bubble has not yet formed,” but investors should “diversify.”
  • Why it matters: Goldman acknowledges the risks while maintaining that fundamentals may still justify valuations—though they advise caution.
AI Bubble voices infographic October 2025

🧠 Julius Černiauskas and the Oxylabs AI/ML Advisory Board

🔍 View: The AI hype is nearing its peak—and may soon deflate.

  • Černiauskas warns that AI development is straining environmental resources and public trust. He’s pushing for responsible and sustainable AI practices, noting that transparency is lacking in how many models operate.
  • Ali Chaudhry, research fellow at UCL and founder of ResearchPal, adds that scaling laws are showing their limits. He predicts diminishing returns from simply making models bigger, and expects tightened regulations around generative AI in 2025.
  • Adi Andrei, cofounder of Technosophics, goes further: he believes the Gen AI bubble is on the verge of bursting, citing overinvestment and unmet expectations

🧠 Jamie Dimon on the AI Bubble

🔥 View: Sharply concerned—more than most as widely reported

  • Quote: “I’m far more worried than others about the prospects of a downturn.”
  • Context: Dimon believes AI stock valuations are “stretched” and compares the current surge to the dotcom bubble of the late 1990s.

📉 Key Warnings from Dimon

  • “Sharp correction” risk: He sees a real danger of a sudden market pullback, especially given how AI-related stocks have surged disproportionately—like AMD jumping 24% in a single day after an OpenAI deal.
  • “Most people involved won’t do well”: Dimon told the BBC that while AI will ultimately pay off—like cars and TVs did—many investors will lose money along the way.
  • “Governments are distracted”: He criticised policymakers for focusing on crypto and ignoring real security threats, saying: “We should be stockpiling bullets, guns and bombs”.
  • AI will disrupt jobs and companies”: At a trade event in Dublin, he warned that AI’s ubiquity will shake up industries and employment across the board.

And so…

The AI boom of 2025 has ignited a speculative frenzy across global markets, with tech stocks soaring and investors piling into anything labelled “AI-adjacent.”

But beneath the euphoria, a chorus of high-profile warnings is growing louder. From the Bank of England and IMF to JPMorgan’s Jamie Dimon and OpenAI’s Sam Altman, concerns are mounting that valuations are dangerously stretched, capital is overconcentrated, and the narrative is outpacing reality.

Dimon likens the moment to the dotcom bubble, while Altman admits many will “lose money” chasing the hype. Analysts point to classic bubble signals: retail mania, corporate FOMO, and earnings divorced from fundamentals.

Even as AI’s long-term utility remains promising, the short-term exuberance may be setting the stage for a sharp correction.

Whether it’s a pullback or a full-blown crash, the mood is shifting—from uncritical optimism to wary anticipation.

The question now is not whether AI will change the world, but whether markets have priced in too much, too soon.

We have been warned!

The AI bubble will pop – it’s just a matter of when and not if.

Go lock up your investments!

Gold rockets through $4,000 for the first time ever amid global uncertainty

Gold at highest level ever!

Gold has surged to an unprecedented high, crossing the $4,000 per ounce mark for the first time on 7th October 2025.

The precious metal peaked at $4,014.60, driven by a potent mix of geopolitical instability, expectations of U.S. interest rate cuts, and sustained central bank buying. This marks a 52% rise since January 2025, making it the strongest annual rally since 1979.

It continued its ascent into the 8th October 2025 touching $4,045 in early trade, likely with more to come. That’s over £3,000 per troy ounce.

The rally reflects a flight to safety as investors seek refuge from volatile bond markets, a weakening dollar, and the ongoing U.S. government shutdown.

One-year gold price chart – looking at December 2025 futures

With key economic data delayed and the Federal Reserve expected to cut rates twice before year-end, gold’s appeal as a non-yielding asset has intensified.

Physical demand remains robust, particularly in India, where festive buying and a weaker Rupee have pushed domestic prices to ₹1,30,300 per 10 grams in Delhi.

Meanwhile, institutional investors and sovereign funds continue to accumulate gold, signalling long-term strategic shifts away from traditional reserve currencies.

While technical indicators suggest the market may be overbought in the short term, analysts expect any correction to be modest.

For now, gold’s glittering ascent underscores a broader loss of confidence in conventional assets—and a renewed faith in timeless value.

Nikkei surges past 48,000 as Japan embraces political shift

Nikkei index surges to record high!

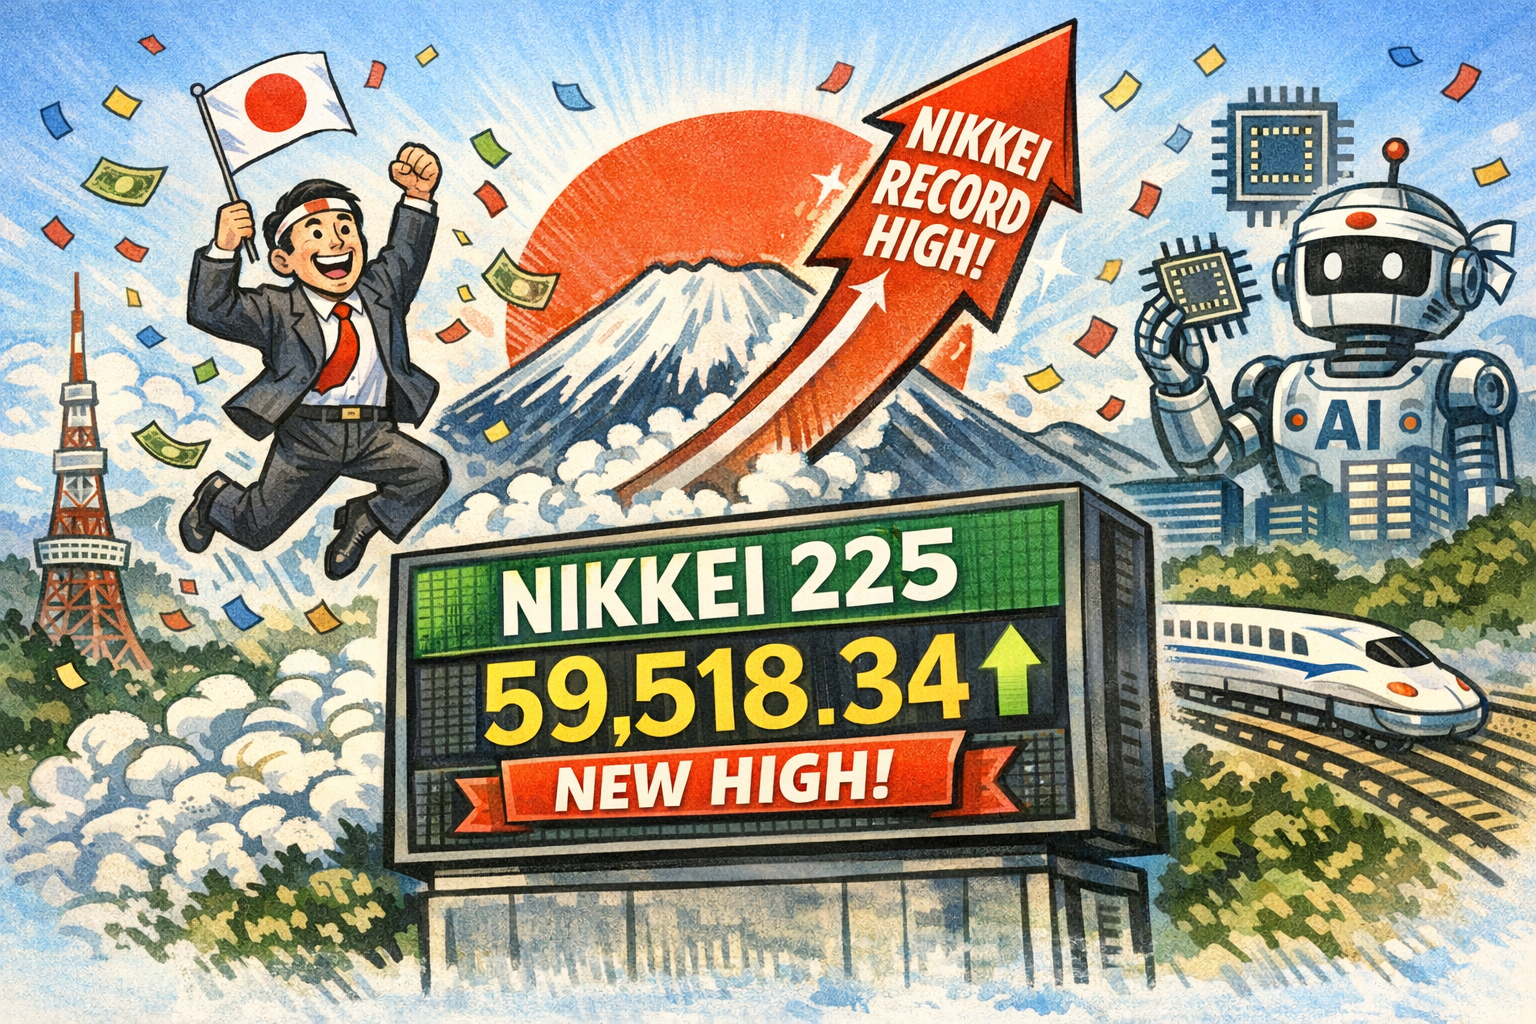
Japan’s benchmark Nikkei 225 index soared past the symbolic 48,000 mark on Monday 6th October 2025 in intraday trading, marking a new all-time high and underscoring investor confidence in the country’s shifting political landscape.

The index closed at 47944.76, up approximately 4.15% from Friday’s session, driven by a wave of optimism surrounding the Liberal Democratic Party’s leadership transition.

Nikkei 225 smashes to new record high October 6th 2025

Sanae Takaichi, a staunch conservative with deep ties to former Prime Minister Shinzo Abe, has emerged as the frontrunner to lead the party—and potentially become Japan’s first female prime minister.

Her pro-growth stance, admiration for Margaret Thatcher, and commitment to industrial revitalisation have sparked hopes of continued economic liberalisation.

The yen weakened boosting export-heavy sectors such as automotive and electronics. Toyota and Sony led the charge, with gains of 5.1% and 4.8% respectively.

Analysts also pointed to easing U.S. bond yields and a rebound on Wall Street as contributing factors.

While the rally reflects renewed market enthusiasm, it also raises questions about Japan’s long-term structural challenges—from demographic decline to mounting public debt.

For now, however, the Nikkei’s ascent offers a potent symbol of investor faith in Japan’s evolving political and economic narrative.

Is the resilient stock market keeping the U.S. economy out of a recession and if so – is that a bad thing?

U.S. recession looming?

The Resilient Stock Market: A Double-Edged Shield Against Recession

In a year marked by political volatility, Trumps tariff war, soft labour data, and persistent inflation anxieties, one pillar of the economy has stood tall: the stock market.

Defying expectations, major indices like the Nasdaq, Dow Jones and S&P 500 have surged, buoyed by AI-driven optimism and industrial strength. This resilience has helped stave off a technical recession—but not without raising deeper concerns about economic fragility and inequality.

At the heart of this phenomenon lies the ‘wealth effect’. As equity portfolios swell, high-net-worth households feel richer and spend more freely.

This consumer activity props up GDP figures and masks underlying weaknesses in wage growth, job creation, and productivity.

August’s economic data showed surprising strength in consumer spending and housing, despite lacklustre employment figures and fading stimulus support.

But here’s the rub: this buoyancy is not broadly shared. According to the University of Michigan’s sentiment index, confidence has declined sharply since January, especially among those without significant stock holdings.

Balance

The U.S. economy, in effect, is being held aloft by a narrow slice of the population—those with the means to benefit from rising asset prices. For everyone else, the recovery feels distant, even illusory.

This divergence creates a dangerous illusion of stability. Policymakers may hesitate to intervene—whether through fiscal support or monetary easing—because headline indicators look healthy. Yet beneath the surface, vulnerabilities abound.

If the market were to correct sharply, the spending it fuels could evaporate overnight, exposing the economy’s dependence on asset inflation.

Moreover, the market’s resilience may be distorting capital allocation. Companies flush with investor cash are prioritising stock buybacks and speculative ventures over wage growth or long-term investment. This can exacerbate inequality and erode the foundations of sustainable growth.

In short, while the stock market’s strength has delayed a recession, it has also deepened the disconnect between Wall Street and Main Street.

The danger lies not in the market’s success, but in mistaking it for economic health. A resilient market may be a shield—but it’s not a cure. And if that shield cracks, the consequences could be swift and severe.

The challenge now is to look beyond the indices and ask harder questions: Who is benefitting? What are we neglecting?

And how do we build an economy that’s resilient not just in numbers, but in substance, regardless of nation.

Wall Street’s euphoric surge sparks warnings of imminent pullback

Wall Street market warning!

Despite a backdrop of economic uncertainty and a partial government shutdown, Wall Street’s three major indices—the S&P 500, Nasdaq Composite, and Dow Jones Industrial Average—closed at record highs on Thursday 2nd October 2025, fuelling concerns that investor confidence may be tipping into excess.

The S&P 500 edged up 0.06%, continuing its relentless climb, while the Nasdaq and Dow Jones followed suit, buoyed by gains in tech giants like Nvidia and Intel.

Nvidia, now the world’s most valuable company, hit an all-time high, and Intel surged over 50% in the past month thanks to strategic partnerships.

Yet beneath the surface of this bullish momentum, market analysts are sounding the alarm. Sector rotation data from the S&P 500 reveals a concentration of capital in high-growth tech and consumer discretionary stocks, suggesting a narrowing rally.

This kind of sector skew often precedes a correction, as it reflects overconfidence in a few outperformers while broader market fundamentals remain shaky.

Triple High, Thin Ice: Wall Street’s record rally masks sector fragility and looming potential pullback

Adding to the unease is the state of the U.S. labour market. Hiring is down 58% year-to-date compared to 2024, marking the lowest level since 2009.

Although the jobless rate remains stable at 4.34%, the Chicago Fed’s indicators reportedly paint a picture of an economy that’s ‘low fire, low hire’—a phrase echoed by Federal Reserve Chair Jerome Powell.

Treasury Secretary Scott Bessent warned that the ongoing government shutdown could dent economic growth, but investors appear unfazed.

Some analysts argue that this detachment from macroeconomic risks reflects a dangerous complacency. Fundstrat even reportedly projected the S&P 500 could reach 7,000 by year-end—a bold forecast that, while technically possible, may hinge more on sentiment than substance.

The Nasdaq’s surge has been particularly pronounced, driven by speculative enthusiasm around AI and semiconductor stocks.

Meanwhile, the Dow Jones, traditionally seen as a bellwether for industrial strength, has benefited from defensive plays and dividend-rich stocks, masking underlying fragilities.

In sum, while Thursday’s triple record close is a milestone worth noting, it may also be a warning sign. With sector gauges flashing ‘excessive’ confidence and economic indicators sending mixed signals, investors would do well to temper their optimism.

A pullback may not be imminent, but it’s certainly plausible—and perhaps overdue.

As the bull charges ahead, the question remains: how long can it run before the bear catches up?

Bleak news from U.S. doesn’t seem that bad for stocks – what’s going on?

Bleak Headlines vs. Market Optimism

It’s one of those classic Wall Street paradoxes—where bad news somehow fuels bullish momentum. What’s going on?

News round-up

S&P 500 closes above 6,700 after rising 0.34%. Samsung and SK Hynix join OpenAI’s Stargate. Taiwan rejects U.S. proposal to split chip production. Trump-linked crypto firm plans expansion. Some stocks that doubled in the third quarter.

Bleak Headlines vs. Market Optimism

U.S. Government Shutdown: The federal government ground to a halt, but markets didn’t flinch. In fact, the S&P 500 rose 0.34% and closed above 6,700 for the first time.

ADP Jobs Miss: Private payrolls fell by 32,000 in September 2025, a sharp miss – at least compared to the expected 45,000 gain. Yet traders shrugged it off as other bad news is shrugged off too!

Fed Rate Cut Hopes: Weak data often fuels expectations that the Federal Reserve will cut interest rates. Traders are now betting on a possible cut in October 2025, which tends to boost equities.

Historical Pattern: According to Bank of America, the S&P 500 typically rises ~1% in the week before and after a government shutdown. So, this isn’t unprecedented—it’s almost ritualistic at this point.

Why the Market’s Mood Diverges

Animal Spirits: Investors often trade on sentiment and positioning, not just fundamentals. If they believe the Fed will ease policy, they’ll buy risk assets—even in the face of grim news.

Data Gaps: With the Bureau of Labor Statistics’ official jobs report delayed due to the shutdown, the ADP report gains more weight. But it’s historically less reliable, so traders may discount it.

Tech Tailwinds: AI stocks and semiconductor news (e.g., Samsung and SK Hynix joining OpenAI’s Stargate) are buoying sentiment, especially in Asia-Pacific markets.

U.S. Government Shutdown October 2025

Prediction

Traders in prediction markets are betting the shutdown will last around two weeks. Nothing too radical, since that’s the average length it takes for the government to reopen, based on data going back to 1990.

The government stoppage isn’t putting the brakes on the stock market momentum. Are investors getting too adventurous?

History shows the pattern is not new. The S&P 500 has risen an average of 1% the week before and after a shutdown, according to data from BofA.

Even the ADP jobs report, which missed expectations by a wide margin, did little to subdue the animal spirits.

Private payrolls declined by 32,000 in September 2025, according to ADP, compared with a 45,000 increase reportedly estimated by a survey of economists.

Payroll data

The Bureau of Labor Statistics’ (BLS) official nonfarm payrolls report is now stuck in bureaucratic purgatory and likely not being released on time.

The U.S. Federal Reserve might place additional weight on the ADP report — though it’s not always moved in sync with the BLS numbers. Traders expect weak data would prompt the Fed to cut interest rates in October 2025.

It’s a bit like watching a storm roll in while the crowd cheers for sunshine—markets are forward-looking, and sometimes they see silver linings where others see clouds.

Summary

EventDetail
🏛️ Government ShutdownBegan Oct 1, 2025. Traders expect ~2 weeks based on historical average
📉 ADP Jobs ReportPrivate payrolls fell by 32,000 vs. expected +45,000
📈 S&P 500 CloseRose 0.34% to close above 6,700 for the first time
💸 Fed Rate Cut ExpectationsTraders now pricing in a possible October cut

U.S. Government Shutdown: A Familiar Crisis Returns

U.S. Shutdown!

The United States government has once again entered a shutdown, marking the first lapse in federal funding in nearly seven years.

As of 12:01 a.m. Eastern Time on Wednesday 1st October 2025, Congress failed to pass a spending bill, triggering the closure of non-essential government services and furloughing hundreds of thousands of federal workers.

This latest impasse stems from a partisan standoff over healthcare subsidies and broader budget priorities.

Senate Democrats demanded the extension of Affordable Care Act tax credits, while Republicans insisted on passing a ‘clean’ funding bill without concessions. With neither side willing to compromise, the shutdown became inevitable.

The last government shutdown occurred from 22nd December 2018 to 25th January 2019, during President Trump’s first term.

That 35-day closure—the longest in U.S. history—was driven by a dispute over funding for a U.S.-Mexico border wall. It cost the economy an estimated $3 billion in lost GDP and left federal workers unpaid for weeks.

Shutdowns in the U.S. are not uncommon, but their frequency and duration have increased in recent decades. They typically occur when Congress fails to agree on annual appropriations bills before the start of the fiscal year on 1st October 2025.
While essential services like defence and air traffic control continue, most civilian agencies grind to a halt, delaying everything from passport processing to scientific research.

This latest shutdown is expected to have wide-reaching effects, including disruptions to veterans’ services, nutrition programmes, and disaster relief funding.

Both parties are under pressure to resolve the deadlock swiftly, but with political tensions running high, a quick resolution remains uncertain.

As the shutdown unfolds, the American public is left to navigate the consequences of a deeply divided government—one that seems increasingly unable to fulfil its most basic function: keeping the lights on.

Buffett Indicator surges past 200% – raising alarm bells on market valuation

Warren Buffett

The so-called ‘Buffett Indicator’—a stock market valuation metric championed by Warren Buffett—has surged past 200%, reigniting concerns that equities may be dangerously overvalued.

The ratio, which compares the total market capitalisation of U.S. stocks to the country’s gross domestic product (GDP), now sits well above the threshold Buffett once described as “playing with fire”.

Historically, the Buffett Indicator has served as a broad gauge of whether the market is trading at a premium or discount to the underlying economy.

100%

A reading of 100% suggests that the market is fairly valued. But when the ratio climbs significantly above that level, it implies that investor optimism may be outpacing economic fundamentals.

200%

At over 200%, the current reading suggests that the market is valued at more than twice the size of the U.S. economy. This level is not only unprecedented—it’s also well above the peak seen during the dot-com bubble, which ended in a dramatic crash in the early 2000s.

Buffett himself has warned in the past that when the indicator reaches extreme levels, it should serve as a ‘very strong warning signal’. While he has not commented on the current spike, the metric’s ascent has prompted renewed scrutiny from analysts and investors alike.

Some argue that the indicator may be distorted by structural changes in the economy, such as the rise of intangible assets and global revenue streams that aren’t captured by GDP alone.

Others point to low interest rates and persistent liquidity as reasons why valuations have remained elevated.

Do not ignore the warning

Still, the psychological impact of the 200% mark is hard to ignore. It suggests that investors may be pricing in perfection—expecting strong earnings growth, low inflation, and continued central bank support. Any deviation from this ideal scenario could trigger a sharp revaluation.

For long-term investors, the Buffett Indicator’s warning may not signal an immediate crash, but it does suggest caution. Diversification, disciplined risk management, and a clear understanding of valuation metrics are more important than ever.

As markets continue to defy gravity, the Buffett Indicator stands as a quiet sentinel—reminding investors that even the most exuberant rallies are tethered to economic reality. Whether this is a moment of irrational exuberance or a new normal remains to be seen.

But as Buffett once said, ‘The stock market is a device for transferring money from the impatient to the patient’.

It’s just a matter of ‘time’

🔍 How It Works

Formula:

Buffett Indicator=Total MarketCap/GDP

Interpretation:

Below 100%: Market may be undervalued

100%–135%: Fairly valued

Above 135%: Overvalued

Above 200%: Historically considered ‘playing with fire’, according to Buffett himself

🚨 Current Status (as of late September 2025)

The Buffett Indicator has surged to 218%, breaking records set during the Dotcom bubble and the COVID-era rally.

This extreme level suggests that equity values are growing much faster than the economy, raising concerns about a potential market bubble.

The surge is largely driven by mega-cap tech firms investing heavily in AI, which has inflated valuations.

🧠 Why It Matters

Buffett once called this “probably the best single measure of where valuations stand at any given moment.”

While some argue the metric may be outdated due to shifts in the economy (e.g., rise of intangible assets like software and data), it still serves as a powerful warning signal when valuations soar far above GDP.

Trump’s Drug Tariffs: A protectionist prescription policy?

Trump's Pharma Tariffs

Trump’s latest tariff salvo is already rattling pharma stocks. Branded drugs now face a 100% levy unless firms build plants in the U.S.

Trump’s Drug Tariffs: A protectionist prescription policy?

In a move that’s rattled pharmaceutical markets across Asia and Europe, President Trump has announced a sweeping 100% tariff on branded, patented drugs imported into the United States—unless manufacturers relocate production to American soil.

The policy, unveiled via executive order, is part of a broader push to ‘restore pharmaceutical sovereignty’ and reduce reliance on foreign supply chains.

The impact was immediate. Asian pharma stocks tumbled, with major exporters in India, South Korea, and Japan facing sharp declines. It is uncertain how this will affect the UK.
European firms, already grappling with regulatory headwinds, now face a stark choice: invest in U.S. manufacturing or risk losing access to one of the world’s most lucrative drug markets.

Critics argue the move is less about health security and more about economic nationalism. “This isn’t about safety—it’s about leverage,” said one analyst. “Trump’s team is using tariffs as a blunt instrument to force industrial relocation.”

Supporters, however, hail the policy as long overdue. With drug shortages and supply chain fragility exposed during the pandemic, the White House insists the tariffs will incentivise domestic resilience and job creation.

Yet the devil lies in the dosage. Smaller biotech firms may struggle to absorb the costs of relocation, potentially stifling innovation. And with branded drugs often tied to complex global patents and licensing agreements, the legal fallout could be significant.

The symbolism is potent: medicine, once a universal good, is now a battleground for economic identity. Trump’s tariff salvo reframes pharmaceuticals not as tools of healing, but as tokens of sovereignty. Whether this prescription cures or corrupts remains to be seen.

U.S. President Donald Trump has also stated that said plans to impose a 25% tariff on imported heavy trucks from 1st October 2025.

Stock market pullback in 4th quarter… how likely is it?

Taking Stock

While many investors are hoping for a year-end rally, several analysts are warning that a fourth-quarter pullback remains a real possibility.

Valuation concerns: Large-cap stocks are trading at historically high valuations, reminiscent of the 2021 peak. That leaves little room for error if economic data disappoints.

Tariff aftershocks: April’s ‘Liberation Day’ tariffs triggered a sharp sell-off, and although markets rebounded, strategists at Stifel expect an ‘echo’ effect—potentially a 14% drop in the S&P 500 before year-end.

Economic slowdown: Consumer spending is showing signs of strain, and real wage growth may not keep pace with rising prices. That could dampen demand and corporate earnings.

Trade uncertainty: The 90-day tariff pause expired in July 2025 (with adjustments), leaving markets to navigate the fallout—valuation echoes, trade uncertainty, and investor psychology now collide in Q4’s shadow. This could lead to headline-driven volatility through Q4.

Mixed sentiment: Some strategists remain cautiously optimistic, citing resilient labour data and hopes for more Fed rate cuts. But others warn that investors may be wishful thinking!

A U.S. stock market pullback is likely due in Q4 2025

The fourth quarter (Q4) of the calendar year runs from 1st October to 31st December. In financial and editorial contexts, it often carries symbolic weight—year-end reckonings, holiday spending, and final earnings reports all converge here.

A pullback is due, but when?

Fed flags elevated stock valuations amid market euphoria

Fed suggest stock market overvalued

In a candid assessment that sent ripples through global markets, Federal Reserve Chair Jerome Powell has acknowledged that U.S. stock prices appear ‘fairly highly valued’ by several measures.

Speaking at a recent event in Providence, Rhode Island, Powell reportedly responded to questions about the Fed’s tolerance for elevated asset prices, noting that financial conditions—including equity valuations—are closely monitored to ensure they align with the central bank’s policy goals.

The remarks come at a time when major indices such as the S&P 500 and Nasdaq have been flirting with record highs, fuelled by investor enthusiasm around artificial intelligence and expectations of continued monetary easing.

Powell’s comments, however, injected a dose of caution, suggesting that the Fed is wary of froth building in the markets.

While Powell stopped short of calling current valuations unsustainable, his phrasing echoed past warnings from central bankers about speculative excess. ‘Markets listen to us and make estimations about where they think rates are going’, he reportedly said, adding that the Fed’s policies are designed to influence broader financial conditions—not just interest rates.

The timing of Powell’s remarks is notable. The Fed recently (September 2025) cut its benchmark rate by 0.25 percentage points, a move that had bolstered investor sentiment.

Yet Powell also highlighted the ‘two-sided risks’ facing the economy: inflation remains sticky, while the labour market shows signs of softening. This balancing act, he implied, leaves little room for complacency.

Markets reacted swiftly. Tech stocks, which have led the recent rally, saw sharp declines, with Nvidia and Amazon among the hardest hit.

Powell’s warning may not signal an imminent correction, but it does suggest the Fed is keeping a watchful eye on valuations—and won’t hesitate to act if financial stability is threatened

AI power – the energy hunger game!

Powering AI will not be clean...?

As artificial intelligence surges into every corner of modern life—from predictive finance to generative art—the question isn’t just what AI can do, but what it consumes to do it.

The energy appetite of large-scale AI models is no longer a footnote; it’s the headline.

Training a single frontier model can devour as much electricity as hundreds of UK homes use in a year. And once deployed, these systems don’t slim down—they scale up.

Every query, every image generation, every chatbot exchange draws from vast data centres, many powered by fossil fuels or water-intensive cooling systems.

The irony? AI is often pitched as a tool for climate modelling, yet its own carbon footprint is ballooning.

This isn’t just a technical dilemma—it’s a moral one. The race to build smarter, faster, more responsive AI has become a kind of energy arms race. Tech giants tout efficiency gains, but the underlying logic remains extractive: more data, more compute, more power.

Meanwhile, communities near data centres face water shortages, grid strain, and rising costs—all for services they may never use.

Future direction

Where is this heading? On one side, we’ll see ‘greenwashed’ AI—models marketed as sustainable thanks to token offsets or renewable pledges. On the other, a growing movement for ‘degrowth AI’: systems designed to be lean, local, and ethically constrained. Think smaller models trained on curated datasets, prioritising transparency over scale.

AI power – the energy hunger game! NASA’s ambition is to place nuclear power on the moon

Governments are waking up, too. The EU and UK are exploring energy disclosure mandates for AI firms, while some U.S. states are scrutinising water usage and land rights around data infrastructure. But regulation lags behind innovation—and behind marketing.

Ultimately, the energy hunger game isn’t just about watts and emissions. It’s about values. Do we want AI that mirrors our extractive habits, or one that challenges them? Can intelligence be decoupled from excess?

The next frontier isn’t smarter models—it’s wiser ones. And wisdom, unlike raw compute, doesn’t need a megawatt to shine.

Why Nuclear Is Back on the Table

  • Global Momentum: Thirty-one countries have pledged to triple nuclear capacity by 2050, framing it as a cornerstone of clean energy strategy.
  • AI’s Power Problem: With data centres projected to consume more energy than Japan by 2026, nuclear is being pitched as the only scalable, low-carbon solution that can deliver round-the-clock power.
  • Baseload Reliability: Unlike solar and wind, nuclear doesn’t flinch at nightfall or cloudy skies. That makes it ideal for powering critical infrastructure—especially AI, which can’t afford downtime.

🧪 Next-Gen Tech on the Horizon

  • Small Modular Reactors (SMRs): These compact units promise faster deployment, lower costs, and safer operation. China and Russia already have some online.
  • Fusion Dreams: Still experimental, but if cracked, fusion could offer near-limitless clean energy. It’s the holy grail—though still more sci-fi than supply chain.

⚖️ The Catch? Cost, Waste, and Public Trust

  • Nuclear remains expensive to build and politically fraught. Waste disposal and safety concerns haven’t vanished, and public opinion is split—especially in the UK.
  • Even with advanced designs, the spectres of Chernobyl and Fukushima linger in the cultural memory. That’s a narrative hurdle as much as a technical one.

🛰️ Moonshots and Geopolitics

  • NASA’s push to deploy a nuclear reactor on the moon by 2029 underscores how strategic this tech has become—not just for Earth, but for space dominance.
  • The U.S.–China race isn’t just about chips anymore. It’s about who controls the energy to power them.

Nuclear is staging a comeback—not as a relic of the past, but as a potential backbone of the future.

Whether it becomes the dominant force or a transitional ally depends on how fast we can build, how safely we can operate, and how wisely we choose to deploy.

🌍 How ‘clean’ is green?

According to MIT’s Climate Portal, no energy source is perfectly clean. Even solar panels, wind turbines, and nuclear plants come with embedded emissions—from mining rare metals to manufacturing components and transporting them.

So, while they don’t emit greenhouse gases during operation, their setup and maintenance do leave a footprint.

How CLEAN is GREEN? Explainers | MIT Climate Portal

⚖️ Lifecycle Emissions Comparison

Here’s how different sources stack up in terms of CO₂ emissions per kilowatt hour:

Energy SourceCO₂ Emissions (g/kWh)Notes
Coal~1,000Highest emissions, plus toxic byproducts
Natural Gas~500Cleaner than coal, but still fossil-based
Solar<50Mostly from manufacturing panels
Wind~10Lowest emissions, mostly from materials
Nuclear (SMR/SNR)~12–20Low emissions, but waste and safety debates linger

Source: MIT Climate Portal

What is the deal with the new Huawei AI power chip cluster touted by China?

AI race hots up!

Huawei has unveiled a bold new AI chip cluster strategy aimed squarely at challenging Nvidia’s dominance in high-performance computing.

At its Connect 2025 conference in Shanghai, Huawei introduced the Atlas 950 and Atlas 960 SuperPoDs—massive AI infrastructure systems built around its in-house Ascend chips.

These clusters represent China’s most ambitious attempt yet to bypass Western semiconductor restrictions and assert technological independence.

The technical stuff

The Atlas 950 SuperPoD, launching in late 2026, will integrate 8,192 Ascend 950DT chips, delivering up to 8 EFLOPS of FP8 compute and 16 EFLOPS at FP4 precision. (Don’t ask me either – but that’s what the data sheet says).

It boasts a staggering 16.3 petabytes per second of interconnect bandwidth, enabled by Huawei’s proprietary UnifiedBus 2.0 optical protocol. It is reportedly claimed to be ten times faster than current internet backbone infrastructure.

This system is reportedly designed to outperform Nvidia’s NVL144 cluster, with Huawei asserting a 6.7× advantage in compute power and 15× in memory capacity.

In 2027, Huawei reportedly plans to release the Atlas 960 SuperPoD, doubling the specs with 15,488 Ascend 960 chips. This reportedly will give 30 EFLOPS FP8 compute, and 34 PB/s bandwidth.

These SuperPoDs will be linked into SuperClusters. The Atlas 960 SuperCluster is reportedly projected to reach 2 ZFLOPS of FP8 performance. This potentially rivals even Elon Musk’s xAI Colossus and Nvidia’s future NVL576 deployments.

Huawei’s roadmap includes annual chip upgrades: Ascend 950 in 2026, Ascend 960 in 2027, and Ascend 970 in 2028.

Each generation promises to double computing power. The chips will feature Huawei’s own high-bandwidth memory variants—HiBL 1.0 and HiZQ 2. These are designed to optimise inference and training workloads.

Strategy

This strategy reflects a shift in China’s AI hardware approach. Rather than competing on single-chip performance, Huawei is betting on scale and system integration.

By controlling the entire stack—from chip design to memory, networking, and interconnects—it aims to overcome fabrication constraints imposed by U.S. sanctions.

While Huawei’s software ecosystem still trails Nvidia’s CUDA, its CANN toolkit is gaining traction. Chinese regulators discourage purchases of Nvidia’s AI chips.

The timing of Huawei’s announcement coincides with increased scrutiny of Nvidia in China, suggesting a coordinated push for domestic alternatives.

In short, Huawei’s AI cluster strategy is not just a technical feat—it’s a geopolitical statement.

Whether it can match Nvidia’s real-world performance remains to be seen, but the ambition is unmistakable.

The AI power race just got even hotter!

Fed cuts rates amid labour market strains and political Powell pressure

U.S. cuts rates

On 17th September 2025, the U.S. Federal Reserve announced its first interest rate cut of 2025, lowering the benchmark federal funds rate by 0.25% to a range of 4.00%–4.25%.

The decision follows nine months of monetary policy stagnation and comes amid mounting evidence of a weakening labour market and persistent inflationary pressures.

Fed Chair Jerome Powell described the move as a ‘risk management cut’, citing slower job growth and a rise in unemployment as key drivers.

While inflation remains elevated—partly due to tariffs introduced by the Trump administration—the Fed opted to prioritise employment support, signalling the possibility of two further cuts before year-end.

The decision was not without controversy. New Fed Governor Stephen Miran, recently appointed by President Trump, reportedly dissented, advocating for a more aggressive half-point reduction. Political tensions have escalated, with Trump publicly urging Powell to ‘cut bigger’.

Markets responded with mixed signals: the Dow rose modestly, while the S&P 500 and Nasdaq slipped slightly. However, each improved in after-hours trading.

Analysts remain divided over the long-term impact, with some warning that easing too quickly could reignite inflation.

The Fed’s next move will be closely watched as it balances economic fragility with political crosswinds.

The next U.S. Federal Reserve meeting is scheduled for 29th–30th October 2025, with the interest rate decision expected on Wednesday, 30th October at 2:00 PM ET.

China-U.S. trade slump deepens as exports plunge 33%

U.S. imports from China fall in August 2025

China’s exports to the United States fell sharply in August 2025, marking a six-month low and underscoring the growing strain in global trade dynamics.

According to recent data, shipments from China to the U.S. dropped by 33% year-on-year, reflecting both weakening demand and the ongoing effects of geopolitical tensions.

This decline is part of a broader slowdown in China’s export sector, which saw overall outbound shipments contract for the sixth consecutive month.

Analysts point to several contributing factors: tighter monetary policy in the U.S., shifting supply chains, and a cooling appetite for Chinese goods amid rising tariffs and trade barriers.

Down 33%

The 33% plunge is particularly striking given the scale of bilateral trade. The U.S. remains one of China’s largest export markets, and such a steep drop signals deeper economic recalibrations.

Sectors hit hardest include electronics, machinery, and consumer goods—industries that once formed the backbone of China’s export dominance.

Economists warn that this trend could have ripple effects across global markets. For China, it raises questions about domestic resilience and the need to pivot toward internal consumption.

For the U.S., it may accelerate efforts to diversify supply chains and invest in domestic manufacturing.

The timing is also politically charged. With President Trump’s tariff policies still in effect and China navigating its own economic headwinds, trade relations remain tense.

This downturn may prompt renewed negotiations—or further decoupling.

Despite the ongoing slump in trade, the U.S. continues to be China’s largest export destination among individual countries.

The staying power of gold!

Gold

Gold’s recent surge—hitting over $3,550 per ounce (4th September 2025)—isn’t just a speculative blip.

It’s a convergence of deep structural shifts and short-term catalysts that are reshaping how investors, central banks, and governments think about value and stability.

Here’s why

🧭 Strategic Drivers (Long-Term Forces)

Central Bank Buying: Nearly half of surveyed central banks reportedly plan to increase gold reserves through 2025, citing inflation hedging, crisis resilience, and reduced reliance on the U.S. dollar.

Dollar Diversification: After Western sanctions froze Russia’s reserves in 2022, many countries began reassessing their exposure to dollar-denominated assets.

Fiscal Expansion & Debt Concerns: With U.S. debt surpassing $37 trillion and new legislation adding trillions more, gold is seen as a hedge against long-term dollar instability.

⚡ Tactical Catalysts (Short-Term Triggers)

Geopolitical Tensions: Ongoing wars, trade disputes, and questions around Federal Reserve independence have heightened uncertainty, boosting gold’s ‘fear hedge’ appeal.

Interest Rate Expectations: The Fed has held rates steady, but markets anticipate cuts. Lower yields make non-interest-bearing assets like gold more attractive.

Weakening U.S. Dollar: The dollar’s decline against the euro and yen has made gold cheaper for foreign buyers, increasing global demand.

ETF Inflows & Retail Demand: Physically backed gold ETFs saw their largest first-half inflows since 2020, while bar demand rose 10% in 2024.

Gold futures price one-year chart (December 2025 Gold)

🧮 Symbolic Undercurrent

Gold isn’t just a commodity—it’s a referendum on trust. When institutions wobble and currencies lose their shine, gold becomes the narrative anchor: a timeless, tangible vote of no confidence in the system.

Summary

🛡️ Safe Haven: Retains value during crisis.

📈 Inflation Hedge: Preserves purchasing power.

🧩 Portfolio Diversifier: Low correlation with other assets.

Tangible Asset: Physical, unlike stocks or bonds.

China’s EV Price War: BYD falters as the Chinese EV machine reshapes the global car market

EV global price war

China’s electric vehicle (EV) powerhouse is rewriting the global automotive playbook—but not without homegrown company damage.

BYD, now the world’s largest EV manufacturer by volume, has been caught in the crossfire of a domestic price war.

Damaging price war

The price war is damaging margins. It is unnerving investors and revealing the perils of hyper-competition in the world’s most aggressive car market.

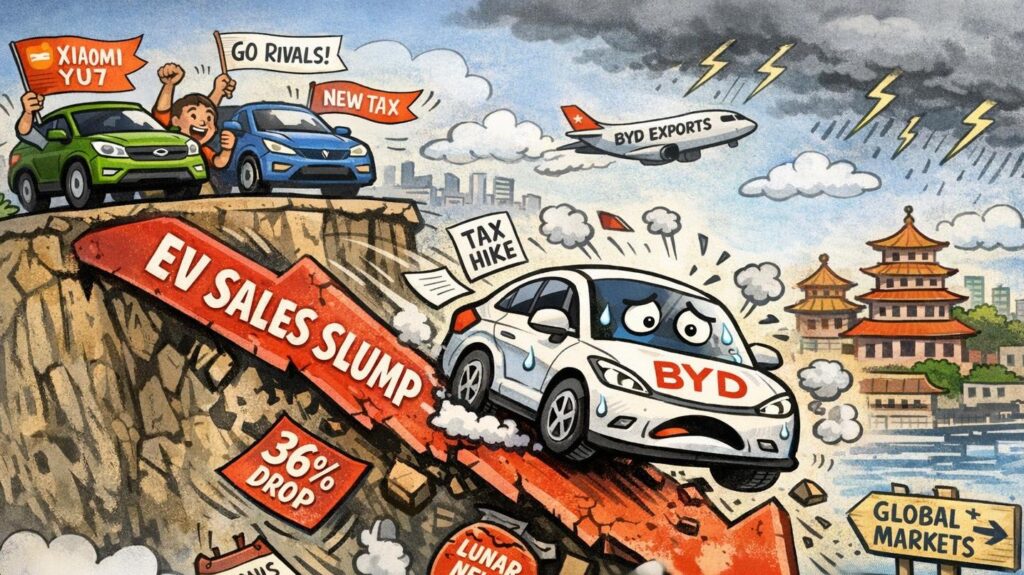
In Q2 2025, BYD posted a 30% drop in net profit to 6.4 billion yuan (£700 million), its first earnings decline in over three years.

Despite a 145% surge in overseas sales, the company’s sweeping discounts across 22 models have eroded profitability at home.

Gross margins slipped to around 16%, and its Hong Kong-listed shares tumbled 8% to a five-month low.

Analysts reportedly now question whether BYD can hit its ambitious 5.5-million-unit sales target, having reached only 45% by July 2025.

The price war, ignited by BYD’s aggressive cuts in May 2025, has forced rivals like Geely, Chery, and SAIC-GM to follow suit. Entry-level EVs now start below (£6,500), with features like driver assistance and smart infotainment once reserved for premium models.

But the race to the bottom has drawn concern from regulators and industry leaders. The China Association of Automobile Manufacturers (CAAM) warned of “disorderly competition”, while executives fear quality compromises and supplier strain.

Yet even as BYD stumbles, the broader Chinese EV machine is gaining global momentum. In Europe, BYD overtook Tesla in July sales, capturing 1.1% market share versus Tesla’s 0.7%.

Chinese EV car brands account for around 10% of new UK car sales

Chinese brands now account for around 10% of new car sales in the UK. There are over 30 affordable EV models priced under £30,000.

Their edge lies in battery supply chains, manufacturing efficiency, and software integration. Transforming cars into ‘smartphones on wheels’ tailored to digitally connected consumers.

China’s EV revolution is no longer just a domestic shake-up—it’s a global reordering. Legacy automakers are retreating from the budget segment. But Chinese firms flooding international markets with sleek, connected, and competitively priced vehicles.

BYD’s profit dip may be a temporary wobble. The long-term trajectory is clear: China isn’t just building cars—it’s building the future of mobility.

For global rivals, the message is unmistakable: adapt, or be outpaced by the dragon’s electric roar.

Infographic: China’s BYD and other EVs

Summary

BYD’s Q2 2025 net profit drop of 30% to 6.4 billion yuan: This figure aligns with recent earnings reports and analyst commentary. The drop is consistent with margin pressure from domestic price cuts.

Gross margin falling to 16.3%: Matches industry estimates for BYD’s automotive segment, which has seen compression due to aggressive discounting.

Overseas sales up 145% YoY: BYD’s international expansion—especially in Europe, Southeast Asia, and Latin America—has been rapid. This growth rate is plausible and supported by export data.

BYD reaching only 45% of its 5.5 million unit sales target by July: This tracks with cumulative delivery figures through mid-year, suggesting a potential shortfall unless H2 volumes accelerate.

Price war triggered by BYD’s cuts across 22 models in May: Confirmed by industry reports and BYD’s own promotional campaigns. Other automakers like Geely and Chery have responded with similar discounts.

CAAM warning of “disorderly competition”: This quote has appeared in official statements and media coverage, reflecting regulatory concern over unsustainable pricing.

Chinese EVs gaining market share in Europe and UK: BYD overtaking Tesla in July 2025 sales in Europe is supported by registration data. Chinese brands now account for ~10% of UK new car sales, with many models priced under £30,000.

U.S. inflation holds steady in July 2025 but Core Inflation edges higher

U.S. Inflation data

The latest inflation data for the month of July 2025 shows a mixed picture for the U.S. economy, as price pressures remain persistent despite signs of cooling in some sectors.

According to the Bureau of Economic Analysis, the headline Personal Consumption Expenditures (PCE) Price Index rose 2.6% year-over-year, unchanged from June, while the core PCE index—which excludes volatile food and energy costs—ticked up to 2.9%, marking its highest annual rate since February.

On a monthly basis, core prices increased 0.3%, in line with expectations, while consumer spending rose 0.5%, suggesting households are still resilient despite elevated costs. Personal income also climbed 0.4%, reinforcing the narrative of steady wage growth.

The Federal Reserve, which uses the PCE index as its preferred inflation gauge, faces a delicate balancing act.

With inflation still above its 2% target and labor market data showing signs of softening, markets are increasingly betting on a rate cut at the Fed’s September meeting.

Fed Chair Jerome Powell, speaking at Jackson Hole, reportedly acknowledged the risks to employment but maintained a cautious tone on policy shifts.

Investors and traders alike now see an 80% chance of a quarter-point cut, keeping all eyes on upcoming jobs data.

The Nixon shock: When politics undermined the Fed—and markets paid the price

Nixon Fed Interference shock

In the early 1970s, President Richard Nixon’s pursuit of re-election collided with the Federal Reserve’s independence, triggering a cascade of economic consequences that reshaped global finance.

The episode remains a cautionary tale about the dangers of politicising monetary policy.

At the heart of the drama was Nixon’s pressure on Fed Chair at the time, Arthur Burns to stimulate the economy ahead of the 1972 election. Oval Office tapes later revealed Nixon’s direct appeals for rate cuts and looser credit conditions—despite rising inflation.

Burns, reluctant but ultimately compliant, oversaw a period of aggressive monetary expansion. Interest rates were held artificially low, and the money supply surged.

Dow historical chart – lowest 43 points to around 45,400

The short-term result was a booming economy and a landslide victory for Nixon. But the longer-term consequences were severe. Inflation, already simmering, began to boil. By 1973, consumer prices were rising at an annual rate of over 6%, and the dollar was under siege in global markets.

Then came the real shock: in August 1971, Nixon unilaterally suspended the dollar’s convertibility into gold, effectively ending the Bretton Woods system.

This move—intended to halt speculative attacks and preserve U.S. gold reserves—unleashed a new era of floating exchange rates and fiat currency. The dollar depreciated sharply, and global markets entered a period of volatility.

By 1974, the consequences were fully visible. The Dow Jones Industrial Average had fallen nearly 45% from its 1973 peak.

Politics vs the Federal Reserve – lesson learned?

Bond yields soared as investors demanded compensation for inflation risk. The U.S. economy entered a deep recession, compounded by the oil embargo and geopolitical tensions.

The Nixon-Burns episode is now widely viewed as a breach of central bank independence. It demonstrated how short-term political gains can lead to long-term economic instability.

The Fed’s credibility was damaged, and it took nearly a decade—culminating in Paul Volcker’s brutal rate hikes of the early 1980s—to restore price stability.

Today, as debates over Fed autonomy resurface, the lessons of the 1970s remain urgent. Markets thrive on trust, transparency, and institutional integrity. When those are compromised, even the most powerful economies can falter.

THE NIXON SHOCK — Early 1970’s Timeline

🔶 August 1971 Event: Gold convertibility suspended Market Impact: Dollar begins to weaken Context: Nixon ends Bretton Woods, launching the fiat currency era

🔴 November 1972 Event: Nixon re-elected Market Impact: Stocks rally briefly (+6%) Context: Fed policy remains loose under political pressure

🔵 January 1973 Event: Dow peaks Market Impact: Start of sharp decline Context: Inflation accelerates, investor confidence erodes

🟢 1974 Event: Watergate fallout, Nixon resigns Market Impact: Dow down 44% from 1973 high Context: Recession deepens, Fed credibility damaged.

Current dollar dive, stocks boom and bust (the Dow fell 19% in a year and then by 44% in 1975 from its January 1973 peak). U.S. 10-year Treasury yields surged (peaking at nearly 7.60% -close to twice today’s yield).

In hindsight, Nixon won the election—but lost the economy. And the Fed, caught in the crossfire, paid the price in credibility. It’s a reminder that monetary policy is no place for political theatre.

Is history repeating itself? Is Trump’s involvement different, or another catastrophe waiting to happen?

News agent makes the news – WH Smith’s fresh start derails in a fog of accounting mistakes

W H Smith error

WH Smith’s attempt to reinvent itself as a sleek, travel-focused retailer has hit turbulence, with a £30 million profit overstatement in its North American division sending shares into a 42% nosedive.

The error, stemming from premature recognition of supplier income, has triggered a full audit review and left investors ‘sobbing into their cornflakes’, as one analyst reportedly put it. Not nice!

The timing couldn’t be worse. Having sold off its UK High Street arm earlier this year, WH Smith was banking on its overseas operations to deliver growth.

Instead, the company now expects just £25 million in North American trading profit—less than half its original forecast.

The reputational damage is compounded by the fact that supplier income, often tied to promotional deals, is notoriously tricky to account for.

WH Smith’s misstep suggests not just a lapse in judgement, but a systemic failure in financial controls.

Table of events

MetricDetails
📊 Profit Overstatement£30 million
🧾 Cause of ErrorPremature recognition of supplier income
🇺🇸 Affected DivisionNorth America
📉 Share Price Impact42% drop
📉 Revised Profit Forecast£25 million (down from £54 million)
🕵️‍♂️ Audit ResponseFull review initiated by Deloitte
🏪 Strategic ContextWH Smith sold UK High Street arm earlier in 2025
📦 Supplier Income RiskOften tied to promotional deals; hard to track

This isn’t merely a spreadsheet error—it’s a strategic setback. The retailer’s pivot to travel hubs was meant to offer high-margin stability, buoyed by a captive audience.

But the accounting blunder casts doubt on the robustness of its operational oversight, especially in a market as competitive as the U.S.

With Deloitte now combing through the books, W H Smith faces a long road to restore investor confidence.

For a brand that once prided itself on reliability, this episode is a reminder that even legacy names can falter when ambition outpaces accountability.

W H Smith share price (one-month chart) 21st August 2025

Let’s hope the next chapter isn’t written in red ink.

Japan faces steepest export decline in four years

Japan exports drop

Japan’s economy has hit a troubling patch, with July 2025 marking its sharpest export contraction in over four years.

The Ministry of Finance reported a 2.6% year-on-year drop, driven largely by tariff led trade tensions and weakening global demand.

The most dramatic impact came from the United States, where exports fell 10.1%, led by a 28.4% plunge in automobile shipments.

This follows the U.S. administration’s decision to impose 25% tariffs on Japanese vehicles and auto parts in April—a move that has rattled Japan’s automotive sector, long a pillar of its export economy.

Despite a partial tariff rollback to 15% in July, the damage was already done. Japanese carmakers absorbed much of the cost to maintain shipment volumes, which only fell 3.2%, but the value loss was substantial.

Japan – July export data infographic

Exports to China also declined by 3.5%, underscoring broader regional weakness. Meanwhile, imports dropped 7.5%, signalling sluggish domestic consumption and further strain on Japan’s trade balance, which recorded a 117.5 billion yen deficit.

Economists warn that if the export downturn continues, Japan could face a recession. Although Q2 GDP showed modest growth of 0.3%, the July figures suggest that momentum may be fading.

The Bank of Japan is now expected to hold off on interest rate hikes, with its next policy meeting scheduled for 19th September 2025.

As global markets digest the implications, Japan’s export slump serves as a stark reminder of how vulnerable even advanced economies can be to shifting trade policies and geopolitical headwinds.

Is BIG tech being allowed to pay its way out of the tariff turmoil

BIG tech money aids tariff avoidance

Where is the standard for the tariff line? Is this fair on the smaller businesses and the consumer? Money buys a solution without fixing the problem!

  • Nvidia and AMD have struck a deal with the U.S. government: they’ll pay 15% of their China chip sales revenues directly to Washington. This arrangement allows them to continue selling advanced chips to China despite looming export restrictions.
  • Apple, meanwhile, is going all-in on domestic investment. Tim Cook announced a $600 billion U.S. investment plan over four years, widely seen as a strategic move to dodge Trump’s proposed 100% tariffs on imported chips.

🧩 Strategic Motives

  • These deals are seen as tariff relief mechanisms, allowing companies to maintain access to key markets while appeasing the administration.
  • Analysts suggest Apple’s move could trigger a ‘domino effect’ across the tech sector, with other firms following suit to avoid punitive tariffs.
Tariff avoidance examples

⚖️ Legal & Investor Concerns

  • Some critics call the Nvidia/AMD deal a “shakedown” or even unconstitutional, likening it to a tax on exports.
  • Investors are wary of the arbitrary nature of these deals—questioning whether future administrations might play kingmaker with similar tactics.

Big Tech firms are striking strategic deals to sidestep escalating tariffs, with Apple pledging $600 billion in U.S. investments to avoid import duties, while Nvidia and AMD agree to pay 15% of their China chip revenues directly to Washington.

These moves are seen as calculated trade-offs—offering financial concessions or domestic reinvestment in exchange for continued market access. Critics argue such arrangements resemble export taxes or political bargaining, raising concerns about legality and precedent.

As tensions mount, these deals reflect a broader shift in how tech giants navigate geopolitical risk and regulatory pressure.

They buy a solution…

Global stocks indices flying high as new records broken – 12th August 2025

New records for global indices led by U.S. tech

In a sweeping rally that spanned continents and sectors, major global indices surged to fresh record highs yesterday, buoyed by cooling inflation data, renewed hopes of U.S. central bank rate cuts, and easing trade tensions.

U.S. inflation figures released 12th August 2025 for July came in at: 2.7% – helping to lift markets to new record highs!

U.S. Consumer Price Index — July 2025

MetricValue
Monthly CPI (seasonally adjusted)+0.2%
Annual CPI (headline)+2.7%
Core CPI (excl. food & energy)+0.3% monthly, +3.1% annual

Despite concerns over Trump’s sweeping tariffs, the U.S. July 2025 CPI came in slightly below expectations (forecast was 2.8% annual).

Economists noted that while tariffs are beginning to show up in certain categories, their broader inflationary impact remains modest — for now.

Global Indices Surged to Record Highs Amid Rate Cut Optimism and Tariff Relief

Tuesday, 12 August 2025 — Taking Stock

📈 S&P 500: Breaks Above 6,400 for First Time

  • Closing Level: 6,427.02
  • Gain: +1.1%
  • Catalyst: Softer-than-expected U.S. CPI data (+2.7% YoY) boosted bets on a September rate cut, with 94% of traders now expecting easing.
  • Sector Drivers: Large-cap tech stocks led the charge, with Microsoft, Meta, and Nvidia all contributing to the rally.

💻 Nasdaq Composite & Nasdaq 100: Tech Titans Lead the Way

  • Nasdaq Composite: Closed at a record 21,457.48 (+1.55%)
  • Nasdaq 100: Hit a new intraday high of 23,849.50, closing at 23,839.20 (+1.33%)
  • Highlights:
    • Apple surged 4.2% after announcing a $600 billion U.S. investment plan.
    • AI optimism continues to fuel gains across the Magnificent Seven stocks.

Nasdaq 100 chart 12th August 2025

Nasdaq 100 chart 12th August 2025

🧠 Tech 100 (US Tech Index): Momentum Builds

  • Latest High: 23,849.50
  • Weekly Gain: Nearly +3.7%
  • Outlook: Traders eye a breakout above 24,000, with institutional buying accelerating. Analysts note a 112% surge in net long positions since late June.

🇯🇵 Nikkei 225: Japan Joins the Record Club

  • Closing Level: 42,718.17 (+2.2%)
  • Intraday High: 43,309.62
  • Drivers:
    • Relief over U.S. tariff revisions and a 90-day pause on Chinese levies.
    • Strong earnings from chipmakers like Kioxia and Micron.
    • Speculation of expanded fiscal stimulus following Japan’s recent election results.

🧮 Market Sentiment Snapshot

IndexRecord Level Reached% Gain YesterdayKey Driver
S&P 5006,427.02+1.1%CPI data, rate cut bets
Nasdaq Comp.21,457.48+1.55%AI optimism, Apple surge
Nasdaq 10023,849.50+1.33%Tech earnings, institutional buying
Tech 10023,849.50+1.06%Momentum, bullish sentiment
Nikkei 22543,309.62+2.2%Tariff relief, chip rally

📊 Editorial Note: While the rally reflects strong investor confidence, analysts caution that several indices are approaching technical overbought levels.

The Nikkei’s RSI, for instance, has breached 75, often a precursor to short-term pullbacks.

Trump – tactics and turmoil – tariff U-turn count

Trump U-turns

Trump’s latest flurry of tariff U-turns has left global markets whiplashed but oddly resilient.

From threatening Swiss gold bars with a 39% levy to abruptly tweeting ‘Gold will not be Tariffed!’ The former president’s reversals have become a hallmark of his political tactic.

Investors now brace for volatility not from policy itself, but from its rapid retraction. With China tariffs delayed, praise for previously criticised CEOs, and shifting stances on Ukraine and Russia, Trump’s tactics seem less about strategy and more about spectacle.

Yet despite the chaos, markets appear unfazed—suggesting that unpredictability may now be priced in

🧠 Why So Many U-Turns?

  • Market Sensitivity: Many reversals follow stock market dips or investor backlash.
  • Diplomatic Pressure: Allies like Switzerland, India, Ukraine, Canada and Australia have pushed back hard.
  • Narrative Control: Trump often uses Truth Social to pivot public messaging rapidly.
  • Strategic Ambiguity: Some analysts argue it’s part of a negotiation tactic—others call it chaos.

🔁 Latest Trump U-Turns

TopicInitial PositionReversalDate
Gold TariffsSwiss gold bars to face 39% tariffTrump tweets “Gold will not be Tariffed!”7 Aug 2025
China Tariffs145% reciprocal tariffs to beginDelayed for 90 days12 Aug 2025
Intel CEO Lip-Bu Tan“Must resign, immediately”“His success and rise is an amazing story”11 Aug 2025
Russia-Ukraine ArmsPaused military aid to UkraineResumed shipments after backlash8 Jul 2025
India’s Role in Peace TalksCriticised India’s neutralityPraised India’s diplomatic efforts9 Aug 2025
Global TariffsImposed sweeping import taxesSuspended most tariffs within 13 hours9 Apr 2025
Epstein FilesPromised full declassificationNow downplaying and deflectingOngoing

TACO – Trump Always Chickens Out! Tactics or turmoil?

Technical Signals: Cracks beneath the surface – are U.S. stocks beginning to stumble?

Stock correction?

There are increasingly credible signs that U.S. stocks may be heading into a deeper adjustment phase.

Here’s a breakdown of the key indicators and risks that suggest the current stumble could be more than a seasonal wobble. It’s just a hypothesis, but…

  • S&P 500 clinging to its 200-day moving average: While the long-term trend remains intact, short-term averages (5-day and 20-day) have turned negative.
  • Volatility Index (VIX) rising: A 7.61% surge in the 20-day average VIX suggests growing unease, even as prices remain elevated.
  • Diverging ADX readings: The S&P 500’s ADX (trend strength) is weak at 7.57, while the VIX’s ADX is strong at 45.37—classic signs of instability brewing.

🧠 Sentiment & Positioning: Optimism with Defensive Undercurrents

  • Investor sentiment is bullish (40.3%), but rising put/call ratios and a complacent Fear & Greed Index hint at hidden caution.
  • Historical parallels: Similar sentiment setups preceded corrections in 2021 and 2009. We’re not at extremes yet, but the complacency is notable.

🌍 Macroeconomic Risks: Tariffs, Fed Policy, and Structural Headwinds

  • Tariff escalation: Trump’s recent executive order raised effective tariffs to 15–20%, with new duties on rare earths and tech-critical imports.
  • Labour market weakening: July’s jobs report showed just 73,000 new jobs, with massive downward revisions to prior months. Unemployment ticked up to 4.2%.
  • Fed indecision: The central bank is split, with no clear path on rate cuts. This uncertainty is amplifying volatility.
  • Structural drag: Reduced immigration and R&D funding are eroding long-term growth potential.
  • 🛡️ Strategic Implications: How Investors Are Hedging
  • Defensive sectors like utilities, healthcare, and gold are gaining traction.
  • VIX futures and Treasury bonds are being used to hedge against volatility.
  • Emerging markets with trade deals (e.g., Vietnam, Japan) may outperform amid global realignment.
  • 🗓️ Seasonal Weakness: August and September Historically Slump
  • August is the worst month for the Dow since 1988, and the second worst for the S&P 500 and Nasdaq.
  • Wolfe Research reportedly notes average declines of 0.3% (August) and 0.7% (September) since 1990.
  • Sahm Rule: Recession indicator.

Now what?

While the broader market still shows resilience—especially in mega-cap tech—the underlying signals point to fragility.

Elevated valuations, weakening macro data, and geopolitical uncertainty are converging. A deeper correction isn’t guaranteed, but the setup is increasingly asymmetric: limited upside, growing downside risk.