The Ed Miliband energy paradox: how Britain ended up paying France to take its power

UK energy paradox

If you are anything like me, you’re not wrong to feel that this is insane. On the face of it, Britain has:

  • Among the highest electricity prices in the developed world, especially for industry.
  • Growing periods of negative wholesale prices, where generators pay others to take power.

That combination is not just a glitch; it’s the product of how the UK has chosen to do net zero—through a tangle of subsidies, rigid contracts and a grid that was never upgraded to match the political ambition.

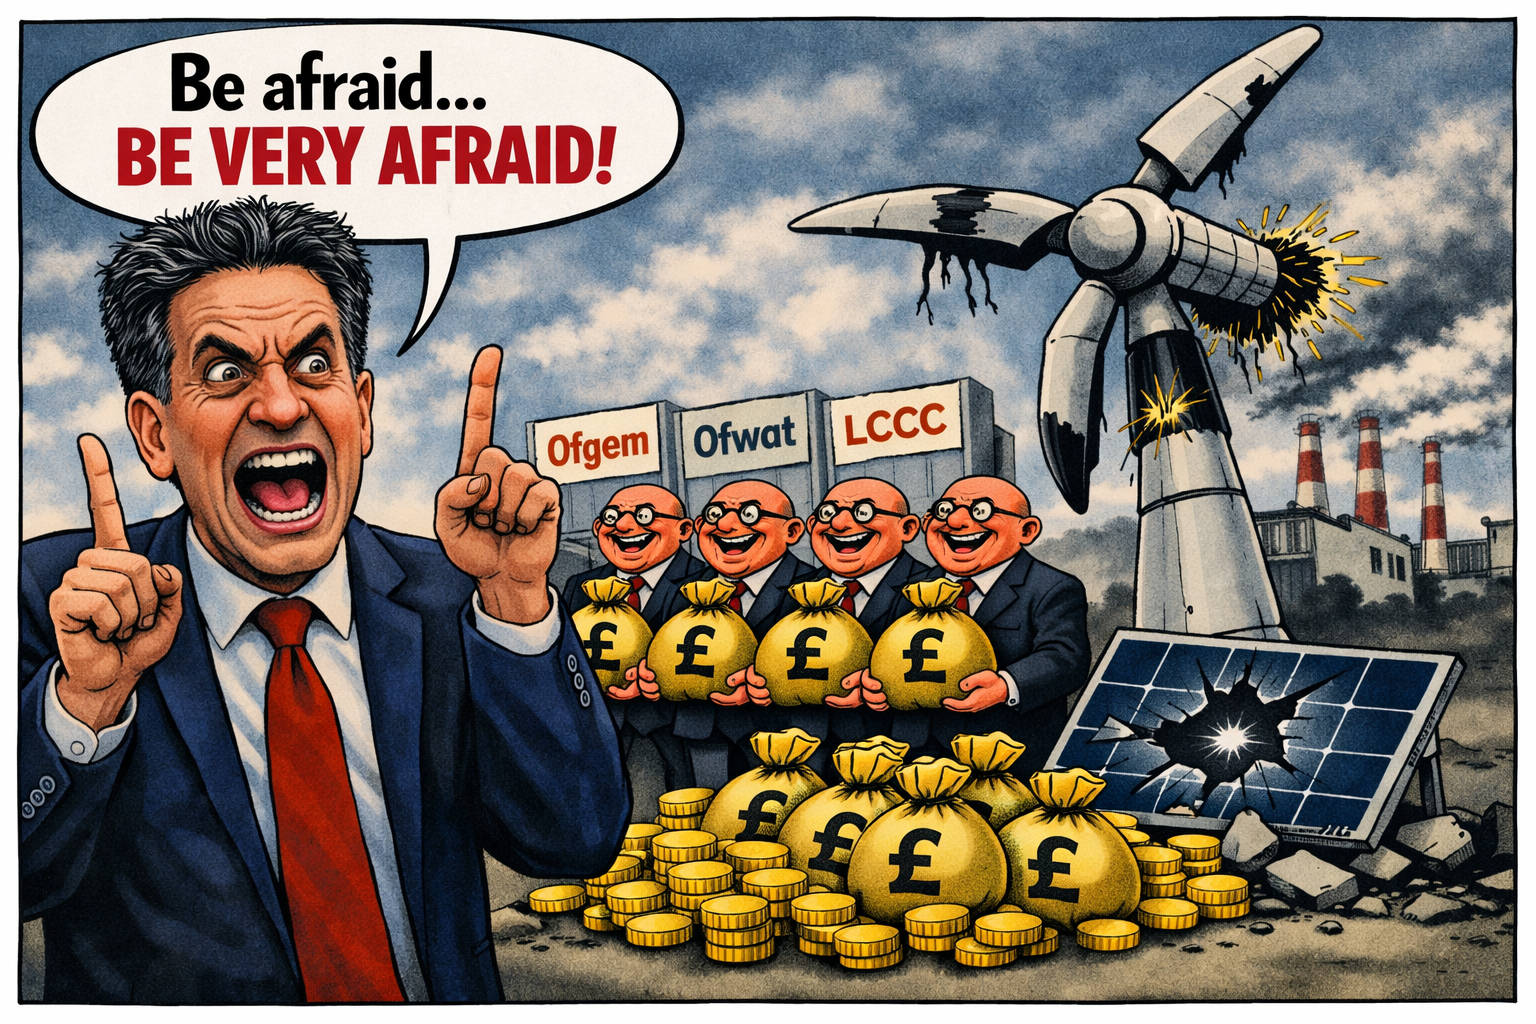
This is the Ed Miliband paradox: a “cheap renewables” story that somehow delivers some of the world’s most expensive power, and then occasionally becomes so oversupplied that we literally pay France and others to take it away.

What is actually happening when prices go negative?

Negative prices are not a metaphor. For several dozen hours already this year, the wholesale price of electricity in Britain has dropped below zero.

Generators effectively pay the system to keep running, and interconnectors export that surplus to countries like France, Holland and Belgium—sometimes with a “chunky payment” attached.

This happens when:

  • Supply massively exceeds demand—typically on windy, sunny, mild days when heating and cooling demand is low.
  • Certain generators cannot or will not switch off—because of technical constraints (nuclear, some gas) or because their subsidy contracts reward them for generating regardless of price.
  • The grid cannot move or store the surplus—limited storage, constrained transmission, and slow grid reinforcement mean power piles up in the wrong place at the wrong time.

In that moment, electricity stops being a valuable commodity and becomes a waste product that must be disposed of. Interconnectors to France and others are the “sewer pipe” for that surplus.

Why the UK is uniquely bad at this

Negative prices are not just a British phenomenon—Germany, Spain, the Netherlands and others have also seen record hours of sub‑zero prices as renewables surge. But the UK has managed to combine:

  • High average prices, especially for industry;
  • Frequent negative prices at the margin;
  • Huge policy costs loaded onto bills rather than general taxation.

That cocktail is the result of several design choices.

1. Subsidy structures that pay to generate, not to be useful

A big chunk of UK renewables is supported by:

In a negative price event, the market is screaming “stop generating”. But if your contract still pays you based on output, you have every incentive to keep going. The cost of paying someone else to take the power can be less than the subsidy you’d lose by switching off.

So the system ends up doing something perverse: it pays generators to keep producing power that nobody wants, and then pays other countries to take it away.

2. A grid built for yesterday, not for a renewables surge

The UK has poured money into generation capacity—offshore wind, solar, interconnectors—but has been slow, bureaucratic and under‑invested on:

  • Transmission upgrades—moving power from windy Scotland and the North Sea to demand centres in England.
  • Storage—batteries, pumped hydro, demand‑side response at scale.
  • Flexible backup—fast‑ramping gas, smart tariffs, and industrial load‑shifting.

When you bolt a 21st‑century renewables fleet onto a 20th‑century grid, you get congestion, curtailment and waste.

The system then has to pay wind farms not to generate in some regions, while importing power elsewhere. Negative prices are just the most visible symptom of that mismatch.

3. Political obsession with “headline capacity” over system design

Net zero politics has been sold as a race to headline numbers:

  • X gigawatts of offshore wind by year Y
  • Z per cent of power from renewables
  • “Clean power by 2030”

What has not been sold—or properly designed—is the system architecture that makes that capacity economically coherent: locational pricing, flexible demand, storage, and a planning regime that can actually deliver grid reinforcement on time.

Ed Miliband’s own Electricity Market Review explicitly rejected zonal pricing in favour of a reformed national price, arguing that a single price is “fairest” and better for investment. That sounds nice politically, but it hides the real cost of congestion and mis‑location.

Instead of prices signalling “don’t build another wind farm here until the grid is upgraded”, the system socialises the pain across everyone’s bills.

Why are we paying France?

Interconnectors are not inherently stupid. In a rational system, they:

  • Smooth out volatility—import when you’re short, export when you’re long.
  • Share capacity—you don’t need to build as much domestic backup if you can lean on neighbours.

The problem is that the UK has created a structure where:

  • We over‑generate at certain times because of rigid contracts and inflexible plant.
  • We lack storage and flexible demand to soak up that surplus domestically.
  • We then use interconnectors as a dumping ground, paying others to take power that our own consumers have already funded through subsidies and levies.

France, with its large nuclear fleet and different cost structure, can happily take that cheap or even “paid‑to-take” power, displacing its own generation and lowering its average costs.

Meanwhile, UK industry is paying power prices around 60 per cent higher than in France on average.

So, we (the UK) socialise the cost of building and subsidising the capacity, then export the benefit at a discount.

How did this policy architecture even get created?

This isn’t one bad decision; it’s a stack of incentives and political choices that line up in the worst possible way.

1. Short‑term politics, long‑term contracts

Governments of all colours wanted:

  • Quick, visible progress on renewables.
  • Private capital to fund it, not the state balance sheet.
  • Minimal upfront tax rises.

The answer was long‑term, legally binding contracts (RO, CfDs, capacity market) that shifted risk onto consumers via bills. Once signed, these contracts are hard to change without spooking investors or triggering compensation claims.

So ministers get the photo‑ops—“world‑leading offshore wind”, “clean power by 2030”—while the structural costs and distortions are baked in for decades.

2. Ideological framing: net zero as a moral crusade, not an engineering project

Net zero has been framed as a moral imperative first, an engineering challenge second. That has consequences:

  • Questioning the design is painted as questioning the goal.
  • Complex system trade‑offs are reduced to slogans about “cheap renewables” and “green jobs”.
  • Uncomfortable truths—like the need for gas backup, storage, and grid reform—are pushed into the technical long grass.

The result is a policy environment where it is easier to announce another offshore wind auction than to confront the messy, expensive business of rewiring the grid and redesigning market signals.

3. Regulatory fragmentation and institutional cowardice

Ofgem, National Grid ESO, the Department for Energy Security and Net Zero, the Treasury—each has a slice of the problem, but no one owns the whole system outcome.

  • Ofgem focuses on consumer protection and network costs, often slowing investment.
  • Treasury resists big upfront public spending on grid and storage, preferring “market‑based” fixes.
  • Ministers chase announcements that look good in manifestos.

No one is politically rewarded for saying: “We need to spend billions on grid reinforcement and storage now, or we’ll be paying France to take our power in five years.” So it doesn’t happen at the necessary scale.

Is this fixable, or are we stuck paying others to take our power?

It is fixable—but not with more of the same.

An honest, grown‑up approach would mean:

  • Rewriting incentives so generators are paid for being useful to the system, not just for raw output. That means tighter rules on when subsidies are paid during negative prices, and contracts that reward flexibility.
  • Accelerating grid and storage investment as national infrastructure, not an afterthought. That likely means more state involvement and faster planning, not just hoping private investors will do it.
  • Introducing stronger locational signals—whether full zonal pricing or something close to it—so that the cost of building in the wrong place is visible, not smeared across everyone’s bills.
  • Using interconnectors intelligently, not as a dumping ground: export surplus when it’s genuinely cheap, but don’t subsidise over‑generation just to keep contracts happy.

So how stupid is this policy?

On a technical level, the engineers keeping the lights on are doing miracles with the system they’ve been given. The stupidity sits higher up:

  • Designing a net zero pathway around rigid subsidies and under‑built infrastructure.
  • Refusing to confront the trade‑offs, then acting surprised when the physics bites back.
  • Allowing a political narrative of “cheap green power” to coexist with some of the highest industrial prices in the world and growing episodes of negative pricing.

The real scandal isn’t just that we pay France to take our power. It’s that British households and firms have already paid once—through levies and high tariffs—to build that surplus, and then pay again when the system has to bribe someone else to use it.

Work that one out…!

UK and U.S. economic data roundup as of week ending 19th June 2026

UK U.S. June 2026 economic data

United Kingdom – Latest Data This Week to June 19th 2026

Labour market:

  • The UK unemployment rate for April 2026 held at 4.9%, slightly below the previous 5% reading. Average earnings including bonuses grew 4.4%, while earnings excluding bonuses rose 3.4%. Employment increased by 100,000 in April, although HMRC payrolls for May showed only a marginal +2,000 change.

Retail sales:

  • Retail sales rebounded strongly in May 2026, rising 1.2% month‑on‑month and 3.2% year‑on‑year, reversing April’s declines. Retail sales excluding fuel also rose 1.2% MoM and 4.6% YoY.

Public finances:

  • Public sector net borrowing (excluding banks) came in at £23.3bn in May, slightly worse than April’s revised figure.

Business activity:

  • Flash PMIs for June show mixed momentum:
    • Manufacturing PMI: 53.9 (expansion)
    • Services PMI: 49.3 (contraction)
    • Composite PMI: 49.7 (borderline contraction) These readings suggest the UK economy is losing some pace heading into summer.

United States – Latest Data This Week to 19th June 2026

Labour market:

  • Initial jobless claims for the week ending 13th June 2026 fell slightly to 226,000, broadly in line with expectations. Continuing claims rose to 1.81 million, indicating some softening in labour market conditions.

Manufacturing & business surveys:

  • The Philadelphia Fed Manufacturing Index jumped to 10.3 in June from –0.4, signalling a notable improvement in factory activity.
  • The S&P Global flash PMIs for June show:
    • Manufacturing: 55.1 (solid expansion)
    • Services: 50.7 (modest expansion)
    • Composite: 51.5 (steady growth) These point to a resilient US private‑sector backdrop.

Housing & consumer indicators:

  • Mortgage rates eased slightly, with the 30‑year rate dipping to 6.47%.
  • Redbook retail sales rose 9.4% YoY, suggesting firm consumer spending.

Capital flows & energy:

  • Net long‑term TIC flows for April registered $103.1bn, indicating strong foreign demand for US assets.
  • API data showed a sharp –8.33 million barrel draw in crude oil stocks, hinting at tighter near‑term supply.

Overall Pictures for UK and U.S.

  • UK: A mixed week — labour market steady but softening at the margins; retail sales surprisingly strong; PMIs signalling a mild loss of momentum; public borrowing still elevated.
  • US: Data broadly stronger — manufacturing rebounded, services steady, jobless claims stable, and consumer spending indicators show firm.

Why is UK Politics in such a Shambles?

UK Political Shambles

Britain has ripped through five prime ministers in just over five years — Theresa May, Boris Johnson, Liz Truss, Rishi Sunak, and now the prospect of yet another change.

It is not simply bad luck or a run of flawed leaders. It is the visible symptom of a political system that has lost focus and direction.

Conservative infighting to Labour back biting!

The core problem is structural volatility. The UK’s unwritten constitution relies heavily on norms, restraint and party discipline. Over the past decade, those stabilising forces have collapsed.

Brexit

Brexit detonated the old Conservative coalition, splitting MPs into factions that no longer share a common project. Once a party becomes a collection of tribes, leadership becomes temporary management rather than authority.

Prime ministers are installed not to govern but to contain internal warfare — and they are removed the moment they fail to do so.

Exhaustion

The second driver is institutional exhaustion. Westminster has been running in crisis mode since 2016: Brexit negotiations, minority government, pandemic, inflation shock, energy crisis, geopolitical instability.

The machinery of state has been asked to deliver transformation while simultaneously firefighting. That combination breeds short-termism. Policies are launched for headlines, not outcomes.

Leaders are judged by weekly polling, not national strategy. The result is a political class that behaves like a boardroom under siege — reactive, brittle, and constantly reshuffling the chief executive.

Disillusioned

A third factor is public disillusionment. Trust in politics has fallen to historic lows. Voters now punish governments faster and more aggressively than at any point in modern British history.

The electoral cycle has shortened psychologically: every scandal becomes existential, every by‑election a referendum on the prime minister’s survival.

This creates a feedback loop where MPs panic, parties fracture, and leaders lose authority long before the public formally removes them.

Gap

Finally, the UK faces a governance gap. The country has major structural problems — weak productivity, regional inequality, an overstretched NHS, fragile public finances — but no long-term political consensus on how to fix them.

Without a shared national direction, governments drift, parties implode, and leadership churn becomes inevitable.

Britain’s political chaos is not random. It is the predictable outcome of a system that has lost coherence, a governing party that has lost unity, and a public that has lost patience. Until those three forces stabilise, the revolving door at No. 10 will keep spinning.

Just look at the calibre of politicians in the UK – or lack thereof.

I rest my case.

The self-destruct button is being pressed yet again…

UK politicians – it’s time to grow-up.

Definition of politician

A person who is professionally involved in politics, especially someone who holds or seeks public office in government.

More broadly, it refers to anyone who participates in governing, policy‑making, or political leadership at local, national, or international level.

Three words immediately jump out at me: professional, govern and leadership.

I see very little of any of these right now in our political ‘elite’.

UK Borrowing Falls, Offering Treasury Some Relief – March 2026

UK borrowing falls

The latest public finance figures show that government borrowing has dropped to a lower‑than‑forecast level, helped by stronger tax receipts and easing inflationary pressures.

While the precise numbers will be scrutinised in the coming days, the headline outcome marks a modest but meaningful improvement in the UK’s fiscal position.

Softer inflation and lower interest rates

Analysts note that softer inflation has reduced the government’s debt‑interest bill, particularly on index‑linked gilts, which had surged during the inflation spike of the past two years.

The fall in borrowing also reflects a stabilising labour market and firmer wage growth, which have supported income‑tax and National Insurance receipts.

At the same time, lower market interest rates — driven by expectations of further Bank of England cuts after recent reductions to 3.75% — have eased short‑term financing costs for the Treasury.

High debt level

However, economists caution that the improvement should not be overstated. UK debt remains historically high, and pressures on public services, welfare spending, and capital investment persist.

Moreover, with growth still subdued and geopolitical risks keeping energy markets volatile, the fiscal outlook remains vulnerable to external shocks.

Even so, today’s figures provide the Chancellor with a welcome narrative shift: after years of deteriorating public finances, the government can point to early signs of stabilisation — albeit from a challenging starting point.

What the real data shows (ONS, published 23rd April 2026)

The latest ONS release confirms that UK government borrowing has indeed come in lower than expected, and the scale of the improvement is now clear:

  • Annual borrowing: £132.0 billion in the year to March 2026 — £19.8 billion lower than the previous year — £0.7 billion below the OBR forecast — Lowest level since 2022–23
  • March borrowing: £12.6 billion — £1.4 billion lower than March 2025 — Lowest March figure since 2022
  • Borrowing as % of GDP:4.3%, the lowest since 2019–20

The U.S./ Iran / Israel conflict with undoubtably hold the economy back as the effect has yet to fully filter through.

U.S. non-farm payrolls surged by 254,000 in September 2024

U.S. non-farm payroll data

In September 2024, the U.S. economy saw a significant increase in job additions, substantially surpassing expectations and contributing to a robust employment landscape as the unemployment rate declined, according to the U.S. Labor Department’s report issues Friday 4th October 2024.

U.S. Non-farm payroll numbers rose by 254,000 in September 2024, a jump from the revised figure of 159,000 in August and exceeding the forecast of 150,000.

The unemployment rate dropped to 4.1%, a decrease of 0.1 percentage point, while the household employment survey reported a substantial increase of 430,000 jobs.

Average hourly earnings grew by 0.4% for the month and saw a 4% rise compared to the previous year, outpacing the projected estimates.

U.S. Bureau of Labor Statistics

U.S. consumer confidence falls the most in three years

U.S. consumer

In September 2024, consumer sentiment plummeted, marking the most significant drop in over three years, driven by escalating concerns over employment and business conditions, according to a report by the Conference Board released on Tuesday 24th September 2024.

The consumer confidence index reportedly fell to 98.7 from 105.6 in August 2024, marking the largest one-month drop since August 2021. This was contrary to the forecast of 104 and a stark contrast to the 132.6 reading in February 2020, just before the Covid pandemic’s onset.

All five components surveyed by the organisation declined this month, with the most significant decrease observed in the age bracket of 35-54 with incomes under $50,000.

Concerning

“Consumer evaluations of the present business conditions have turned negative, and the outlook on the current labour market has further weakened. There is also a growing pessimism about future labour market conditions, business conditions, and income prospects,” the Conference Board’s chief economist reportedly commented.

This significant dip in the confidence index last occurred as inflation began its ascent to the highest point in over four decades.

Following the announcement, stocks experienced temporary declines, and Treasury yields decreased.

UK’s wealth creators are threatening to exit en masse ahead of proposed tax changes

UK luxury shopping

Labour’s proposal to dismantle the UK’s non-dom tax system may lead to an exodus of the ultra-wealthy, as advisors and research bodies have cautioned.

Switzerland, Monaco, Italy, Greece, Malta, Dubai, and the Caribbean are becoming popular relocation destinations, sensing the apprehension among affluent investors.

Meanwhile, London’s super-prime real estate market could experience a decrease in transactions, although this may present opportunities for wealthy U.S. and other global buyers.

Nearly two-thirds (63%) of affluent investors have indicated they would depart from the U.K. within two years or ‘sooner’ if the Labour government proceeds with its intention to abolish the colonial-era tax concession.

Furthermore, 67% stated they would have chosen not to migrate to Britain initially, as per a recent Oxford Economics study evaluating the impact of these plans.

The UK’s non-dom regime, a tax rule with a 200-year history, allows individuals residing in the UK but domiciled elsewhere to not pay tax on foreign income and capital gains for up to 15 years. As of 2023, an estimated 74,000 people enjoyed the status, up from 68,900 the previous year.

Labour last month set out plans to abolish the status, expanding on a pledge set out in its election manifesto

U.S. jobs data revision creates economic concern and political argument

U.S> jobs data revision

Job growth in the US last year was weaker than previously believed, according to a statement from the Labor Department on Wednesday 21st August 2024.

This revelation has intensified the ongoing debate regarding the health of the U.S. economy. The department’s updated figures indicate that there were approximately 818,000 fewer jobs added over the 12 months leading up to March than initially estimated.

This preliminary revision suggests a 30% decrease in the total number of jobs created during that period, marking the most significant adjustment since 2009.

The revised data points to an average monthly job increase of about 174,000, a reduction from the previously estimated 240,000.

Downward revisions affected most sectors, including information, media, technology, retail, manufacturing, and the broad category of professional and business services.

Analysis by Oxford Economics noted that this indicates the job growth for the period relied more heavily on government and education/healthcare sectors than previously understood.

Despite the revisions, hiring remained robust, albeit not at levels sufficient to match the growth of the working-age population.

The U.S. Labor Department issues monthly job creation estimates based on employer surveys and regularly updates these figures as more data becomes available, with an annual reset at the beginning of each year.

The report from Wednesday offered a glimpse into this process, incorporating data from county-level unemployment insurance tax records. This year’s revision is notably larger than those of previous years.

The Biden administration has highlighted strong job growth as evidence that its policies have positioned the U.S. as the world’s leading economy post-pandemic.

However, Republicans have used the latest figures to contend that the Democrats have misled the public about the economic situation. The Republican Party took to social media to announce: “BREAKING: 818,000 jobs that the Biden-Harris administration claimed to have ‘created’ do not actually exist.”

Over the past year, the U.S. has consistently reported robust job growth, defying both economists’ expectations and public sentiment. These gains have been particularly surprising given the highest borrowing costs in a generation, which typically hinder economic growth.

The recent revisions have lent weight to the argument that the labour market is less stable than previously thought, as highlighted by the Republican response.

Analysts believe these new figures will reinforce the case for the U.S. Federal Reserve to lower interest rates at its upcoming September 2024 meeting, a move that is widely anticipated to prevent further weakening of the job market.

These revisions have not caused widespread concern

Despite earlier economic anxieties this month, financial markets have largely absorbed the latest data without significant turmoil.

But that doesn’t mean there will be zero fallout – turmoil may follow. The data believed to be correct is incorrect – so, can we believe the data? Are there cracks appearing in the U.S labour market?

This data helped the U.S. economy – but it wasn’t right?

Short-sighted policy U-turn as the UK Labour government cancels £1.3 billion of computing projects

AI supercomputer mainframe

A real set-back for UK AI global ambition

The new Labour government has withdrawn £1.3bn in funding previously pledged by the Conservatives for technology and Artificial Intelligence (AI) initiatives.

This includes £800m allocated for the development of an exascale supercomputer at Edinburgh University and an additional £500m for the AI Research Resource, which provides computing power for AI. These funds were announced less than a year ago.

The Department for Science, Innovation and Technology (DSIT) stated that although the funds were promised by the former administration, they were not included in its budget. The decision has faced criticism from some within the industry.

Another blow for the UK’s homegrown tech sector.

Federal Reserve chair Powell says keeping rates high for too long could jeopardize growth

Banker giving a speech

Jerome Powell on Tuesday 9th July 2024 reportedly expressed concern that holding interest rates too high for too long could jeopardize economic growth. This comment came ahead of the consumer price index reading due this week.

Preparing for a two-day session on Capitol Hill, the central bank chief stated that the economy and labour market continue to be robust, even with some recent slowdown. Powell noted a slight reduction in inflation, affirming that policymakers are determined to reduce it to their target of 2%.

At the same time, in light of the progress made both in lowering inflation and in cooling the labour market over the past two years, elevated inflation is not the only risk we face,” he reportedly said. “Reducing policy restraint too late or too little could unduly weaken economic activity and employment.”

Sounds to me like he is paving the way for the first interest rate reduction.

The comment ties-in with the upcoming one-year period since the Federal Open Market Committee (FOMC) last increased the benchmark interest rates.

“Vote Now! Pay Later. Our Deal. Labour”

UK Election – The Labour Party slogan is ‘CHANGE’ – but ‘CHANGE‘ to what?

I do not support any party. I have no idea what the Labour party stands for anymore. And as for the Conservatives – not a clue either – too many deceits and for far too long!

We have choice – but no choice!

U.S. jobs report September 2023

Work

The latest U.S. jobs report for September 2023 was released on Friday, October 6, 2023.

The U.S. economy added 336,000 jobs last month, much more than expected, despite the Federal Reserve’s struggle to cool the world’s largest economy. 

The unemployment rate was 3.8%, in line with August 2023. The data lifted hopes that the central bank will manage to guide the U.S. economy to a ‘soft landing’, where a recession is avoided. Bear in mind the Fed were late in dealing with the initial rise in inflation – so this battle has become harder and prolonged.

The job gains were the largest monthly rise since January 2023, and almost twice what economists had anticipated. Government and healthcare added the most jobs. The labour market still appears solid.

However, not all indicators were positive. The ADP’s national employment report showed that private-sector employers added only 89,000 jobs in September, far fewer than expected. Some factors outside the Fed’s control, such as the autoworker strike and the threat of a government shutdown, could yet damage the U.S. economy. 

The labour force participation rate also remained low at 63.2%, indicating that many workers have yet to return to the labour market since the Covid19 pandemic of 2020.