UK and U.S. economic data roundup as of week ending 19th June 2026

UK U.S. June 2026 economic data

United Kingdom – Latest Data This Week to June 19th 2026

Labour market:

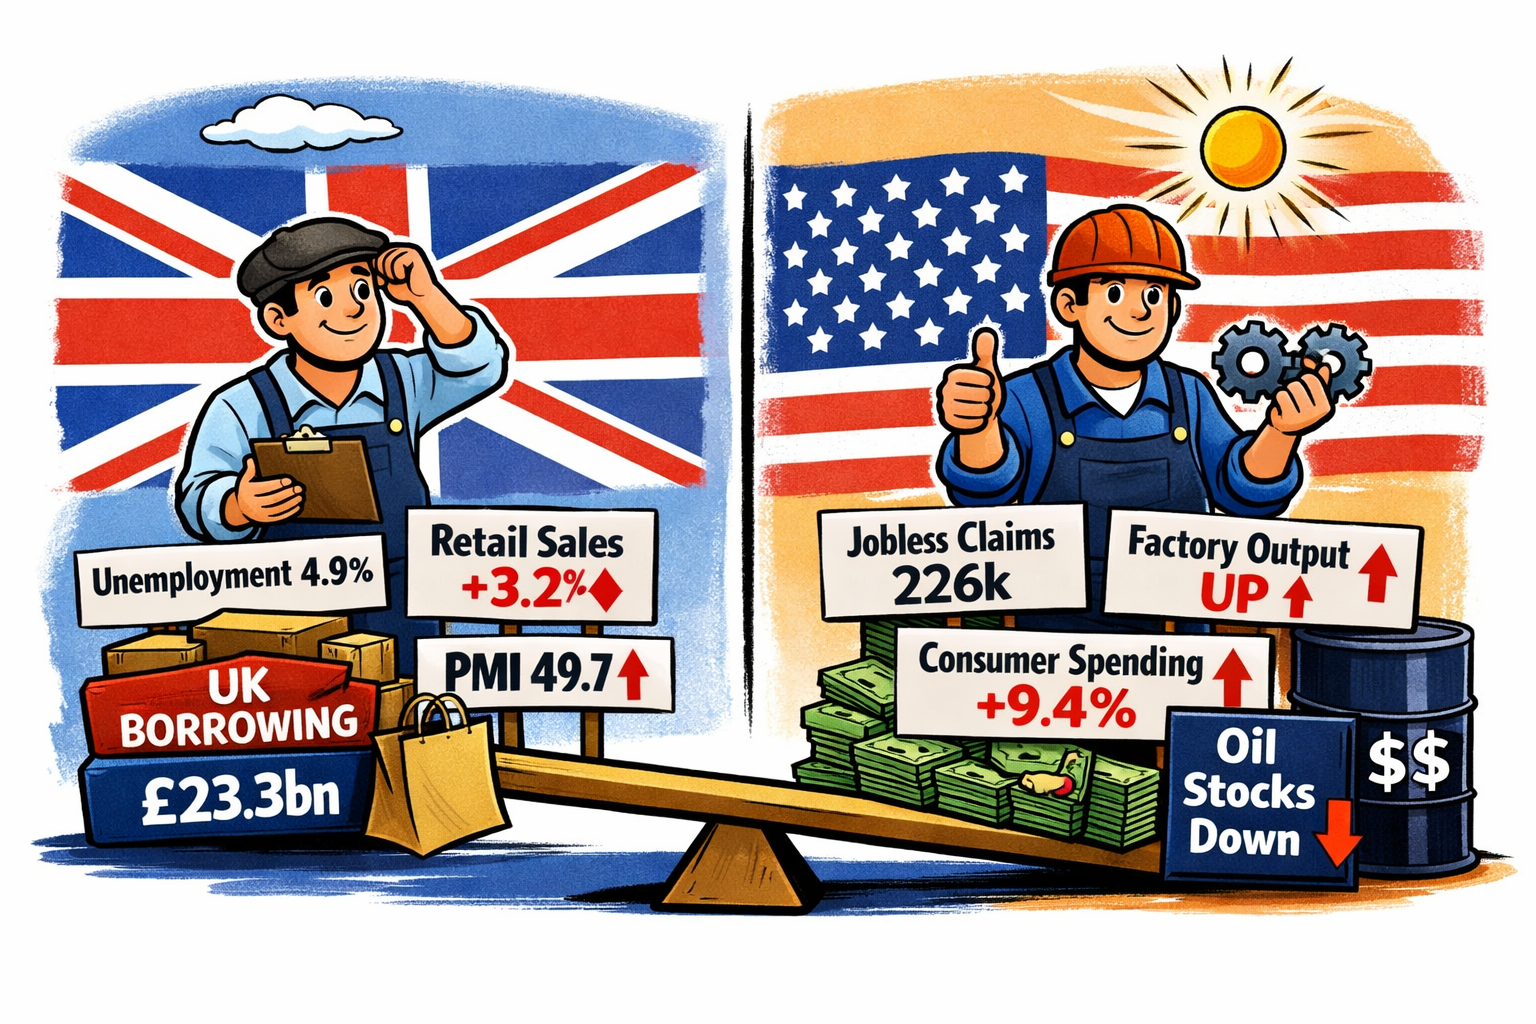
  • The UK unemployment rate for April 2026 held at 4.9%, slightly below the previous 5% reading. Average earnings including bonuses grew 4.4%, while earnings excluding bonuses rose 3.4%. Employment increased by 100,000 in April, although HMRC payrolls for May showed only a marginal +2,000 change.

Retail sales:

  • Retail sales rebounded strongly in May 2026, rising 1.2% month‑on‑month and 3.2% year‑on‑year, reversing April’s declines. Retail sales excluding fuel also rose 1.2% MoM and 4.6% YoY.

Public finances:

  • Public sector net borrowing (excluding banks) came in at £23.3bn in May, slightly worse than April’s revised figure.

Business activity:

  • Flash PMIs for June show mixed momentum:
    • Manufacturing PMI: 53.9 (expansion)
    • Services PMI: 49.3 (contraction)
    • Composite PMI: 49.7 (borderline contraction) These readings suggest the UK economy is losing some pace heading into summer.

United States – Latest Data This Week to 19th June 2026

Labour market:

  • Initial jobless claims for the week ending 13th June 2026 fell slightly to 226,000, broadly in line with expectations. Continuing claims rose to 1.81 million, indicating some softening in labour market conditions.

Manufacturing & business surveys:

  • The Philadelphia Fed Manufacturing Index jumped to 10.3 in June from –0.4, signalling a notable improvement in factory activity.
  • The S&P Global flash PMIs for June show:
    • Manufacturing: 55.1 (solid expansion)
    • Services: 50.7 (modest expansion)
    • Composite: 51.5 (steady growth) These point to a resilient US private‑sector backdrop.

Housing & consumer indicators:

  • Mortgage rates eased slightly, with the 30‑year rate dipping to 6.47%.
  • Redbook retail sales rose 9.4% YoY, suggesting firm consumer spending.

Capital flows & energy:

  • Net long‑term TIC flows for April registered $103.1bn, indicating strong foreign demand for US assets.
  • API data showed a sharp –8.33 million barrel draw in crude oil stocks, hinting at tighter near‑term supply.

Overall Pictures for UK and U.S.

  • UK: A mixed week — labour market steady but softening at the margins; retail sales surprisingly strong; PMIs signalling a mild loss of momentum; public borrowing still elevated.
  • US: Data broadly stronger — manufacturing rebounded, services steady, jobless claims stable, and consumer spending indicators show firm.

South Korea’s Market Faces a Fragile Balancing Act

Risks to South Korea stocks

South Korean equities are showing signs of strain after a powerful rally led almost entirely by semiconductor giants Samsung Electronics and SK Hynix.

Analysts warn that the market’s narrow leadership leaves it exposed to sudden reversals if global chip demand cools or investor sentiment shifts.

Overbought

It has been cautioned that the Kospi’s momentum indicators are flashing overbought signals, suggesting limited room for further gains before a correction sets in.

The country’s heavy reliance on the semiconductor cycle means any slowdown in AI‑related investment or memory‑chip orders could quickly erode confidence.

Broader industrial and consumer sectors have lagged, amplifying the sense that Korea’s stock market is running on a single engine.

Risks

While optimism remains high, the risks are clear: a fragile rally built on concentrated strength and global tech exuberance.

If macro headwinds return, the dust from “macro risks” may finally settle on Seoul’s fast‑moving market.

South Korea’s Kospi hit another new record high despite mixed trading across Asia-Pacific markets and this despite U.S. Iran deal caution.

Bad economic news can be good for stocks

Bad news and good news

Bad economic news appears to have had an interesting impact on the stock market recently.

Traditionally, negative economic data might be anticipated to result in falling stock prices; however, recent trends have diverged from this norm.

News trend

In the past two months, negative economic news has had a paradoxically positive effect on equities. Investors have responded well to poor economic indicators, partly due to the belief that these could lead the Federal Reserve to begin reducing interest rates.

Dollar and the stock market

In recent times, the S&P 500, a large-cap equity index, and the U.S. dollar have exhibited a nearly perfect correlation. As the dollar has seen a gradual decline, the stock market has conversely experienced a rise. Typically, investors flock to the security of cash, and consequently the dollar, in times of uncertainty, yet they also channel investments into stocks upon the arrival of favourable news.

Economic data

Despite the upbeat trend in the stock market, real economic data has frequently fallen short of Wall Street’s predictions. The Citi Economic Surprise Index, a gauge that compares data to expectations, has been on a downward trajectory. This suggests that expectations have been surpassing the actual economic conditions, signalling that the economic situation may not be as favorable as previously thought.

Dilemma for the Fed

The Federal Reserve methodically reviews economic indicators to influence their interest rate decisions. Typically, unfavorable economic reports might prompt the Fed to reduce rates, unless there’s an uptick in inflation. Escalating inflation generally nudges the Fed towards a tighter monetary policy.

Monthly data roll-out

Data concerning the U.S. labour market presented to the Fed and markets may create that ‘pivotal’ moment – it often does – markets move of Fed comments and ‘awaited’ news. Reports detailing job openings, private sector job creation, and the Bureau of Labour Statistics’ nonfarm payrolls will shed light on the economy’s condition.

If job growth remains within the ‘Goldilocks range’ (neither too strong nor too weak), it may preserve the fragile equilibrium where unfavourable economic news has paradoxically favoured stock prices, while preventing excessive gloom.

Conclusion

To summarize, although adverse economic news has lately been advantageous for stock markets, monitoring this precarious balance is crucial. Excessive pessimism could be a harbinger of impending difficulties, despite its current benefits.

Note about Citigroup Economic Surprise Index

The Citigroup Economic Surprise Index is the sum of the difference between the actual value of various economic data and their consensus forecast. If the index is greater than zero, it means that the overall economic performance is generally better than expected, and the S&P 500 has a high probability of strengthening, and vice versa.