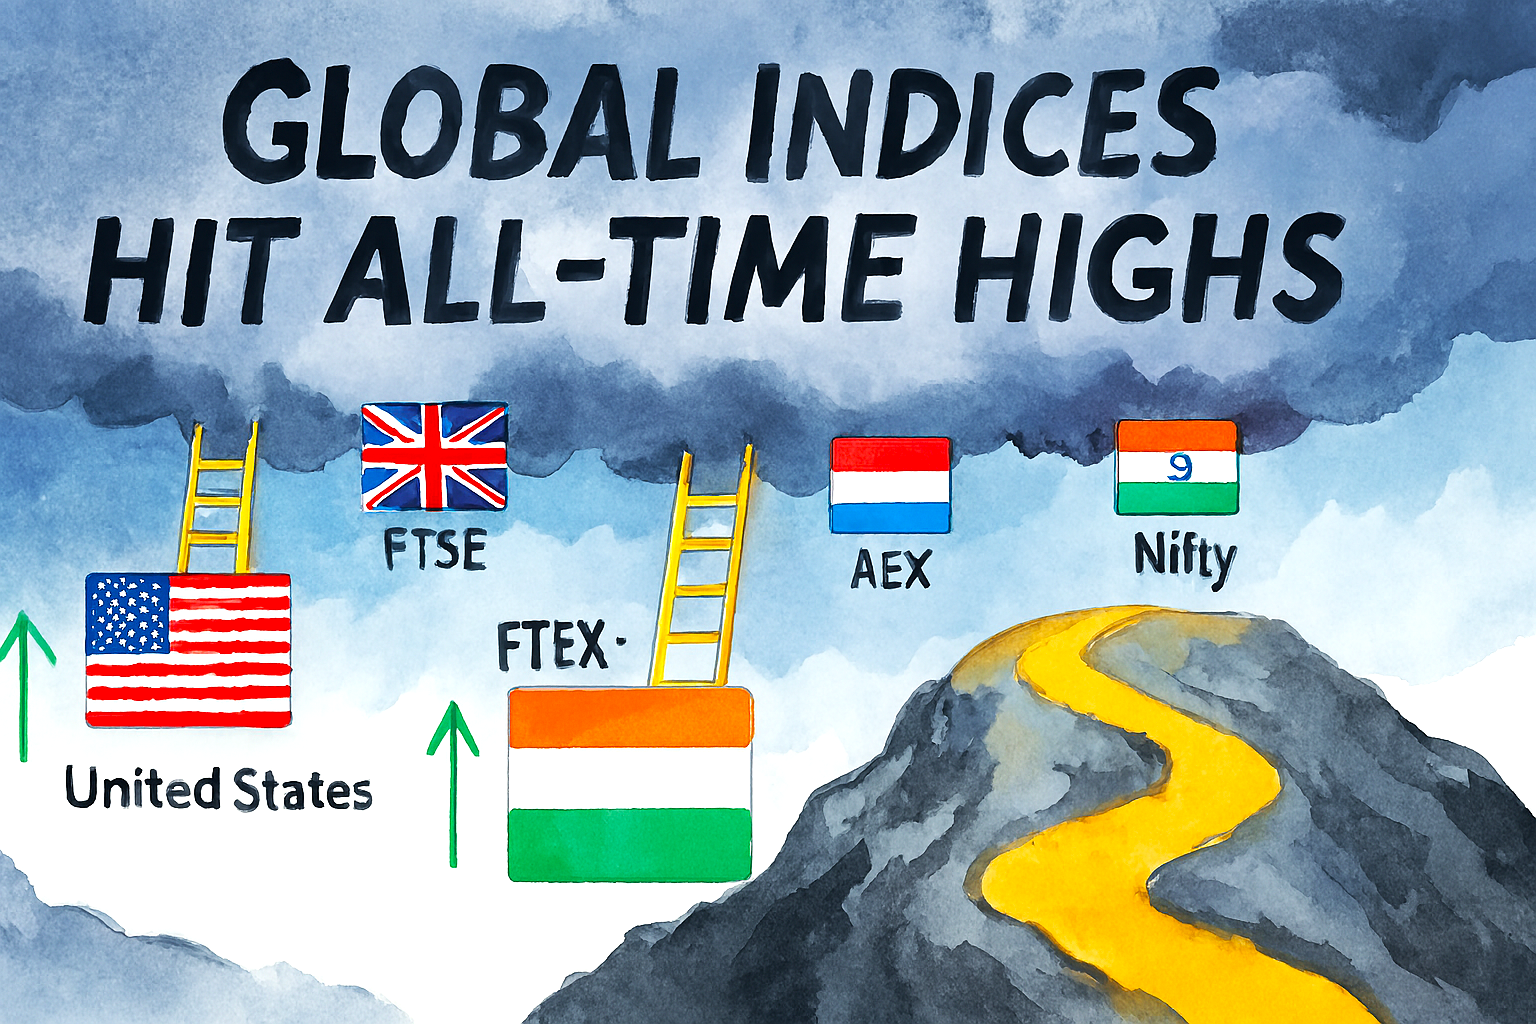
Scaling the Summit:Markets Hit Record Highs Amid Global Uncertainty led by the Nasdaq and S&P 500 reflecting the AI race
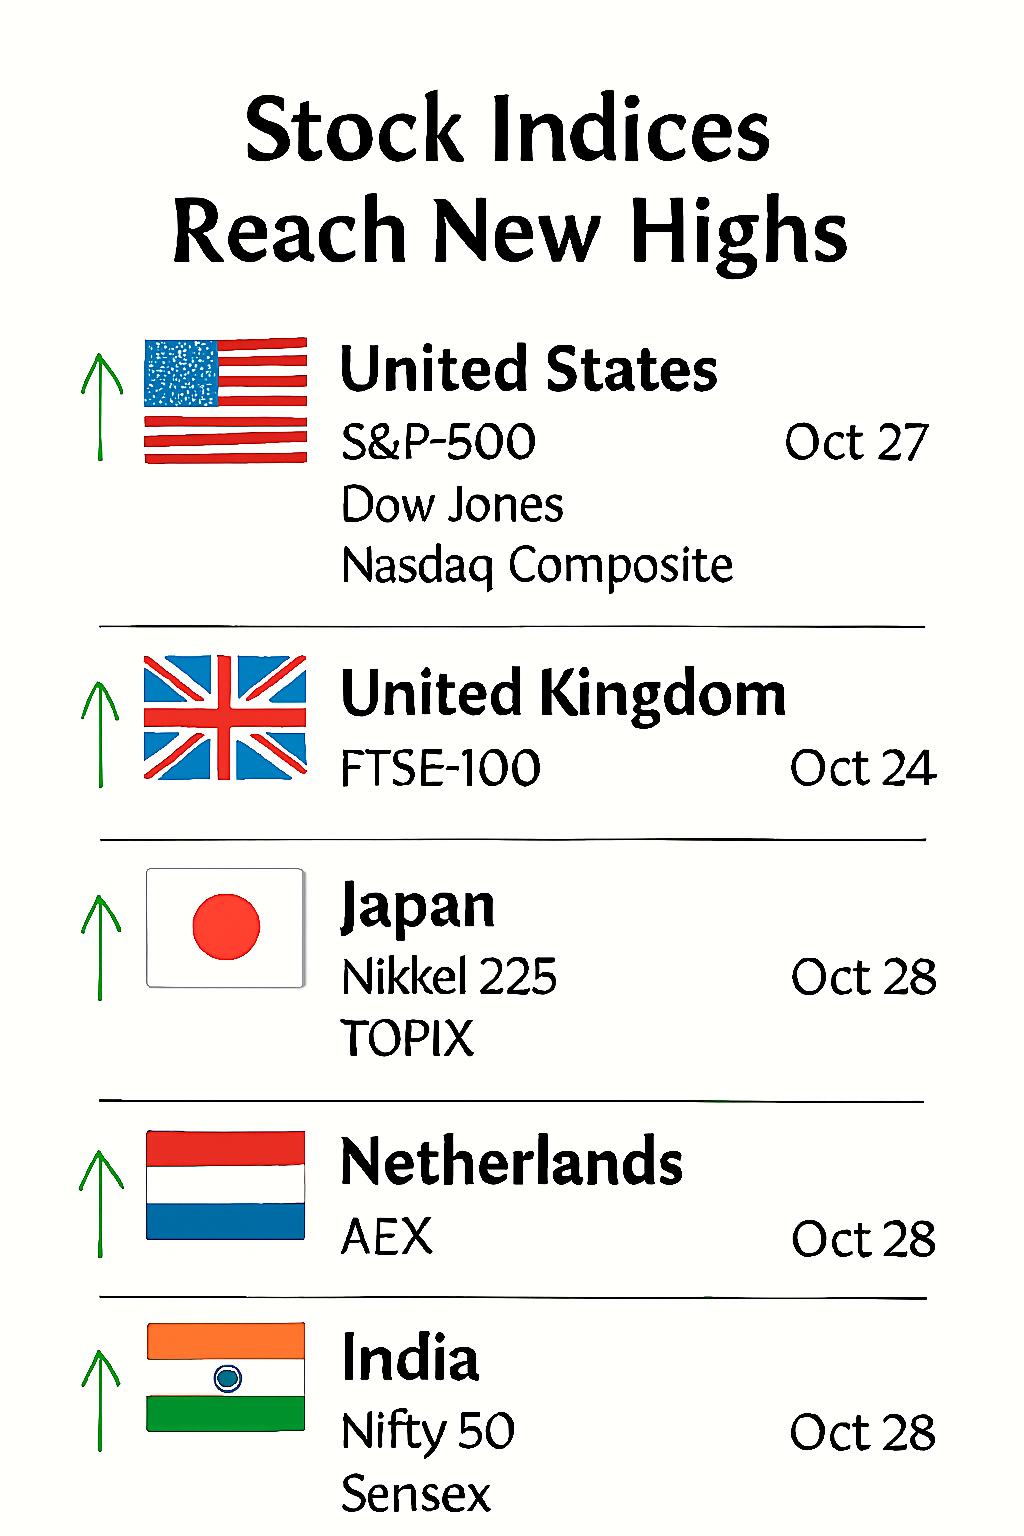
Global stock hit new highs October 2025
🌍 Country
📈 Index Name
🗓️ Date
🔝 Closing Value
🇺🇸 United States
S&P 500
Oct 27
6,875.16
🇺🇸 United States
Dow Jones
Oct 27
47,544.59
🇺🇸 United States
Nasdaq Composite
Oct 27
23,637.46
🇬🇧 United Kingdom
FTSE 100
Oct 24
9,662.00
🇳🇱 Netherlands
AEX Index
Oct 28
966.82
🇮🇳 India
Nifty 50
Oct 28
25,966
🇮🇳 India
Sensex
Oct 28
84,778.84
🇯🇵 Japan
Nikkei 225
Oct 28
50,342.25
🇯🇵 Japan
TOPIX
Oct 28
3,285.87
These rallies were largely fueled by optimism over a potential U.S.–China trade deal, cooler inflation data, and expectations of interest rate cuts from the Fed.
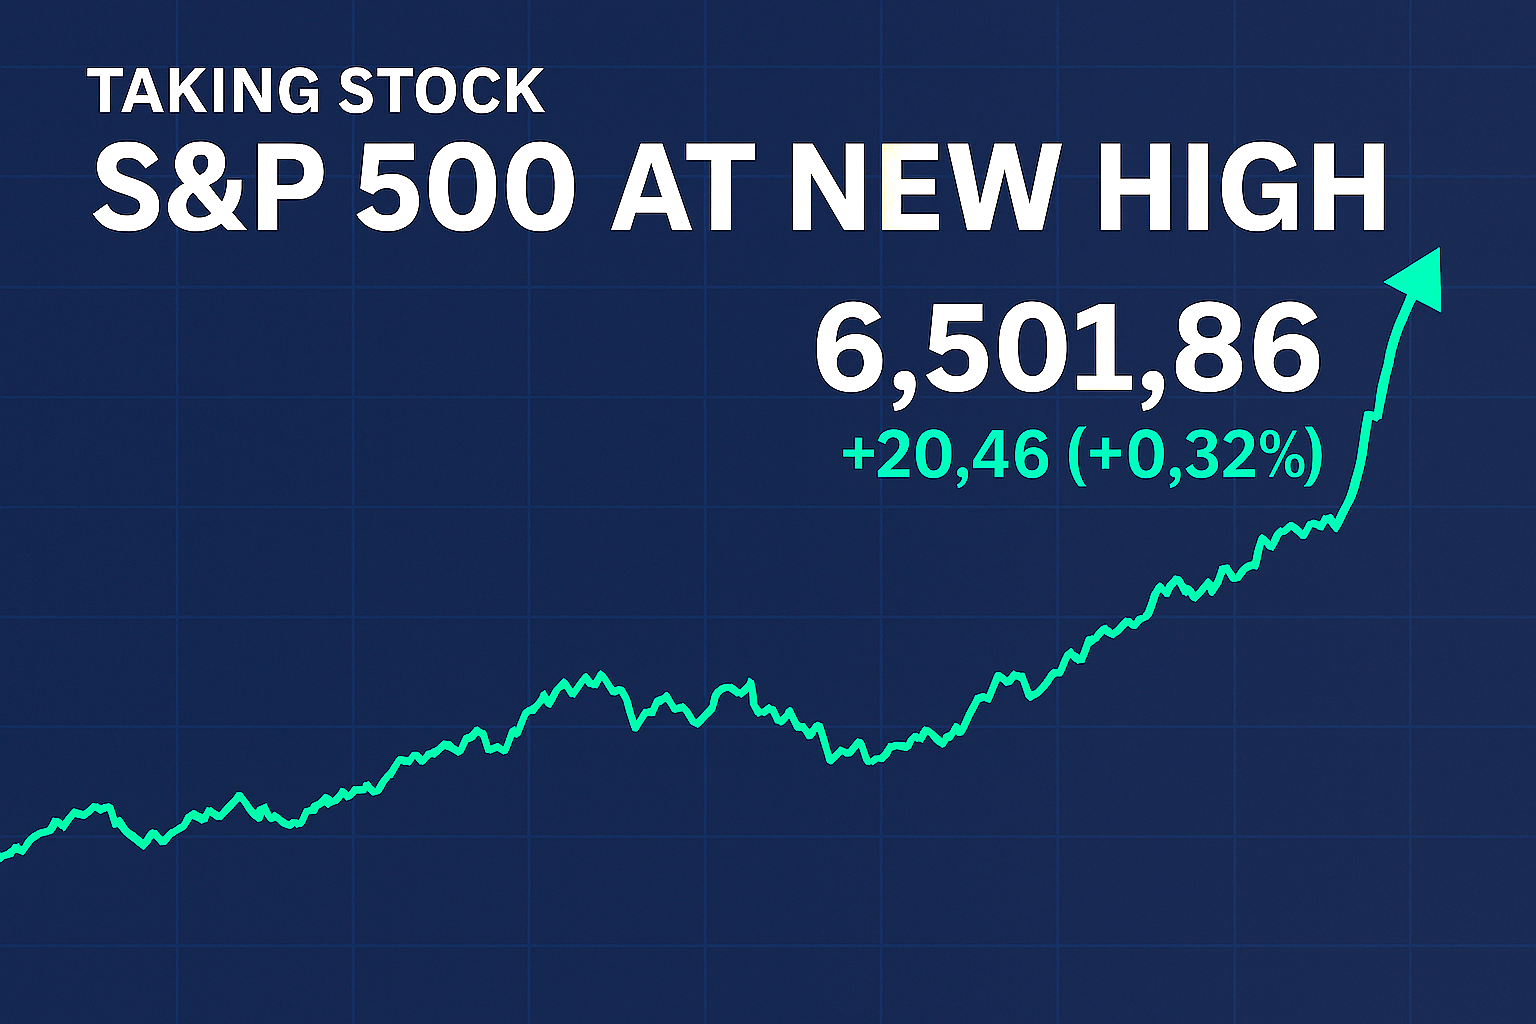
The S&P 500 has notched yet another all-time high, closing at 6501.86 on 28th August 2025
This surge reflects broad investor optimism, driven by strong corporate earnings and expectations of a more accommodative stance from the Federal Reserve.
With tech, healthcare, and financials all contributing to the rally and the indices continued momentum.
Wall Street keeps on giving
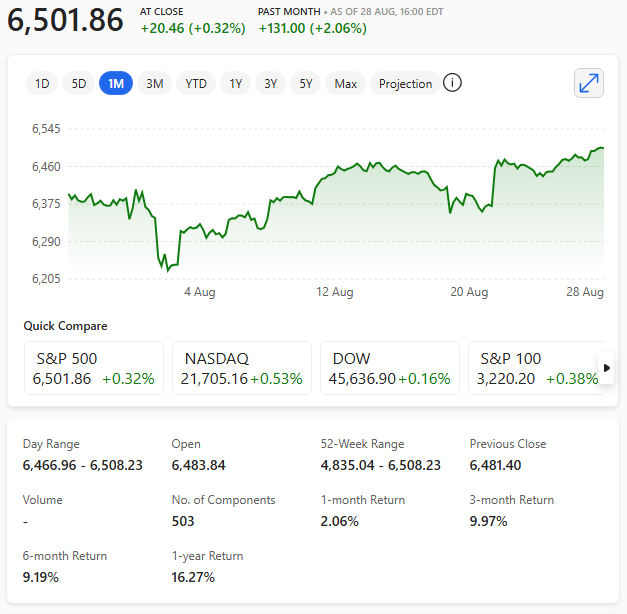
Another high for the S&P 500. The index added 0.32% Thursday and closed above the 6,500 level for the first time. Asia-Pacific markets had a mixed performance on Friday 29th August 2025, with Japanese stocks declining as core consumer prices in Tokyo showed slower growth in August.
S&P 500 one-month cart as it hist new all-time high on 28th August 2025
U.S. second-quarter GDP – revised higher than expected. The economy grew at an annualized rate of 3.3%, according to the Commerce Department’s second estimate, surpassing the initial estimate of 3.0% and the Dow Jones consensus forecast of 3.1%.
Two customers made up 39% of Nvidia’s second-quarter revenue. According to Nvidia’s financial filing this week (August 2025), the customers could be either cloud providers or manufacturers, but not much else is known about their identities.
The FTSE 100 surged past the 9,000-point mark on 15th July 2025, setting a new all-time high and signalling renewed investor confidence in the UK’s economic outlook.
Driven by strong performances in energy, banking, and AI-adjacent tech firms, the benchmark index shattered psychological resistance with broad-based gains.
Much of the momentum came from robust earnings reports and upbeat forecasts from major constituents such as Shell and HSBC.
Analysts also pointed to growing international interest in UK equities, especially as sterling remains relatively stable amid global currency fluctuations.
The breakthrough follows months of resilience in the face of inflationary pressures and geopolitical uncertainty.
Investors appear to be rewarding UK equities as a steady alternative option against the backdrop of U.S. market turmoil – maybe the U.S.is running out of steam?
While traders welcomed the milestone, some caution against irrational exuberance. Crossing 9,000 is significant, but sustainability depends on whether earnings growth can be maintained
Nonetheless, market watchers view the rally as a strong signal of the FTSE 100’s ability to compete globally.
With fresh liquidity and stabilising rates, the index might not just pause at 9,000 — it may soon look to test even higher ground.
The U.S. stock market surged into July 2025 with a wave of optimism, as the S&P 500 and Nasdaq 100 both hit fresh all-time highs, while the Dow Jones Industrial Average continued its upward climb.
The S&P 500 closed at 6279, marking its fourth record close in five sessions, and the Nasdaq 100 soared to 22867, fueled by strength in AI and semiconductor stocks.
S&P 500 YTD chart
Nasdaq 100 YTD chart
Driving the rally was a stronger-than-expected June 2025 jobs report, which revealed 147,000 new positions added and an unemployment rate dipping to 4.1%.
This labour market resilience tempered expectations for a near-term Federal Reserve rate cut, but bolstered investor confidence in the economy’s momentum.
Tech giants like Nvidia and Microsoft led the charge, with Nvidia nearing a $4 trillion market cap amid surging demand for AI infrastructure.
Datadog spiked after being added to the S&P 500, and financials like JPMorgan Chase and Goldman Sachs hit lifetime highs.
The Dow, while slightly trailing its tech-heavy peers, posted steady gains and now hovers near its own record territory.
With trade optimism rising and President Trump’s tax-and-spending bill passed, Wall Street enters the holiday weekend riding a wave of bullish sentiment.
Gold extended a blistering rally to rise above $3,500 an ounce for the first time, as concern that President Donald Trump could fire Federal Reserve Chair Jerome Powell triggered a flight from U.S. stocks, bonds and the dollar.
This public rebuke of JeromePowell comes on top of geopolitical risks, trade tensions and concerns over economic stability – all enflamed by Trump’s tariff onslaught.
Gold hits new all-time high!
Gold has reached an unprecedented milestone, soaring to $3,500 per ounce for the first time, as political and economic uncertainty surrounding President Donald Trump’s criticism of Federal Reserve Chair Jerome Powell shakes global markets.
Investors have flocked to gold as a safe-haven asset, seeking refuge from the volatility triggered by Trump’s public demands for immediate interest rate cuts and threats to dismiss Powell.
Gold’s rapid ascent has been supported by a combination of trade tensions, tariff uncertainties, and geopolitical risks. Its ascent this year suggests that markets have less confidence in the U.S. than ever.
Dollar plummets as gold hits new all-time high!
The U.S. dollar has plummeted to its lowest level since 2023, further fueling gold’s meteoric rise.
Concerns over the Federal Reserve’s independence have eroded confidence in U.S. assets, prompting a flight to bullion-backed exchange-traded funds and central-bank purchases.
Market analysts are divided on whether gold’s rally will sustain its momentum. While some predict further gains, citing the metal’s enduring appeal as a hedge against economic instability, others caution that the recent surge may lead to a temporary pullback.
Regardless, gold’s historic climb underscores its status as a reliable store of value in times of turmoil, solidifying its position as the ultimate safe-haven asset.
Gold has seen a significant rise in 2025
On 1st January 2025, gold was priced at $2,623 per ounce. As of 21st April, 2025, gold has surged to $3,373.70 per ounce.
This marks an increase of $750.70 per ounce, or approximately 29% in just a few months.
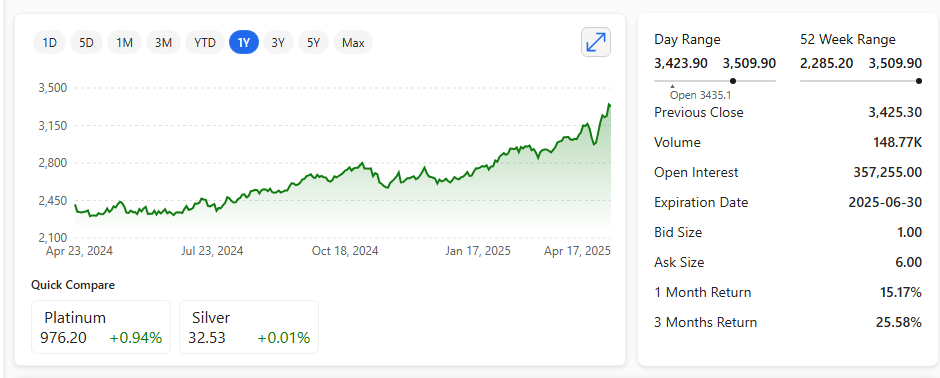
One-year gold chart
Gold one-year chart
In April 2024, gold was priced at approximately $2,284 per ounce. As of April 2025, gold has surged to $3,373.70 per ounce. This marks an increase of $1,089.70 per ounce, or roughly 48% in just one year.
Gold has reached a historic milestone, breaking the $3,000 per ounce barrier for the first time in history
This remarkable surge reflects a confluence of global economic uncertainties, geopolitical tensions, and shifting investor sentiment.
The rally has been fueled by a variety of factors. Central banks worldwide have significantly increased their gold reserves, seeking a hedge against inflation and a safeguard from potential economic sanctions.
This trend gained momentum following the freezing of Russian central bank assets in 2022, which underscored the vulnerabilities of holding reserves in foreign currencies.
Additionally, escalating trade tensions and fears of a global recession have driven investors toward safe-haven assets like gold. The U.S. administration’s aggressive tariff policies have amplified market volatility, prompting a flight to stability.
Gold-backed exchange-traded funds (ETFs) have also seen substantial inflows, further bolstering demand.
The psychological significance of crossing the $3,000 mark cannot be understated. It signals a shift in market dynamics, with gold outperforming many traditional asset classes.
Analysts predict that, barring a dramatic change in economic conditions, the upward trajectory may continue, potentially reaching new highs in the coming months.
This milestone underscores gold’s enduring appeal as a store of value in turbulent times, cementing its status as a cornerstone of global financial markets.
While some experts predict gold could reach $3,500 by the third quarter of 2025, others are more optimistic about the $4,000 mark being attainable in the near future.
The S&P 500 and Nasdaq Composite reached new closing highs on Tuesday 11th June 2024, propelled by Apple as the tech giant’s stock hit a record itself.
The S&P 500 index climbed to a new high to close at 5375, while the Nasdaq Composite finished the day at 17343. Both indices also hit new intraday highs. However, the Dow Jones Industrial Average fell by around 120 points to close at 38747.
S&P 500 reaches new all-time high on 11th June 2024
S&P 500 reaches new all-time high on 11th June 2024
Nasdaq Composite hits new all-time high on 11th June 2024
Investors seemed to be cashing in on Nvidia, a leader in artificial intelligence, and shifting focus to Apple, which recently introduced new features likely to drive a surge in iPhone upgrades.
Apple’s stock reached a new high during the trading session, its first since December 2023, with around a 7% increase. Nvidia’s stock declined by 0.7% as some profit taking ensued.
Technical analysis indicates that the risk trends towards the upside, with indicators showing overbought conditions and prices rising above moving averages.
However, it’s crucial to remember that markets are subject to change and can be affected by various factors, including geopolitical risks and economic data.
Recent figures indicate that the U.S. Producer Price Index (PPI) increased less than anticipated, which may influence monetary policy decisions and, as a result, the price of gold. Furthermore, the European Central Bank’s (ECB) choice to keep its monetary policy unchanged could lead to a rate reduction next summer, potentially affecting gold prices as well.
Although the present technical perspective suggests a possible continued rise, market fluctuations can occur due to unexpected events or changes in investor sentiment. Consequently, while gold may not face an immediate decline, it is advisable for investors to remain informed and take into account both technical and fundamental aspects when evaluating market trends.