

Markets rarely fall in a straight line. They move through recognisable phases — each with its own tempo, psychology, and structural drivers.
Understanding these stages doesn’t predict the future, but it does anchor expectations in how markets actually behave.
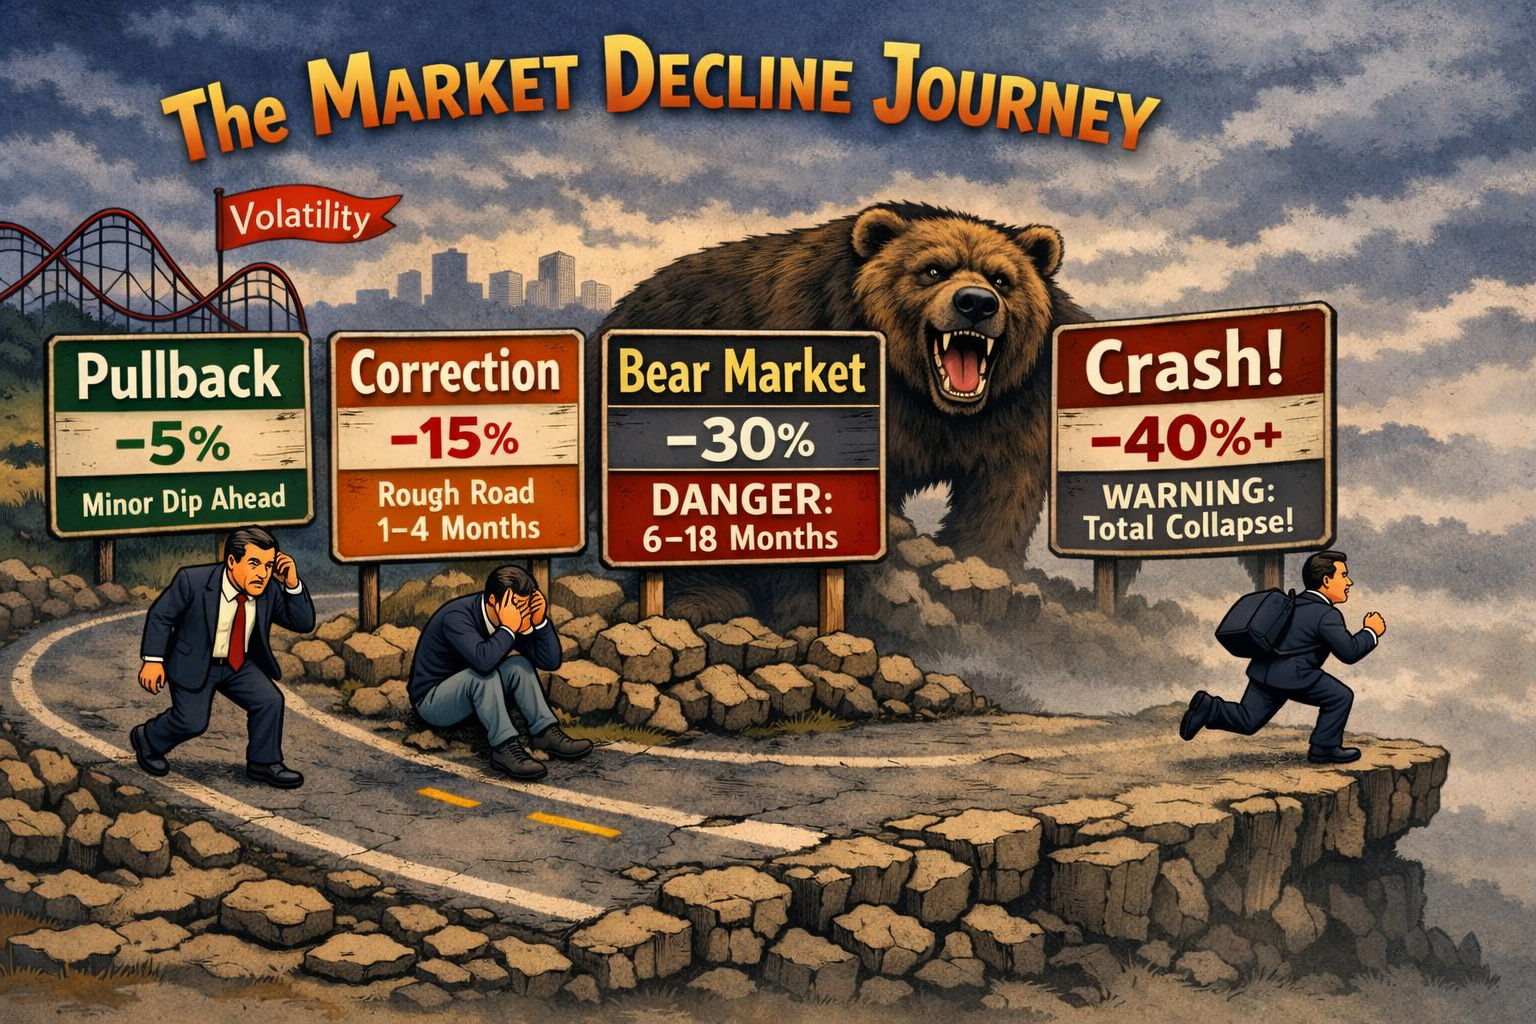
1. Pullback (–3% to –7%) — Duration: Days to Weeks
A pullback is the market taking a breath. It’s usually triggered by a short‑term shock: a hot inflation print, a geopolitical wobble, or simple exhaustion after a strong run.
Pullbacks are fast, shallow, and dominated by technical flows. They typically last 3–15 trading days. Most bull markets experience several each year. They clear froth but rarely change the underlying trend.
2. Correction (–10% to –20%) — Duration: 1–4 Months
A correction is a repricing, not a collapse. It reflects a shift in expectations: earnings disappointment, tightening liquidity, or stretched valuations finally meeting gravity.
The drop to –10% is usually rapid (2–6 weeks), but the stabilisation phase drags on. Corrections often include retests, false dawns, and volatility spikes. They end when positioning resets and macro data stops deteriorating.
3. Bear Market (–20% to –40%) — Duration: 6–18 Months
A bear market is a regime change. Growth slows, earnings contract, and sentiment breaks. Bear markets unfold in waves: an initial shock, a relief rally, then a grinding decline as fundamentals worsen.
The middle phase — the grind — is the longest and most psychologically draining. Policy responses (rate cuts, fiscal support) eventually form the bottoming process, but the recovery is uneven and sector‑specific.
4. Crash (–30% to –50%+) — Duration: Days to Weeks
A crash is not a bigger correction — it’s a liquidity event. Selling becomes indiscriminate, correlations go to one, and markets gap lower because buyers vanish.
Crashes are rare and almost always linked to systemic stress: leverage unwinds, credit freezes, or sudden macro shocks.
They are violent but short. The panic phase typically lasts 5–20 trading days, followed by months of volatility as markets rebuild confidence.
Market Decline Stages at a Glance
| Stage | Typical Decline | Time to Reach | Total Duration | Key Drivers |
|---|---|---|---|---|
| Pullback | –3% to –7% | 2–10 days | Days–2 weeks | Technicals, sentiment |
| Correction | –10% to –20% | 2–6 weeks | 1–4 months | Earnings, valuations, macro |
| Bear Market | –20% to –40% | 1–3 months | 6–18 months | Growth slowdown, credit tightening |
| Crash | –30% to –50%+ | Days | Days–weeks | Liquidity shock, systemic stress |