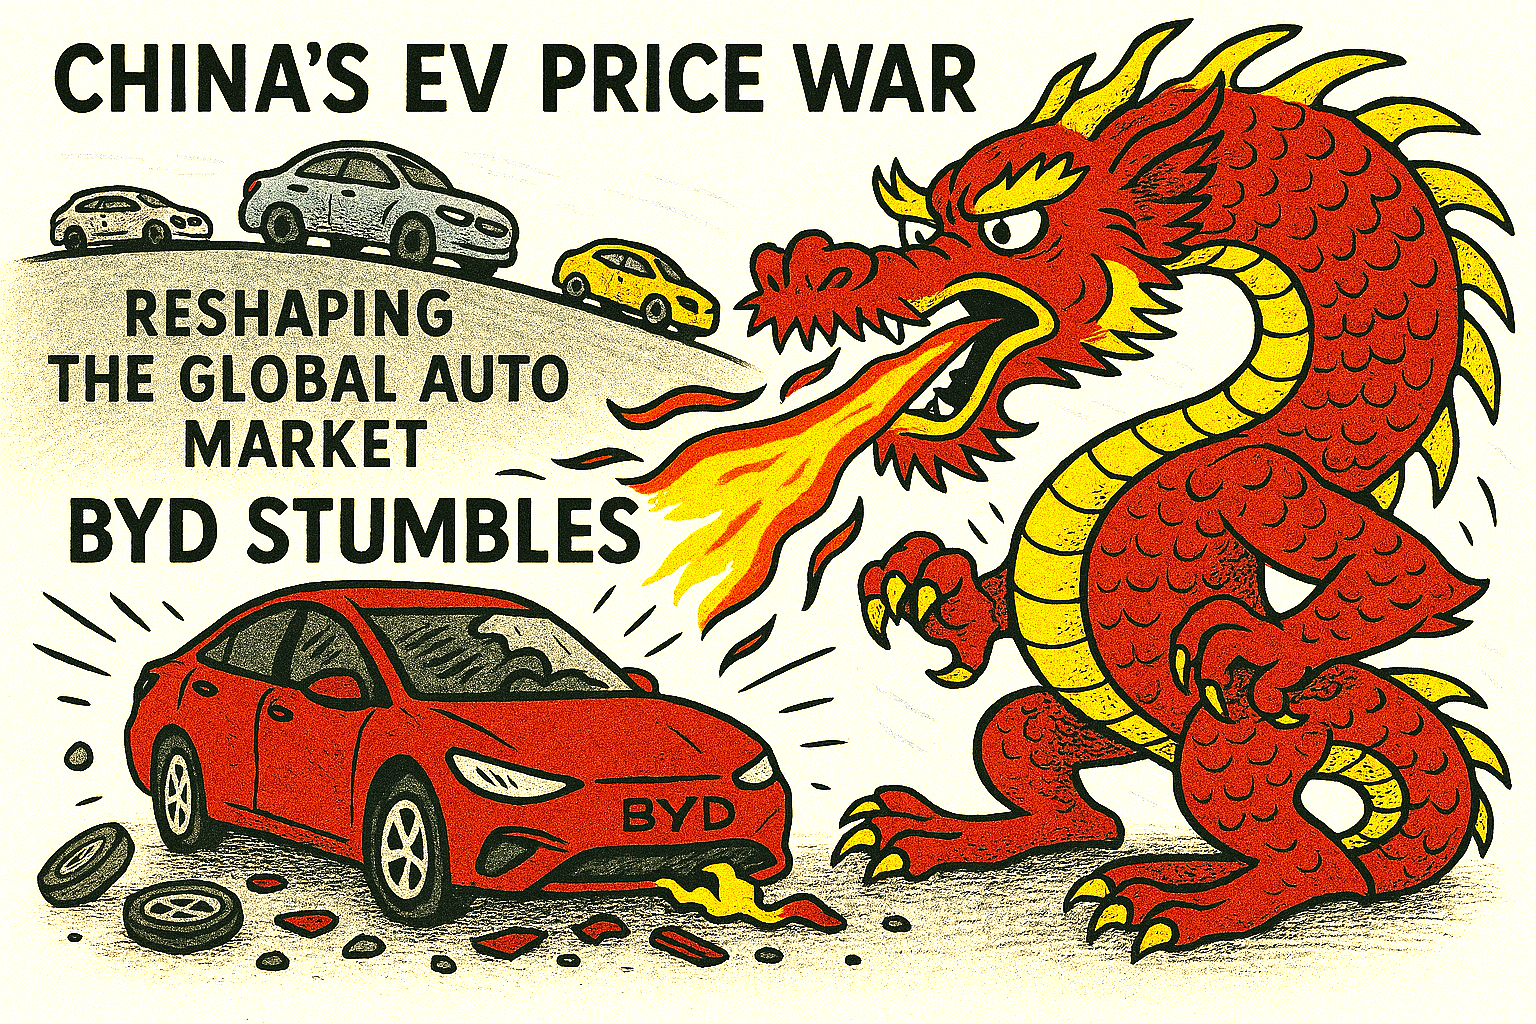
China’s electric vehicle (EV) powerhouse is rewriting the global automotive playbook—but not without homegrown company damage.
BYD, now the world’s largest EV manufacturer by volume, has been caught in the crossfire of a domestic price war.
Damaging price war
The price war is damaging margins. It is unnerving investors and revealing the perils of hyper-competition in the world’s most aggressive car market.
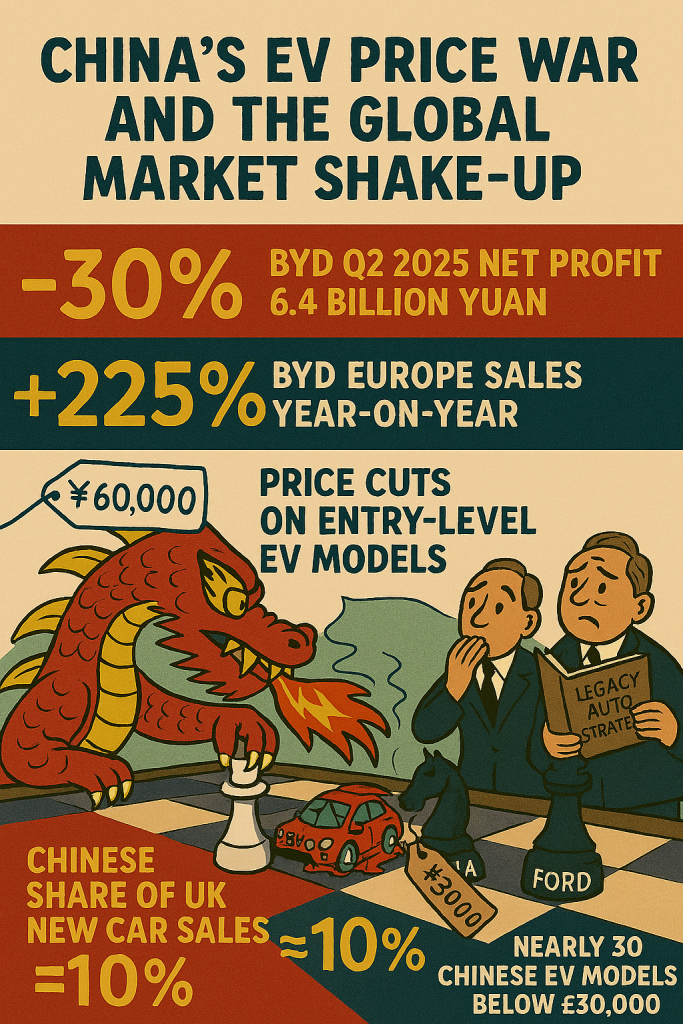
In Q2 2025, BYD posted a 30% drop in net profit to 6.4 billion yuan (£700 million), its first earnings decline in over three years.
Despite a 145% surge in overseas sales, the company’s sweeping discounts across 22 models have eroded profitability at home.
Gross margins slipped to around 16%, and its Hong Kong-listed shares tumbled 8% to a five-month low.
Analysts reportedly now question whether BYD can hit its ambitious 5.5-million-unit sales target, having reached only 45% by July 2025.
The price war, ignited by BYD’s aggressive cuts in May 2025, has forced rivals like Geely, Chery, and SAIC-GM to follow suit. Entry-level EVs now start below (£6,500), with features like driver assistance and smart infotainment once reserved for premium models.
But the race to the bottom has drawn concern from regulators and industry leaders. The China Association of Automobile Manufacturers (CAAM) warned of “disorderly competition”, while executives fear quality compromises and supplier strain.
Yet even as BYD stumbles, the broader Chinese EV machine is gaining global momentum. In Europe, BYD overtook Tesla in July sales, capturing 1.1% market share versus Tesla’s 0.7%.
Chinese EV car brands account for around 10% of new UK car sales
Chinese brands now account for around 10% of new car sales in the UK. There are over 30 affordable EV models priced under £30,000.
Their edge lies in battery supply chains, manufacturing efficiency, and software integration. Transforming cars into ‘smartphones on wheels’ tailored to digitally connected consumers.
China’s EV revolution is no longer just a domestic shake-up—it’s a global reordering. Legacy automakers are retreating from the budget segment. But Chinese firms flooding international markets with sleek, connected, and competitively priced vehicles.
BYD’s profit dip may be a temporary wobble. The long-term trajectory is clear: China isn’t just building cars—it’s building the future of mobility.
For global rivals, the message is unmistakable: adapt, or be outpaced by the dragon’s electric roar.
Infographic: China’s BYD and other EVs
Summary
BYD’s Q2 2025 net profit drop of 30% to 6.4 billion yuan: This figure aligns with recent earnings reports and analyst commentary. The drop is consistent with margin pressure from domestic price cuts.
Gross margin falling to 16.3%: Matches industry estimates for BYD’s automotive segment, which has seen compression due to aggressive discounting.
Overseas sales up 145% YoY: BYD’s international expansion—especially in Europe, Southeast Asia, and Latin America—has been rapid. This growth rate is plausible and supported by export data.
BYD reaching only 45% of its 5.5 million unit sales target by July: This tracks with cumulative delivery figures through mid-year, suggesting a potential shortfall unless H2 volumes accelerate.
Price war triggered by BYD’s cuts across 22 models in May: Confirmed by industry reports and BYD’s own promotional campaigns. Other automakers like Geely and Chery have responded with similar discounts.
CAAM warning of “disorderly competition”: This quote has appeared in official statements and media coverage, reflecting regulatory concern over unsustainable pricing.
Chinese EVs gaining market share in Europe and UK: BYD overtaking Tesla in July 2025 sales in Europe is supported by registration data. Chinese brands now account for ~10% of UK new car sales, with many models priced under £30,000.