Wall Street’s Fear Gauge Surges: What the Spike in Volatility Signals

VIX Fear gauge

Wall Street’s so-called ‘fear gauge’—officially known as the CBOE Volatility Index (VIX)—has surged to its highest level since April 2025, jolting investors out of a months-long lull and reigniting concerns about market stability.

On 14th October 2025, the VIX briefly spiked above 22.9 before settling near 19.70, a sharp rise from recent lows that had hovered below 14.

The VIX is a real-time market index that reflects investors’ expectations for volatility over the next 30 days. Often dubbed the ‘fear gauge’, it’s derived from S&P 500 options pricing and tends to rise when traders seek protection against sharp market declines.

CBOE (VIX Index) slowly creeping up again October 2025 – So called Fear Index

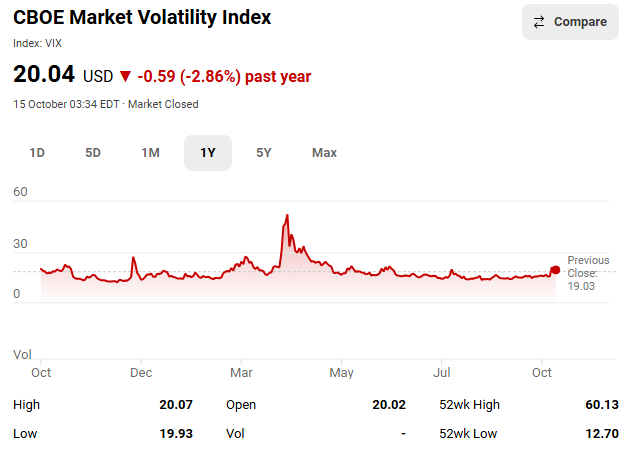
A reading above 20 typically signals heightened anxiety and increased demand for hedging strategies.

This latest spike was triggered by renewed tensions between the U.S. and China, including Beijing’s announcement of sanctions against American subsidiaries of South Korean shipbuilder Hanwha Ocean.

The move, widely seen as retaliation for Washington’s export controls, sent shockwaves through tech-heavy indices. The Dow dropped over 500 points, while the Nasdaq slid nearly 2%.

For months, markets had basked in a rare stretch of calm, buoyed by AI-driven optimism and resilient earnings. But the VIX’s resurgence suggests that investors are now recalibrating their risk assessments.

It’s not just about trade wars—concerns over interest rates, geopolitical instability, and tech sector overvaluation are converging.

While a rising VIX doesn’t guarantee a crash, it often precedes periods of turbulence. For editorial observers, it’s a symbolic pulse check on investor psychology—a reminder that beneath euphoric rallies, fear never fully disappears.

As Wall Street braces for further shocks, the fear gauge is once again flashing caution. Whether it’s a tremor or a tremor before the quake remains to be seen.

Nikkei surges past 48,000 as Japan embraces political shift

Nikkei index surges to record high!

Japan’s benchmark Nikkei 225 index soared past the symbolic 48,000 mark on Monday 6th October 2025 in intraday trading, marking a new all-time high and underscoring investor confidence in the country’s shifting political landscape.

The index closed at 47944.76, up approximately 4.15% from Friday’s session, driven by a wave of optimism surrounding the Liberal Democratic Party’s leadership transition.

Nikkei 225 smashes to new record high October 6th 2025

Sanae Takaichi, a staunch conservative with deep ties to former Prime Minister Shinzo Abe, has emerged as the frontrunner to lead the party—and potentially become Japan’s first female prime minister.

Her pro-growth stance, admiration for Margaret Thatcher, and commitment to industrial revitalisation have sparked hopes of continued economic liberalisation.

The yen weakened boosting export-heavy sectors such as automotive and electronics. Toyota and Sony led the charge, with gains of 5.1% and 4.8% respectively.

Analysts also pointed to easing U.S. bond yields and a rebound on Wall Street as contributing factors.

While the rally reflects renewed market enthusiasm, it also raises questions about Japan’s long-term structural challenges—from demographic decline to mounting public debt.

For now, however, the Nikkei’s ascent offers a potent symbol of investor faith in Japan’s evolving political and economic narrative.

Is the resilient stock market keeping the U.S. economy out of a recession and if so – is that a bad thing?

U.S. recession looming?

The Resilient Stock Market: A Double-Edged Shield Against Recession

In a year marked by political volatility, Trumps tariff war, soft labour data, and persistent inflation anxieties, one pillar of the economy has stood tall: the stock market.

Defying expectations, major indices like the Nasdaq, Dow Jones and S&P 500 have surged, buoyed by AI-driven optimism and industrial strength. This resilience has helped stave off a technical recession—but not without raising deeper concerns about economic fragility and inequality.

At the heart of this phenomenon lies the ‘wealth effect’. As equity portfolios swell, high-net-worth households feel richer and spend more freely.

This consumer activity props up GDP figures and masks underlying weaknesses in wage growth, job creation, and productivity.

August’s economic data showed surprising strength in consumer spending and housing, despite lacklustre employment figures and fading stimulus support.

But here’s the rub: this buoyancy is not broadly shared. According to the University of Michigan’s sentiment index, confidence has declined sharply since January, especially among those without significant stock holdings.

Balance

The U.S. economy, in effect, is being held aloft by a narrow slice of the population—those with the means to benefit from rising asset prices. For everyone else, the recovery feels distant, even illusory.

This divergence creates a dangerous illusion of stability. Policymakers may hesitate to intervene—whether through fiscal support or monetary easing—because headline indicators look healthy. Yet beneath the surface, vulnerabilities abound.

If the market were to correct sharply, the spending it fuels could evaporate overnight, exposing the economy’s dependence on asset inflation.

Moreover, the market’s resilience may be distorting capital allocation. Companies flush with investor cash are prioritising stock buybacks and speculative ventures over wage growth or long-term investment. This can exacerbate inequality and erode the foundations of sustainable growth.

In short, while the stock market’s strength has delayed a recession, it has also deepened the disconnect between Wall Street and Main Street.

The danger lies not in the market’s success, but in mistaking it for economic health. A resilient market may be a shield—but it’s not a cure. And if that shield cracks, the consequences could be swift and severe.

The challenge now is to look beyond the indices and ask harder questions: Who is benefitting? What are we neglecting?

And how do we build an economy that’s resilient not just in numbers, but in substance, regardless of nation.

Wall Street’s euphoric surge sparks warnings of imminent pullback

Wall Street market warning!

Despite a backdrop of economic uncertainty and a partial government shutdown, Wall Street’s three major indices—the S&P 500, Nasdaq Composite, and Dow Jones Industrial Average—closed at record highs on Thursday 2nd October 2025, fuelling concerns that investor confidence may be tipping into excess.

The S&P 500 edged up 0.06%, continuing its relentless climb, while the Nasdaq and Dow Jones followed suit, buoyed by gains in tech giants like Nvidia and Intel.

Nvidia, now the world’s most valuable company, hit an all-time high, and Intel surged over 50% in the past month thanks to strategic partnerships.

Yet beneath the surface of this bullish momentum, market analysts are sounding the alarm. Sector rotation data from the S&P 500 reveals a concentration of capital in high-growth tech and consumer discretionary stocks, suggesting a narrowing rally.

This kind of sector skew often precedes a correction, as it reflects overconfidence in a few outperformers while broader market fundamentals remain shaky.

Triple High, Thin Ice: Wall Street’s record rally masks sector fragility and looming potential pullback

Adding to the unease is the state of the U.S. labour market. Hiring is down 58% year-to-date compared to 2024, marking the lowest level since 2009.

Although the jobless rate remains stable at 4.34%, the Chicago Fed’s indicators reportedly paint a picture of an economy that’s ‘low fire, low hire’—a phrase echoed by Federal Reserve Chair Jerome Powell.

Treasury Secretary Scott Bessent warned that the ongoing government shutdown could dent economic growth, but investors appear unfazed.

Some analysts argue that this detachment from macroeconomic risks reflects a dangerous complacency. Fundstrat even reportedly projected the S&P 500 could reach 7,000 by year-end—a bold forecast that, while technically possible, may hinge more on sentiment than substance.

The Nasdaq’s surge has been particularly pronounced, driven by speculative enthusiasm around AI and semiconductor stocks.

Meanwhile, the Dow Jones, traditionally seen as a bellwether for industrial strength, has benefited from defensive plays and dividend-rich stocks, masking underlying fragilities.

In sum, while Thursday’s triple record close is a milestone worth noting, it may also be a warning sign. With sector gauges flashing ‘excessive’ confidence and economic indicators sending mixed signals, investors would do well to temper their optimism.

A pullback may not be imminent, but it’s certainly plausible—and perhaps overdue.

As the bull charges ahead, the question remains: how long can it run before the bear catches up?

Bleak news from U.S. doesn’t seem that bad for stocks – what’s going on?

Bleak Headlines vs. Market Optimism

It’s one of those classic Wall Street paradoxes—where bad news somehow fuels bullish momentum. What’s going on?

News round-up

S&P 500 closes above 6,700 after rising 0.34%. Samsung and SK Hynix join OpenAI’s Stargate. Taiwan rejects U.S. proposal to split chip production. Trump-linked crypto firm plans expansion. Some stocks that doubled in the third quarter.

Bleak Headlines vs. Market Optimism

U.S. Government Shutdown: The federal government ground to a halt, but markets didn’t flinch. In fact, the S&P 500 rose 0.34% and closed above 6,700 for the first time.

ADP Jobs Miss: Private payrolls fell by 32,000 in September 2025, a sharp miss – at least compared to the expected 45,000 gain. Yet traders shrugged it off as other bad news is shrugged off too!

Fed Rate Cut Hopes: Weak data often fuels expectations that the Federal Reserve will cut interest rates. Traders are now betting on a possible cut in October 2025, which tends to boost equities.

Historical Pattern: According to Bank of America, the S&P 500 typically rises ~1% in the week before and after a government shutdown. So, this isn’t unprecedented—it’s almost ritualistic at this point.

Why the Market’s Mood Diverges

Animal Spirits: Investors often trade on sentiment and positioning, not just fundamentals. If they believe the Fed will ease policy, they’ll buy risk assets—even in the face of grim news.

Data Gaps: With the Bureau of Labor Statistics’ official jobs report delayed due to the shutdown, the ADP report gains more weight. But it’s historically less reliable, so traders may discount it.

Tech Tailwinds: AI stocks and semiconductor news (e.g., Samsung and SK Hynix joining OpenAI’s Stargate) are buoying sentiment, especially in Asia-Pacific markets.

U.S. Government Shutdown October 2025

Prediction

Traders in prediction markets are betting the shutdown will last around two weeks. Nothing too radical, since that’s the average length it takes for the government to reopen, based on data going back to 1990.

The government stoppage isn’t putting the brakes on the stock market momentum. Are investors getting too adventurous?

History shows the pattern is not new. The S&P 500 has risen an average of 1% the week before and after a shutdown, according to data from BofA.

Even the ADP jobs report, which missed expectations by a wide margin, did little to subdue the animal spirits.

Private payrolls declined by 32,000 in September 2025, according to ADP, compared with a 45,000 increase reportedly estimated by a survey of economists.

Payroll data

The Bureau of Labor Statistics’ (BLS) official nonfarm payrolls report is now stuck in bureaucratic purgatory and likely not being released on time.

The U.S. Federal Reserve might place additional weight on the ADP report — though it’s not always moved in sync with the BLS numbers. Traders expect weak data would prompt the Fed to cut interest rates in October 2025.

It’s a bit like watching a storm roll in while the crowd cheers for sunshine—markets are forward-looking, and sometimes they see silver linings where others see clouds.

Summary

EventDetail
🏛️ Government ShutdownBegan Oct 1, 2025. Traders expect ~2 weeks based on historical average
📉 ADP Jobs ReportPrivate payrolls fell by 32,000 vs. expected +45,000
📈 S&P 500 CloseRose 0.34% to close above 6,700 for the first time
💸 Fed Rate Cut ExpectationsTraders now pricing in a possible October cut

Is Wall Street more fixated on Nvidia’s success than the potential failure of the Fed – the Fed needs to maintain independence?

Nvidia, Wall Street and the Fed

As Nvidia prepares to unveil another round of blockbuster earnings, Wall Street’s gaze remains firmly fixed on the AI darling’s ascent.

The company has become a proxy for the entire tech sector’s hopes, its valuation ballooning on the back of generative AI hype and data centre demand. Traders, analysts, and even pension funds are treating Nvidia’s quarterly results as a bellwether for market sentiment.

But while the Street pops champagne over GPU margins, a quieter and arguably more consequential drama is unfolding in Washington: The Federal Reserve’s independence is under threat.

Recent political manoeuvres—including calls to fire Fed Governor Lisa Cook and reshape the Board’s composition—have raised alarm bells among economists and institutional investors.

The Fed’s ability to set interest rates free from partisan pressure is a cornerstone of global financial stability. Undermining that autonomy could rattle bond markets, distort inflation expectations, and erode trust in the dollar itself.

Yet, the disparity in attention is striking. Nvidia’s earnings dominate headlines, while the Fed’s institutional integrity is relegated to op-eds and academic panels.

Why? In part, it’s the immediacy of Nvidia’s impact—its share price moves billions in minutes.

The Fed’s erosion, by contrast, is a slow burn, harder to quantify and easier to ignore until it’s too late.

Wall Street may be betting that the Fed will weather the political storm. But if central bank independence falters, even Nvidia’s stellar performance won’t shield markets from the fallout.

The real risk isn’t missing an earnings beat—it’s losing the referee in the game of monetary policy.

In the end, Nvidia may be the star of the show, but the Fed is the stage. And if the stage collapses, the spotlight won’t save anyone.

The bubble that thinks: Sam Altman’s AI paradox

AI Bubble?

Sam Altman, CEO of OpenAI, has never been shy about bold predictions. But his latest remarks strike a curious chord reportedly saying: ‘Yes, we’re in an AI bubble’.

‘And yes, AI is the most important thing to happen in a very long time’. It’s a paradox that feels almost ‘Altmanesque’—equal parts caution and conviction, like a person warning of a storm while building a lighthouse.

Altman’s reported bubble talk isn’t just market-speak. It’s a philosophical hedge against the frothy exuberance that’s gripped Silicon Valley and Wall Street alike.

With AI valuations soaring past dot-com levels, and retail investors piling into AI-branded crypto tokens and meme stocks, the signs of speculative mania are hard to ignore.

Even ChatGPT, OpenAI’s flagship product, boasts 1.5 billion monthly users—but fewer than 1% pay for it. That’s not a business model—it’s a popularity contest.

Yet Altman isn’t calling for a crash. He’s calling for clarity. His point is that bubbles form around kernels of truth—and AI’s kernel is enormous.

From autonomous agents to enterprise integration in law, medicine, and finance, the technology is reshaping workflows faster than regulators can blink.

Microsoft and Nvidia are pouring billions into infrastructure, not because they’re chasing hype, but because they see utility. Real utility.

Still, Altman’s warning is timely. The AI gold rush has spawned a legion of startups with dazzling demos and dismal revenue. This is likely the Dotcom ‘Esque’ reality – many will fail.

Many are burning cash at unsustainable rates, betting on future breakthroughs that may never materialise. Investors, Altman suggests, need to recalibrate—not abandon ship, but stop treating every chatbot as the next Google.

What makes Altman’s stance compelling is its duality. He’s not a doomsayer, nor a blind optimist. He’s a realist who understands that transformative tech often arrives wrapped in irrational exuberance. The internet had its crash before it changed the world. AI may follow suit.

So, is this a bubble? Yes. But it’s a bubble with brains. And if Altman’s lighthouse holds, it might just guide us through the fog—not to safety, but to something truly revolutionary.

In the meantime, investors would do well to remember hype inflates, but only utility sustains.

And Altman, ever the ‘paradoxical prophet’, seems to be betting on both.

Echoes of Dot-Com? Is AI tech leading us into another crash?

Is Wall Street AI tech in a bubble?

Wall Street is soaring on artificial intelligence optimism—but underneath the record-breaking highs lies a growing sense of déjà vu.

From stretched valuations and speculative fervour to market concentration reminiscent of the dot-com era, financial analysts and institutional veterans are asking: are we already inside a tech bubble?

Valuations Defying Gravity

At the heart of the rally are the so-called ‘Magnificent Seven’—mega-cap tech firms like Nvidia, Microsoft, Apple and Alphabet—whose forward price-to-earnings ratios have now surpassed even the frothiest moments of the 1999–2001 bubble.

Apollo Global strategist Torsten Slok has reportedly warned that current AI-driven valuations are more ‘stretched’ than ever, citing metrics that exceed dot-com records in both scale and speed.

Nvidia and Microsoft now sit atop the S&P 500 with a combined market cap north of $8 trillion. Yet much of this valuation is being driven by expected future profits—not current ones.

Bulls argue the fundamentals are stronger this time, but even they admit this rally is fragile and increasingly top-heavy.

A Narrow Rally, Broad Exposure

While the S&P 500 has reached historic highs, the gains are increasingly concentrated among just 10 companies—accounting for nearly 40% of the index’s value.

The remaining 490 firms are moving sideways, or not at all. Bank of America’s Michael Hartnett calls it the ‘biggest retail-led rally in history’, pointing to looser trading rules and margin exposure pulling everyday investors into risky tech plays.

In policy circles, reforms allowing private equity in retirement accounts and easing restrictions on day trading are amplifying volatility.

The Trump administration’s push to deregulate retail trading could worsen systemic fragility if investor sentiment turns.

Signs of Speculation

Meme stocks and penny shares are surging again. Cryptocurrency-adjacent firms are issuing AI-branded tokens.

Goldman Sachs indicators show speculative trading activity at levels only previously seen in 2000 and 2021. Yet merger activity remains robust, and consumer spending is strong—two counterweights that bulls cite as proof the rally may be sustained.

The Core Debate: Hype vs. Reality

Is AI the new internet—or just another tech bubble? It does seem to carry more utility than the early days of the internet did?

  • The Bubble View: Today’s valuations are divorced from earnings reality, driven by retail exuberance and algorithmic momentum rather than solid fundamentals.
  • The Bullish Case: Unlike the dot-com era, many of today’s tech firms are cash-rich, profitable, and genuinely transforming industry workflows.

Wells Fargo’s Chris Harvey reportedly believes the S&P 500 could hit 7,007 by year-end—driven by strong margins in tech and corporate earnings resilience.

But even he acknowledges risks if the AI hype fails to materialise into sustainable profit flows.

Bottom Line

Wall Street may be on the brink of another rebalancing moment. Whether this rally evolves into a crash, correction, pullback or a paradigm shift could depend on investor patience, regulatory restraint—and whether tech firms can actually deliver the future they’re pricing in.

That is the real question!

Wall Street surges: S&P 500 breaks 6300 as tech optimism outpaces tariff tensions

Record highs!

The S&P 500 closed above 6,300 for the first time in history on Monday 21st July 2025, while the Nasdaq Composite notched yet another record, finishing at 20,974.17.

Investor enthusiasm for upcoming tech earnings has eclipsed broader concerns over looming global tariffs, fuelling a rally in major indexes.

Despite marginal losses in the Dow Jones Industrial Average, the tech-heavy Nasdaq rose 0.38% while the S&P 500 climbed 0.14%, buoyed by gains in heavyweights like Meta Platforms, Alphabet, and Amazon.

With over 60 S&P 500 companies having reported so far this earnings season, more than 85% have exceeded expectations, according to FactSet.

S&P 500 and Nasdaq Comp at new record highs 21st July 2025

redo the charts side by side and correct the S&P 500 value
S&P 500 and Nasdaq Comp at new record highs 21st July 2025

Alphabet shares advanced over 2% ahead of Wednesday’s results, and Tesla headlines the ‘Magnificent Seven’ group expected to drive the bulk of earnings growth this quarter. And not necessarily for the right reason.

Analysts reportedly expect the group to deliver 14% growth year-on-year, far outpacing the remaining S&P constituents’ average of 3.4%.

S&P 500

Despite tariff tensions simmering — with the U.S. setting a 1st August deadline for levy enforcement — investor sentiment remains bullish.

Bank of America estimates Q2 earnings are tracking a 5% annual increase, suggesting resilience amid geopolitical headwinds.

Strategists warn of potential volatility, as earnings surprises or policy shifts could spark swift market reactions.

Still, some analysts see space for further upside, projecting a potential S&P climb to 6,600 before any meaningful pullback.

As the tech titans prepare to report, all eyes are on whether optimism can keep the rally alive — or if tariffs will return to centre stage.

From FANG stocks, MAG 7 stocks to AI – the tech titans just keep giving.

But when will it overload?

S&P 500 and Nasdaq close at new records again as Fed cuts rates

U.S> stocks up

More new records set in extended U.S. post-election rally

The S&P 500 and Nasdaq climbed on Thursday 7th November 2024, extending the rally following the victory of President-elect Donald Trump, while traders considered the implications of the Federal Reserve’s recent rate reduction.

The S&P 500 rose to close at an all-time high of 5,973.10, while the Nasdaq Composite increased by to end at 19,269.46, marking its first finish above 19,000.

The Dow Jones Industrial Average remained virtually unchanged, dipping slightly by less than one point to 43,729.34. During the trading session, all three indices reached new intraday highs.

Following President Trump’s electoral victory, the stock market experienced a significant rally on Wednesday 6th November 2024, with the Dow soaring by 1,500 points. The S&P 500 surged recording its best post-election day performance ever.

Post-election, the bond market has seen considerable fluctuations, with Treasury yields declining on Thursday after a sharp increase the previous day.

China stocks drop after trade data disappoints Hang Seng falling 4%

China stocks drop

Chinese stocks declined on Tuesday 15th October 2024, contrasting with the broader gains in other Asia markets, which followed record highs reached by the Dow Jones Industrial Average and the S&P 500 on Wall Street

The CSI 300 index in Mainland China fell to close at 3,855.99, and the Hang Seng index in Hong Kong decreased by 3.67% to finish at 20,318.79.

After the markets closed on Monday 14th October 2024, China reported disappointing trade figures for September 2024, with exports increasing by only 2.4% from the previous year and imports rising a mere 0.3%, both significantly below expectations.

China CSI 300 index one-day chart

China CSI 300 index one-day chart as of 15th October 2024

The Dow closed 650 points higher Friday 26th July 2024 – lifted by a positive inflation data

U.S. stock charts and flag

On Friday 26th July 2024, U.S. stocks surged, and Wall Street concluded a volatile week on an upbeat note as investors considered the latest U.S. inflation data.

The Dow Jones Industrial Average soared 654 points to settle at 40589. The S&P 500 climbed to 5459 while the Nasdaq Composite advanced around 1% to close at 17357.

Dow Jones as at: 26th July 2024 – one day chart

Dow Jones as at: 26th July 2024 – one day chart

The upward movement was attributed to a mix of oversold conditions, a U.S. GDP report on Thursday 25th July 2024 that exceeded expectations, and the anticipation that the Federal Reserve will start reducing rates in response to the economy’s demonstrated resilience.

Japan’s Nikkei blast through 42000 to reach all-time high

Nikkei Lift Off!

Japan’s Nikkei 225 surpassed the 42,000 threshold for the first time ever during a widespread increase in Asia-Pacific markets on Thursday 11th July 2024.

This surge followed a rally in U.S. Big Tech stocks, fueled by optimism over a potential Federal Reserve rate cut moving ever closer.

The Nikkei climbed almost 1% to close at 42,224 driven by gains in technology shares, while the comprehensive Topix index advanced to finish at 2,929.

Nikkei index

Bad economic news can be good for stocks

Bad news and good news

Bad economic news appears to have had an interesting impact on the stock market recently.

Traditionally, negative economic data might be anticipated to result in falling stock prices; however, recent trends have diverged from this norm.

News trend

In the past two months, negative economic news has had a paradoxically positive effect on equities. Investors have responded well to poor economic indicators, partly due to the belief that these could lead the Federal Reserve to begin reducing interest rates.

Dollar and the stock market

In recent times, the S&P 500, a large-cap equity index, and the U.S. dollar have exhibited a nearly perfect correlation. As the dollar has seen a gradual decline, the stock market has conversely experienced a rise. Typically, investors flock to the security of cash, and consequently the dollar, in times of uncertainty, yet they also channel investments into stocks upon the arrival of favourable news.

Economic data

Despite the upbeat trend in the stock market, real economic data has frequently fallen short of Wall Street’s predictions. The Citi Economic Surprise Index, a gauge that compares data to expectations, has been on a downward trajectory. This suggests that expectations have been surpassing the actual economic conditions, signalling that the economic situation may not be as favorable as previously thought.

Dilemma for the Fed

The Federal Reserve methodically reviews economic indicators to influence their interest rate decisions. Typically, unfavorable economic reports might prompt the Fed to reduce rates, unless there’s an uptick in inflation. Escalating inflation generally nudges the Fed towards a tighter monetary policy.

Monthly data roll-out

Data concerning the U.S. labour market presented to the Fed and markets may create that ‘pivotal’ moment – it often does – markets move of Fed comments and ‘awaited’ news. Reports detailing job openings, private sector job creation, and the Bureau of Labour Statistics’ nonfarm payrolls will shed light on the economy’s condition.

If job growth remains within the ‘Goldilocks range’ (neither too strong nor too weak), it may preserve the fragile equilibrium where unfavourable economic news has paradoxically favoured stock prices, while preventing excessive gloom.

Conclusion

To summarize, although adverse economic news has lately been advantageous for stock markets, monitoring this precarious balance is crucial. Excessive pessimism could be a harbinger of impending difficulties, despite its current benefits.

Note about Citigroup Economic Surprise Index

The Citigroup Economic Surprise Index is the sum of the difference between the actual value of various economic data and their consensus forecast. If the index is greater than zero, it means that the overall economic performance is generally better than expected, and the S&P 500 has a high probability of strengthening, and vice versa.

Is the fight against inflation failing – or does it get much harder towards the end?

Stubborn inflation

Is progress on U.S. inflation stalling?

That’s the fear spreading through Wall Street as another inflation reading on Friday 16th February 2024 came in hotter-than-expected.  

The producer price index rose 0.3% in January 2024. The largest increase since August 2024 and higher than the 0.1% forecast. Excluding food and energy, core PPI jumped 0.5%, again well above consensus.

Stubborn

It is yet another sign of stubborn price pressures across the broader U.S. economy. And it came just days after an unexpectedly hot CPI reading, which gave markets a nasty jolt.  

Both data have stoked investor worries on whether inflation is firmly under control. The latest developments also reinforce the Fed’s caution that it will need to see more evidence of disinflation before committing to lower rates.

Mohamed El-Erian, Allianz chief economic advisor, posted on X that like the CPI data, the PPI report was a further indication that the last mile of the inflation battle is more complex than many had assumed (and still assume).

Some economists even argue the jump in Friday’s data will likely push January’s personal consumption expenditures price index, the Fed’s preferred inflation gauge.

The PPI data means we can finalise our core PCE forecast for January, at 0.32%. That would be the biggest increase since September. But the three months since then all saw much smaller gains.

But investors will have to wait until later this month for PCE data when it’s released on 29th February 2024.

Microsoft and Alphabet report good numbers but Nasdaq slides.

Stocks

Nasdaq 100 futures declined around 0.75%. S&P 500 futures were also down around 0.4%

In after-hours trading, shares of Alphabet dropped more than 5%, while Microsoft slipped 2% after the tech giants, part of the Magnificent Seven posted quarterly earnings. However, both companies achieved on both top and bottom lines. However, advertising revenue for Alphabet came short of analysts’ expectations. 

Tech powerhouse

The tech sector powered the market rally from 2023 into 2024 and is now trading at a relatively high valuation of nearly 29 times its 2024 earnings, according to recent figures. Investors will need to see earnings expansion in order for the tech companies to be able to maintain their elevated levels.

Results were good but not good enough according to Wall Street as stocks were priced for perfection and that wasn’t delivered.

Even though the results were better-than-expected, investors are likely selling because they just want to take some money off the table.

Absolute perfection comes at a price on Wall Street.

The U.S. GDP up in Q4 as economy grew at a 3.3%

U.S. GDP

The U.S. economy grew at a much faster pace than expected in the final three months of 2023.

The U.S. easily avoided a recession that many had forecast as inevitable, the U.S. Commerce Department reported Thursday 25th January 2024.

Gross domestic product (GDP), a measure of all the goods and services produced, increased at a 3.3% annualised rate in the final quarter of 2023, according to data from the Commerce Department.

Wall Street consensus was for a figure of 2%.

U.S. BEA Bureau of Economic Analysis

Bureau of Economic Analysis

Sudden sell-off confounds analysts – is it profit taking or economic woe?

Wall Street

The Nasdaq and Dow hit new all-time highs in recent days and the S&P 500 is hot on their heels.

After nine straight days of gains, Wall Street suddenly reversed an hour and a half before the closing bell on Wednesday 20th December 2023.

The sell-off expanded into Asia overnight, with Japan’s Nikkei 225 leading losses, before stocks across Europe also slid into the red on the Thursday morning, 21st December 2023.

Some indicated Wednesday’s sell-off was as simple as investors taking profits after a nine-day mini bull run, in the absence of any obvious catalyst and with U.S. stocks widely seen as overbought.

Other market analysts pointed to a high volume of zero-day options trading as the death knell for the winning streak.

Time left for a Santa rally?

Markets have been on a tear in recent eeks and months, maybe it’s time for a breather. But some suggest U.S. equities are overbought in general – so, is this something more discerning?

Dow drops to 33000!

Dow Jones Industrial Average (Dow) performance on 3rd October 2023.

The Dow fell more than 400 points, turning negative for the year. The main reason for the drop was the surge in U.S. Treasury yields, which reached their highest levels in 16 years.

Higher yields mean higher borrowing costs for businesses and consumers, which could hurt the economic recovery and the housing market.

S&P 500 on 3rd October 2023

Nasdaq on 3rd October 2023

The tech-heavy Nasdaq Composite gained a 0.7% on October 3rd, 2023, as some investors saw an opportunity to buy some of the high-growth stocks that had been under pressure recently.

Meta (Facebook) Posts Strong Wall Street Gain in 2023 – its year of efficiency

UK taxes high!

Meta Platforms, Inc. (Nasdaq: META), formerly known as Facebook, has seen its stock price soar in 2023, a straight nine month gain in a massive turnaround after a dismal performance in 2022. 

Meta is the parent company of social media apps such as Facebook, Instagram, WhatsApp and Messenger, as well as the Oculus VR headset and other ventures.

Year of efficiency

Meta’s founder and CEO Mark Zuckerberg has declared 2023 as the ‘Year of Efficiency‘ for the company, as it tries to cut costs and streamline its operations. The company has also announced layoffs of about 10% of its workforce in 2022 and 2023, as part of its restructuring efforts.

Meta’s stock has almost doubled since January, making it among the top performers on the S&P 500. The company has also seen a boost in the number of daily active users on Facebook, reaching two billion as of the end of December 2022. Meta’s net worth is currently at $89.9 billion, making Zuckerberg the 12th wealthiest person on the planet, according to Bloomberg’s Billionaire Index.

Surge

Meta’s stock surge comes after a sharp decline in 2022, when the company faced regulatory scrutiny, public backlash and technical glitches over its plans to expand into the metaverse, a virtual reality world where people can interact with each other and through digital content. 

Meta’s stock plummeted by over 60% last year, as Zuckerberg struggled to sell Wall Street on his vision for the future of social media.

Future

Meta is still betting on the metaverse as its long-term goal, and has been investing heavily in AI, VR and AR technologies. The company is reportedly working on a new social media app called ‘Instagram for your thoughts‘, which would allow users to share their thoughts and emotions using brain-computer interfaces. 

The app could launch as soon as next month, according to latest reports.

The metaverse is coming!