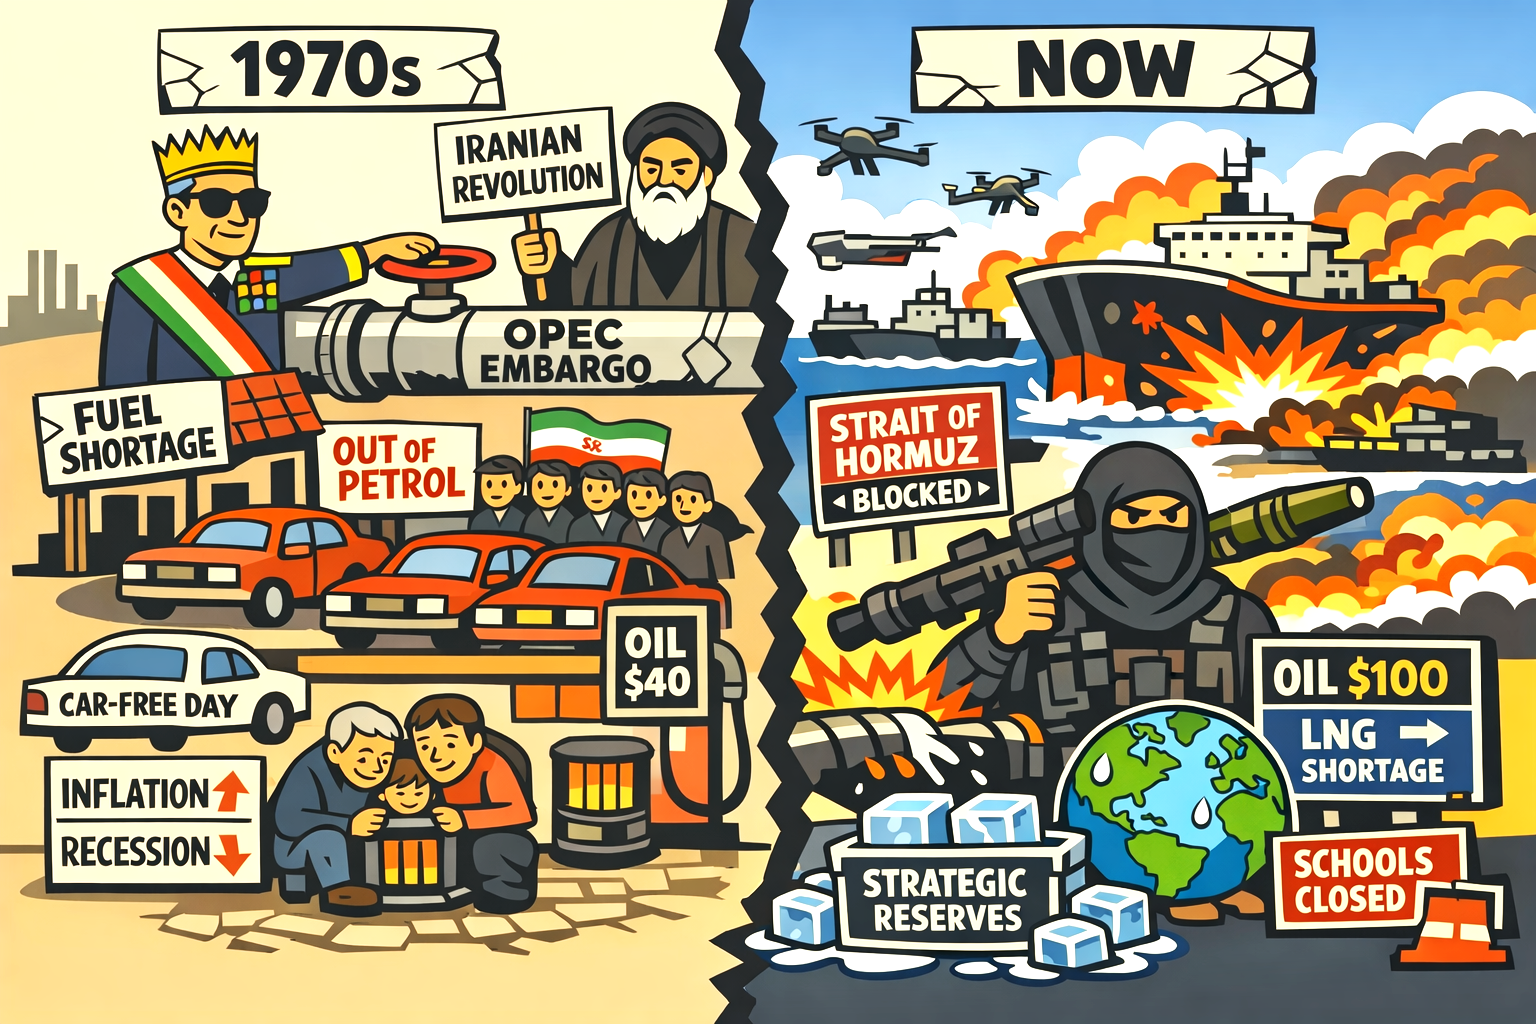
The 1970s crises were triggered by political embargoes and revolution, causing sharp but smaller supply cuts and extreme price spikes.
Today’s crisis is driven by war, infrastructure attacks, and the near‑closure of the Strait of Hormuz, producing a larger supply disruption, though price rises so far have been less extreme.
Energy shock
The energy shocks of the 1970s remain some of the most disruptive economic events of the modern age. Triggered first by an embargo and later by revolution, they exposed how deeply the global economy depended on Middle Eastern oil.
Half a century later, Iran still sits at the centre of global energy anxiety — but the nature of the threat has shifted.
The world is no longer facing an outright supply collapse, yet the structural vulnerabilities that defined the 1970s have not disappeared. They have simply evolved.
Yom Kippur War
The first major shock came in 1973, when Arab oil producers cut exports to countries supporting Israel during the Yom Kippur War.
The result was a sudden loss of roughly seven per cent of global supply. Prices quadrupled, queues formed at petrol stations, and governments imposed rationing, car‑free days, and speed‑limit reductions.
The economic fallout was severe: inflation surged while growth stalled, creating the era‑defining condition of stagflation.
A second blow followed in 1979, when the Iranian Revolution removed millions of barrels per day from the market. Prices tripled once again, and the world was forced to confront the fragility of its energy systems.
IEA
The International Energy Agency was created in direct response, tasked with coordinating emergency measures and strategic reserves.
These two crises set the benchmark for what an energy shock looks like — sudden, sharp, and globally destabilising.
Today’s risks are different. The world is not experiencing a supply loss on the scale of the 1970s, but the potential for disruption remains high.
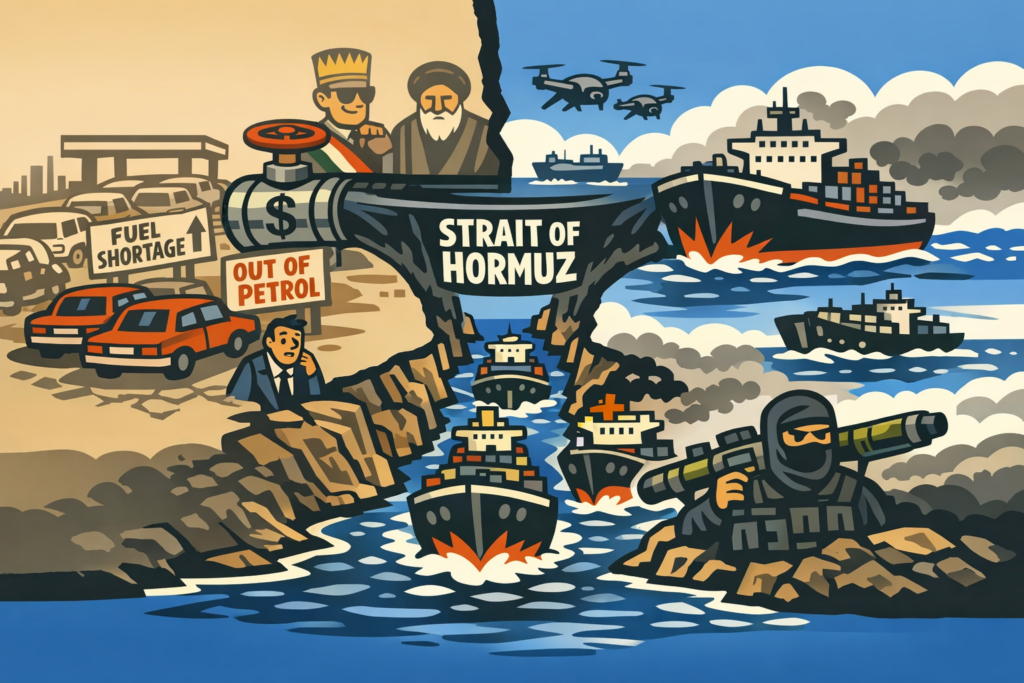
Strait of Hormuz
The Strait of Hormuz, through which around a fifth of global oil flows, is a strategic chokepoint vulnerable to conflict, tanker seizures, and infrastructure attacks.
Iran has repeatedly threatened to close or disrupt the strait during periods of tension, and even limited incidents in recent years have pushed prices higher.
Markets remain acutely sensitive to any sign that the corridor could be compromised.
Diverse energy
Unlike the 1970s, modern economies have more diversified energy systems, larger strategic reserves, and a growing share of renewables.
Yet these advantages do not eliminate risk; they merely soften it. A serious disruption in the Gulf would still send shockwaves through global markets.
The comparison between then and now is not one of scale but of structure. The 1970s showed how quickly energy can become a lever of geopolitical power.
Today’s world is more resilient, but no less exposed. The lesson endures: when a single region holds the key to global supply, the world remains only one crisis away from another shock.
We also need to ask – how and why this happened again!
What’s your answer?
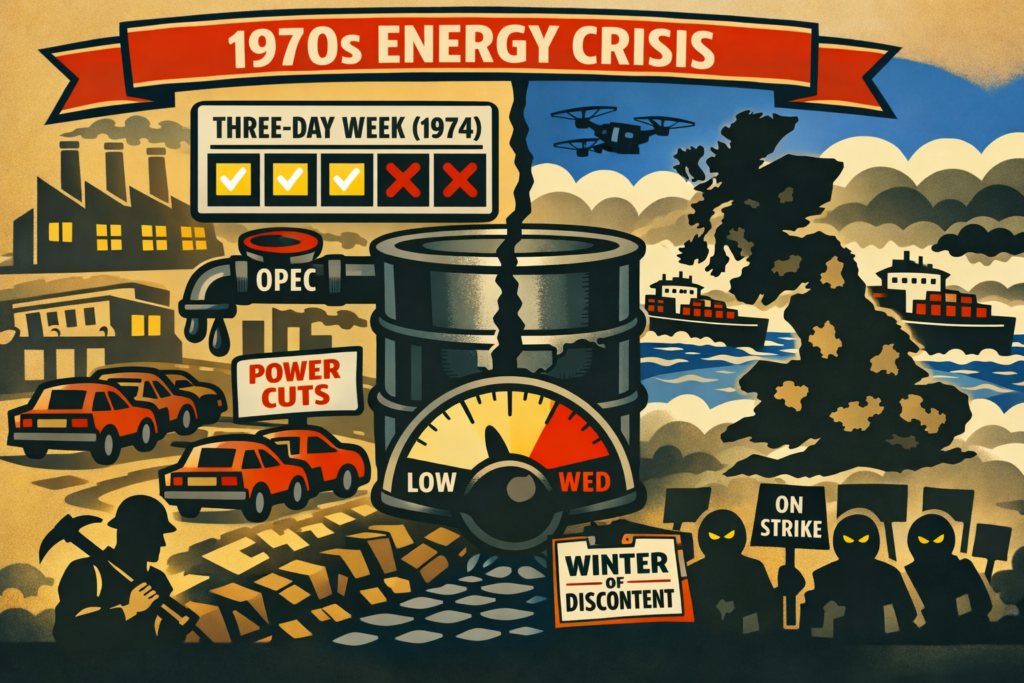
How the crises affected the UK in the 1970s
The 1970s energy crisis had a profound and lasting impact on the United Kingdom, reshaping its economy, politics, and industrial relations.
When global oil prices quadrupled after the 1973 OPEC embargo, Britain was already struggling with domestic energy tensions.
Coal remained the backbone of electricity generation, and the miners’ dispute with Edward Heath’s government over pay and working conditions collided with the global fuel shock.
As coal output fell and oil costs soared, the government-imposed emergency measures — most famously the Three‑Day Week in early 1974, limiting commercial electricity use to conserve power. It led to the Winter of Discontent.
Power Cuts
Factories shut down, television broadcasts ended early, and households faced rolling power cuts. Inflation surged, unemployment rose, and the economy slowed sharply.
The crisis deepened public frustration with the Conservative government, contributing to Heath’s defeat in the February 1974 general election.
Trade Union Turmoil
The turmoil also strengthened trade unions, whose strikes became a defining feature of the decade.
By the late 1970s, another oil shock — triggered by the Iranian Revolution — compounded Britain’s economic malaise, leading to the “Winter of Discontent” and paving the way for Margaret Thatcher’s election in 1979.
In short, the 1970s energy crisis exposed Britain’s dependence on imported fuel and unstable domestic supply, ushering in years of inflation, industrial unrest, and political upheaval that reshaped the country’s economic direction for decades.