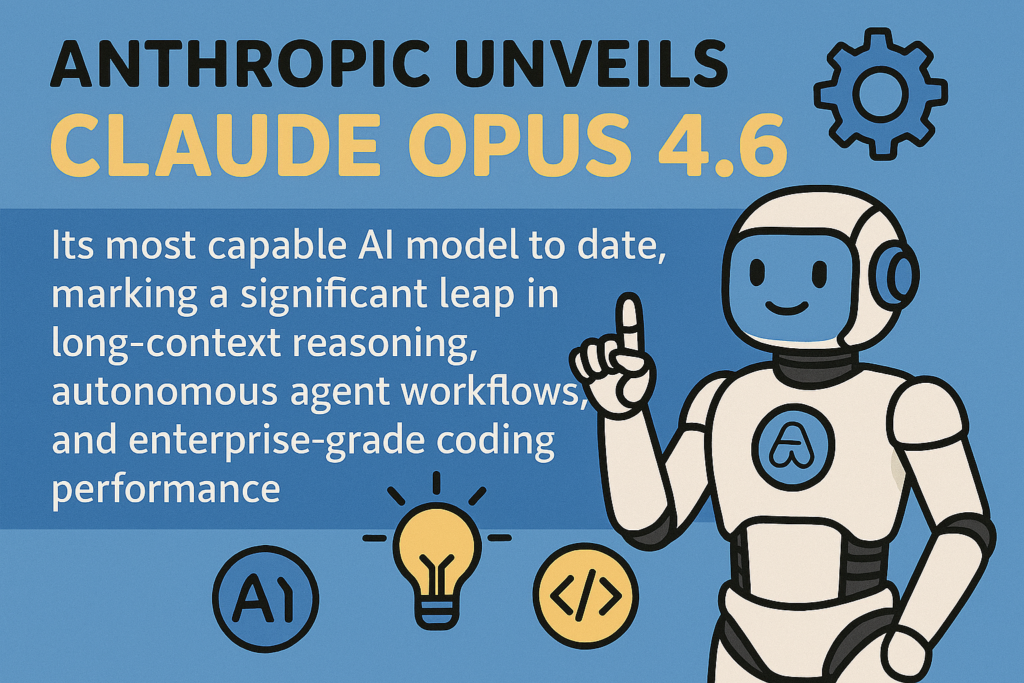
Anthropic has unveiled Claude Opus 4.6, its most capable AI model to date, marking a significant leap in long‑context reasoning, autonomous agent workflows, and enterprise‑grade coding performance.
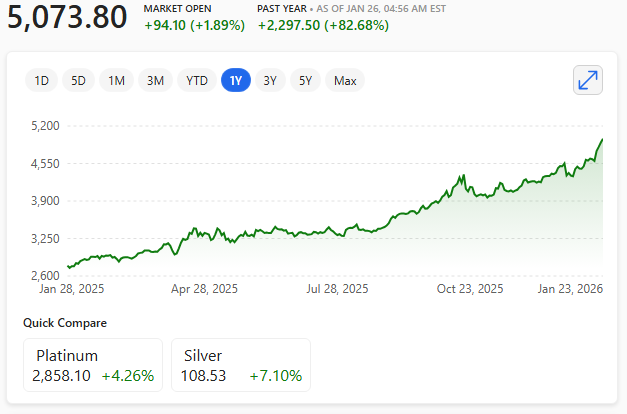
The release arrives during a turbulent moment for the global software sector, with markets reacting sharply to fears that Anthropic’s accelerating capabilities could reshape entire categories of knowledge work.
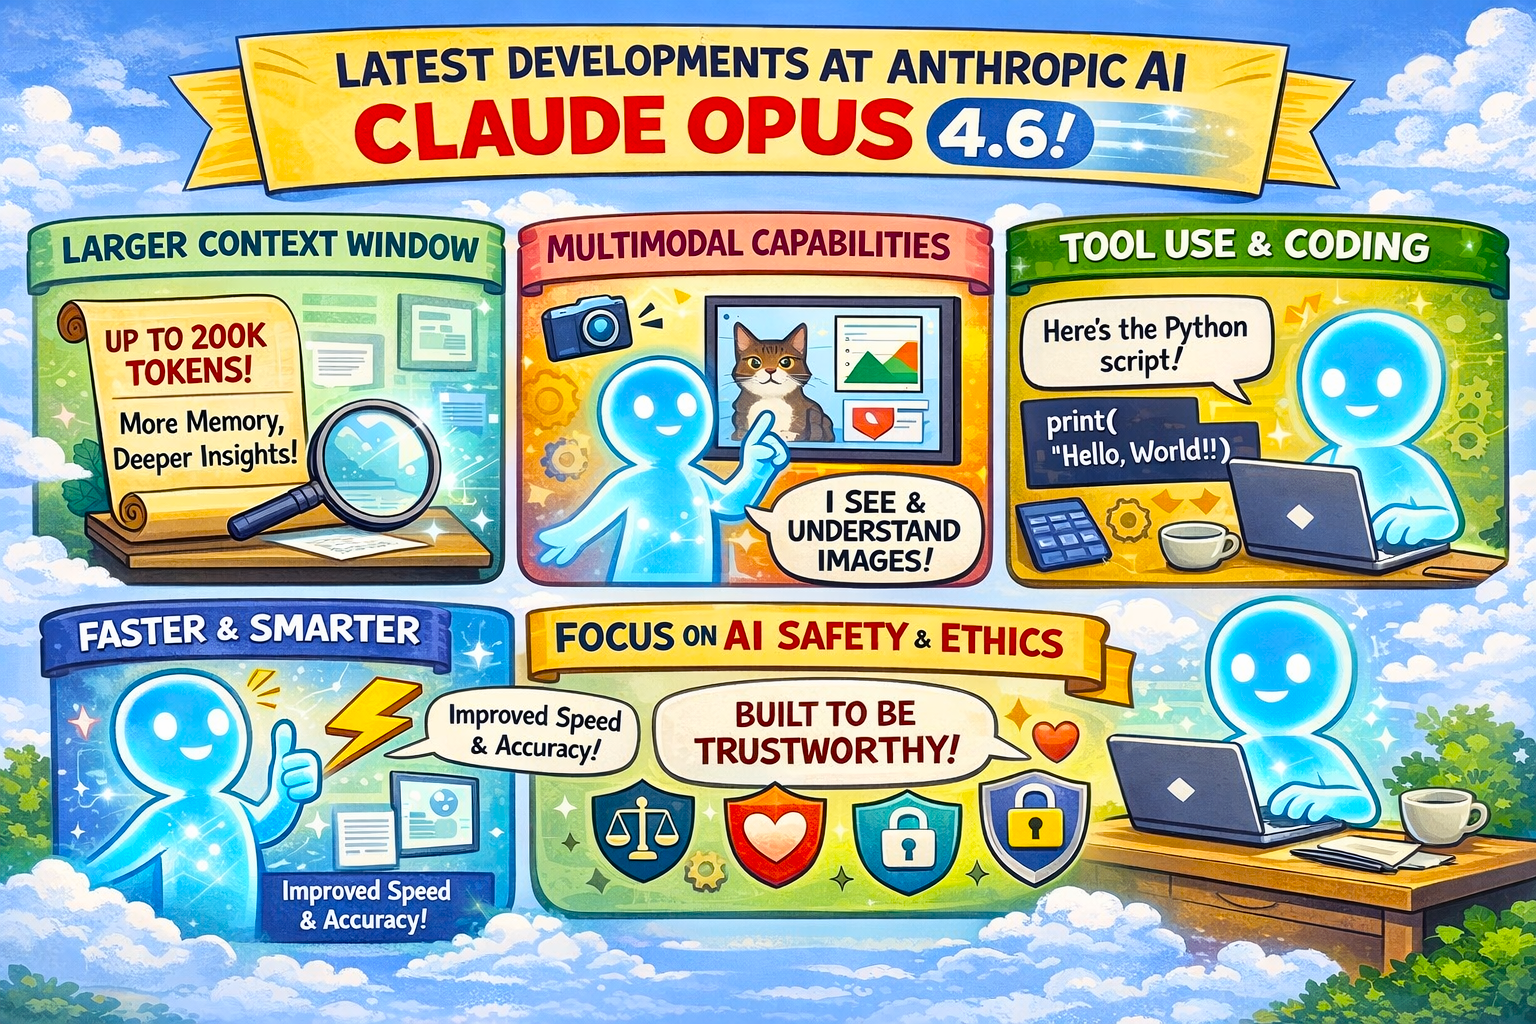
At the heart of Opus 4.6 is a 1‑million‑token context window, a first for Anthropic’s Opus line and a direct response to long‑standing limitations around ‘context rot’ in extended tasks.
Benchmarks
Early benchmarks show a dramatic improvement in maintaining accuracy across vast documents and complex, multi‑step workflows.
This expanded capacity enables the model to analyse large codebases, regulatory filings, or research archives in a single pass—an ability already drawing interest from enterprise users.
Perhaps the most striking development is Anthropic’s progress in agentic systems. Claude Code and the company’s Cowork framework now support coordinated ‘agent teams’, allowing multiple Claude instances to collaborate on sophisticated engineering challenges.
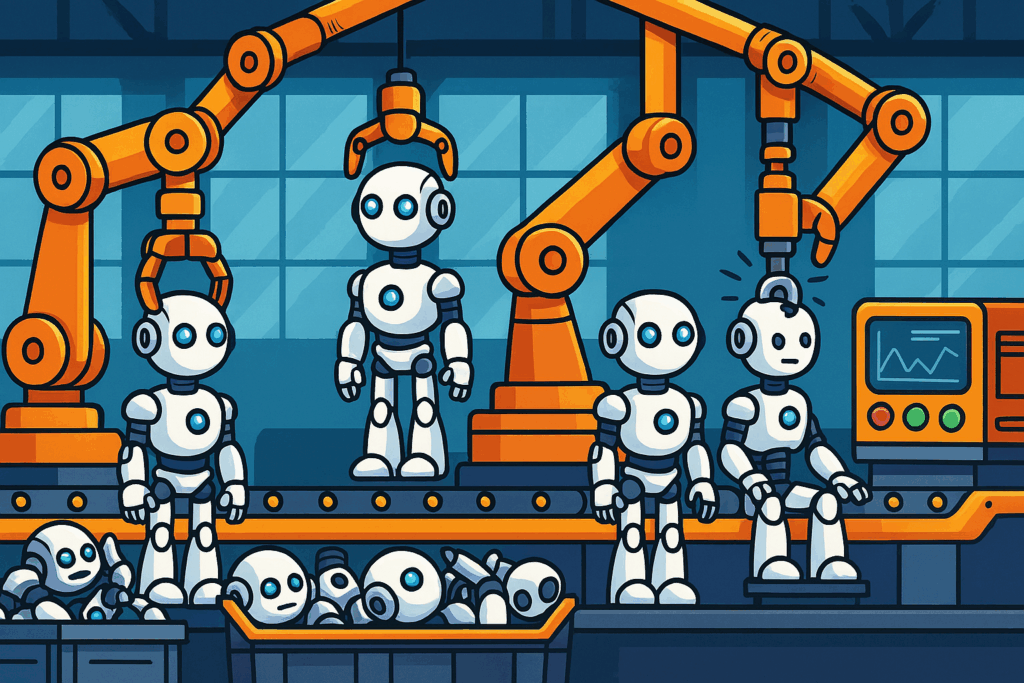
In one internal experiment, a team of 16 Claude agents built a complete Rust‑based C compiler capable of compiling the Linux kernel—producing nearly 100,000 lines of code with minimal human intervention.
Agentic shift
This agentic shift is reshaping expectations around AI‑driven software development. Anthropic positions Opus 4.6 not merely as a tool but as a foundation for autonomous, multi‑agent workflows that can plan, execute, and refine complex tasks over extended periods.
The company highlights improvements in reliability, coding precision, and long‑running task stability as core differentiators.
With enterprise adoption already representing the majority of Anthropic’s business, Opus 4.6 signals a decisive step toward AI systems that operate as high‑level collaborators rather than assistants.
As markets digest the implications, one thing is clear: Anthropic is accelerating the transition from ‘AI that helps’ to AI that works alongside you—and sometimes, entirely on its own.
Legal profession
Anthropic is pushing aggressively into the legal domain, positioning Claude as a high‑precision research and drafting partner for firms handling complex regulatory workloads.
The latest models emphasise long‑context accuracy, allowing lawyers to ingest entire case bundles, contracts, or disclosure sets without losing coherence.
Anthropic has also expanded constitutional AI safeguards, aiming to reduce hallucinations in high‑stakes legal reasoning.
Early adopters report gains in due‑diligence speed, contract comparison, and regulatory interpretation, particularly in financial services and data‑protection work.
While not a substitute for legal judgement, Claude is rapidly becoming a force multiplier for teams managing heavy document‑driven tasks.