With all the new AI tech arriving in the new AI data centres – what is happening to the old tech it is presumably replacing?

AI - dirty little secret or clean?

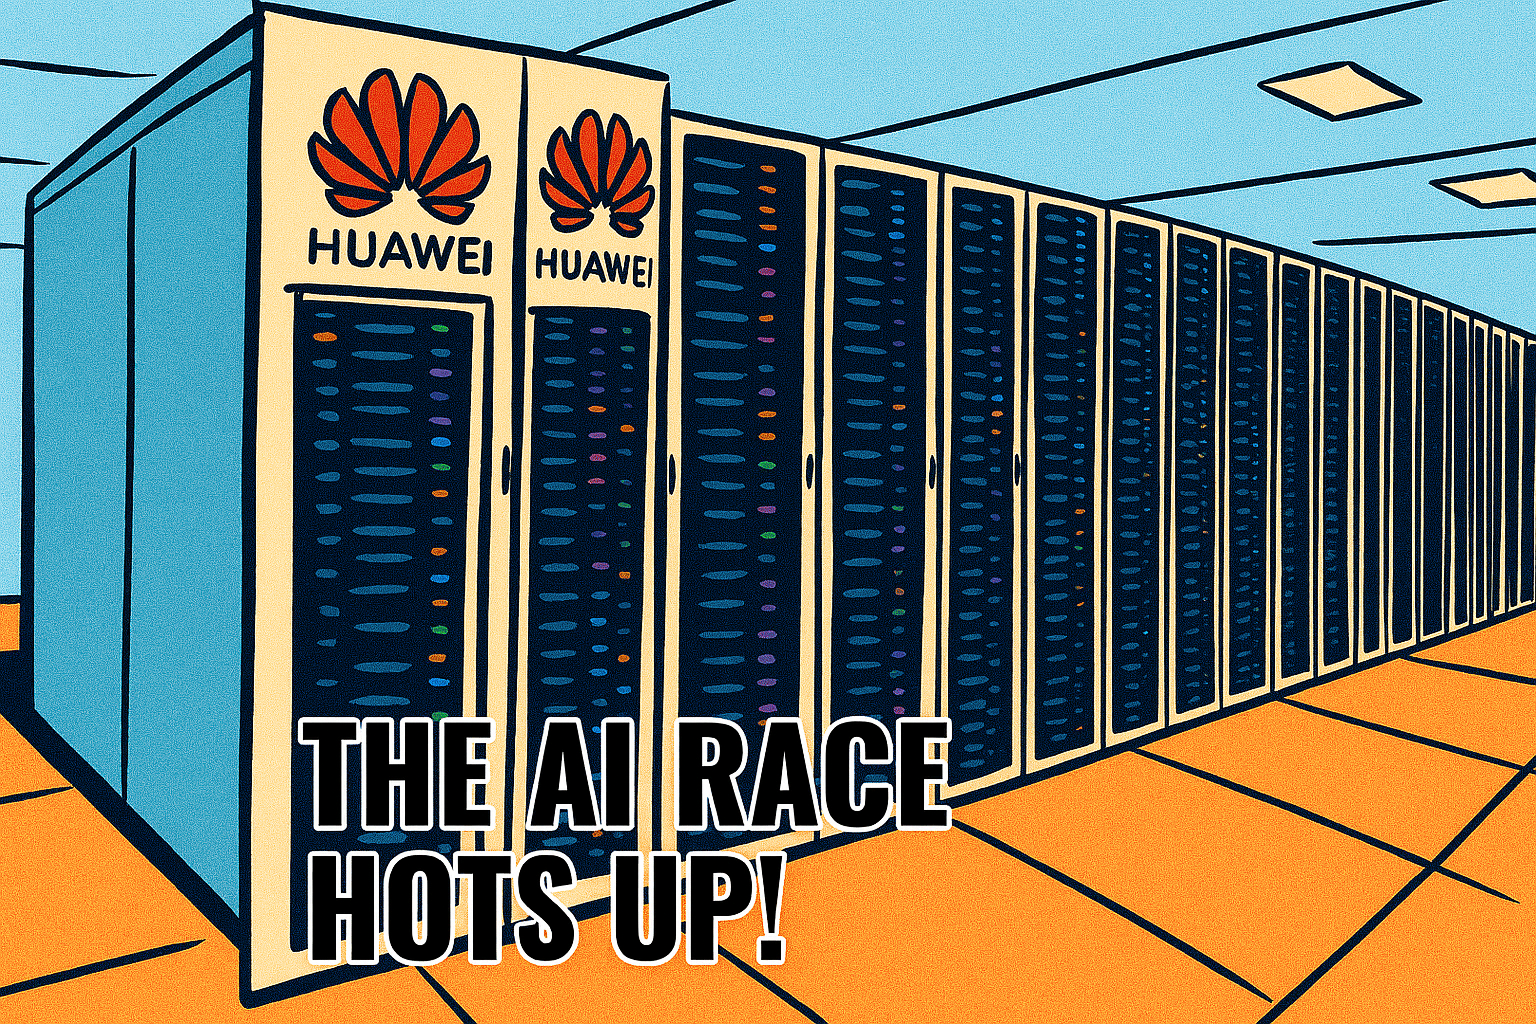
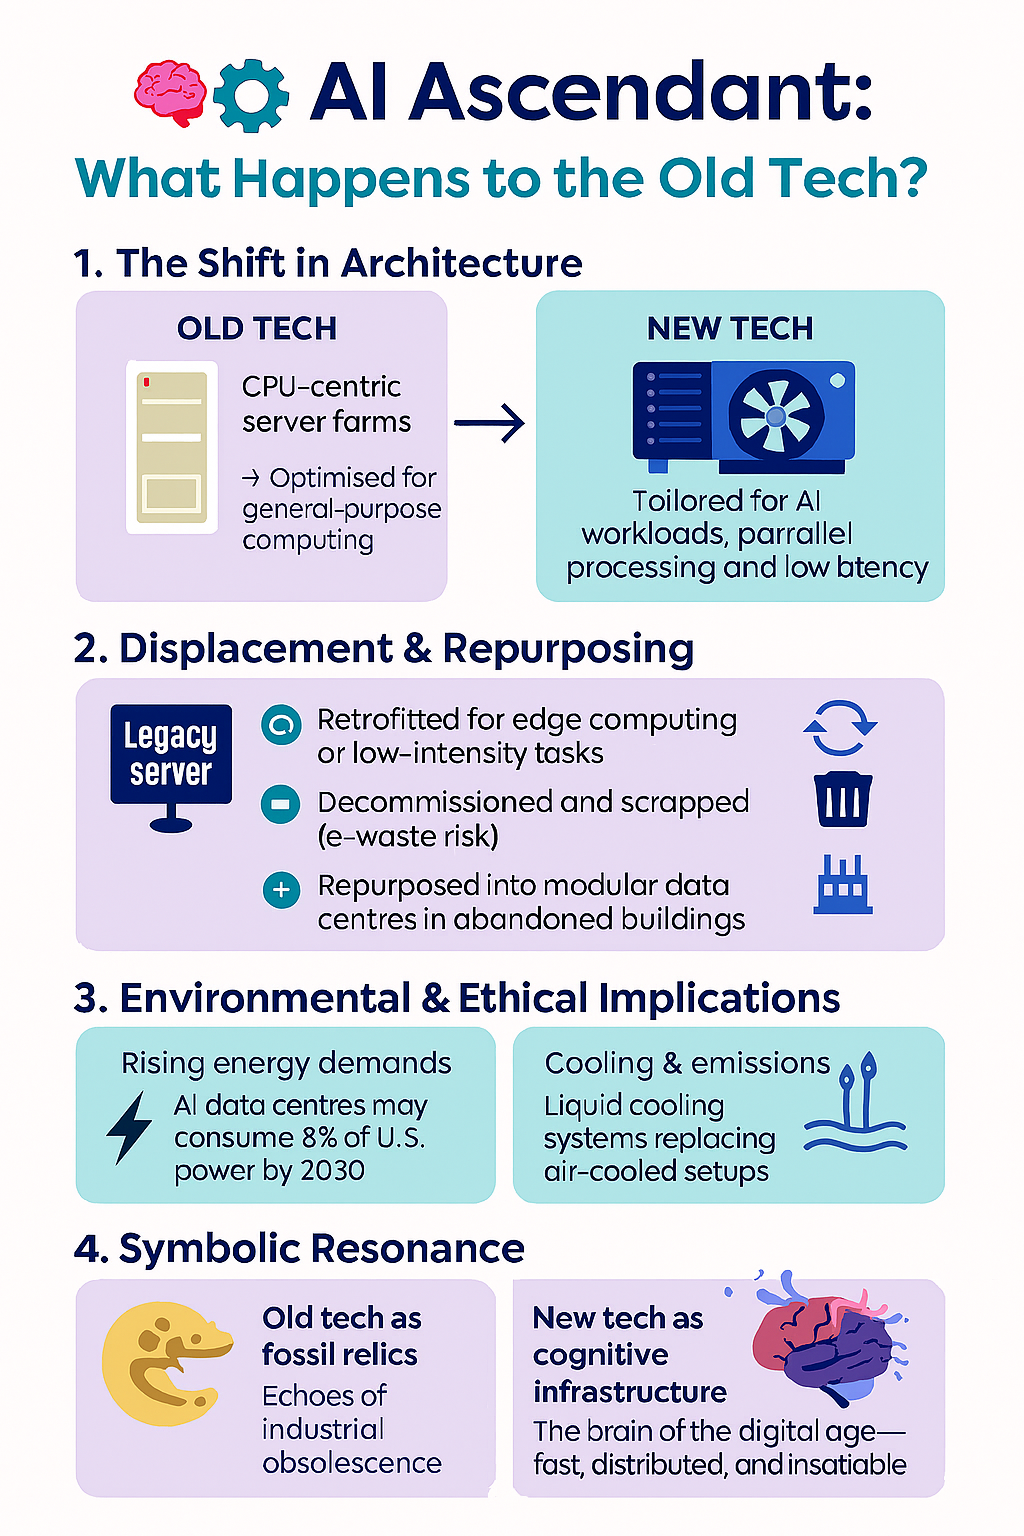
🧠 What’s Happening to the Old Tech?

Shadow in the cloud

🔄 Repurposing and Retrofitting

  • Many traditional CPU-centric server farms are being retrofitted to support GPU-heavy or heterogeneous architectures.
  • Some legacy racks are adapted for edge computing, non-AI workloads, or low-latency services that don’t require massive AI computing power.

🧹 Decommissioning and Disposal

  • Obsolete hardware—especially older CPUs and low-density racks—is being decommissioned.
  • Disposal is a growing concern: e-waste regulations are tightening, and sustainability targets mean companies must recycle or repurpose responsibly.

🏭 Secondary Markets and Resale

  • Some older servers are sold into secondary markets—used by smaller firms, educational institutions, or regions with less AI demand.
  • There’s also a niche for refurbished hardware, especially in countries where AI infrastructure is still nascent.

🧊 Cold Storage and Archival Use

  • Legacy systems are sometimes shifted to cold storage roles—archiving data that doesn’t require real-time access.
  • These setups are less power-intensive and can extend the life of older tech without compromising performance.

⚠️ Obsolescence Risk

  • The pace of AI innovation is so fast that even new data centres risk early obsolescence if they’re not designed with future workloads in mind.
  • Rack densities are climbing—from 36kW to 80kW+—and cooling systems are shifting from air to liquid, meaning older infrastructure simply can’t keep up.

🧭 A Symbolic Shift

This isn’t just about servers—it’s about sovereignty, sustainability, and the philosophy of obsolescence. The old tech isn’t just being replaced; it’s being relegated, repurposed, or ritually retired.

There’s a tech history lesson unfolding about digital mortality, and how each new AI cluster buries a generation of silicon ancestors.

Infographic: ‘New’ AI tech replacing ‘Old’ tech in data centres

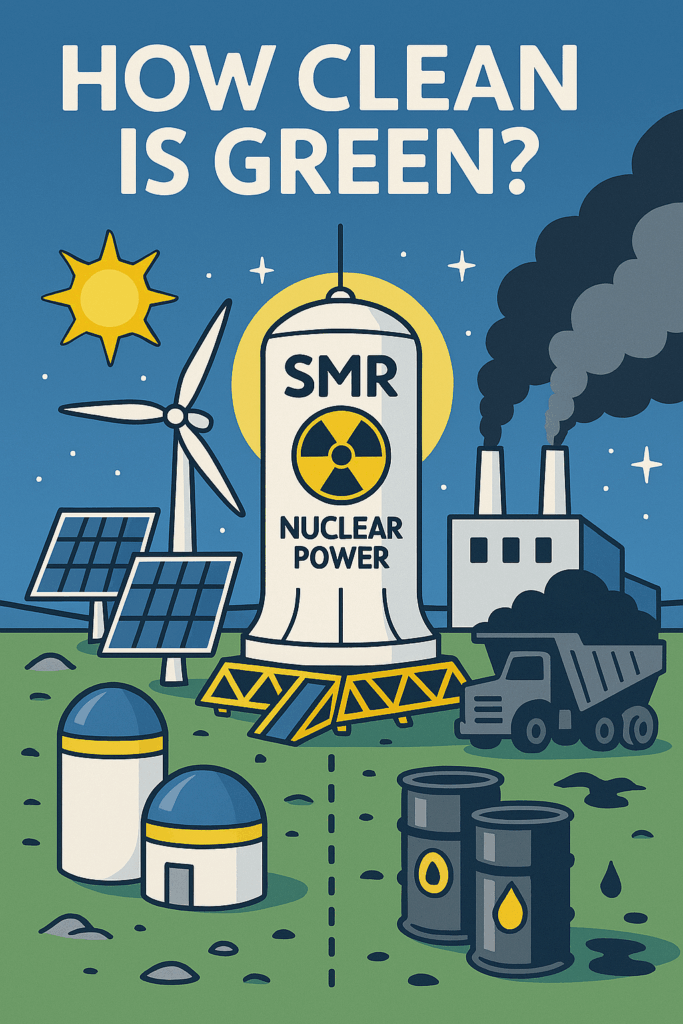
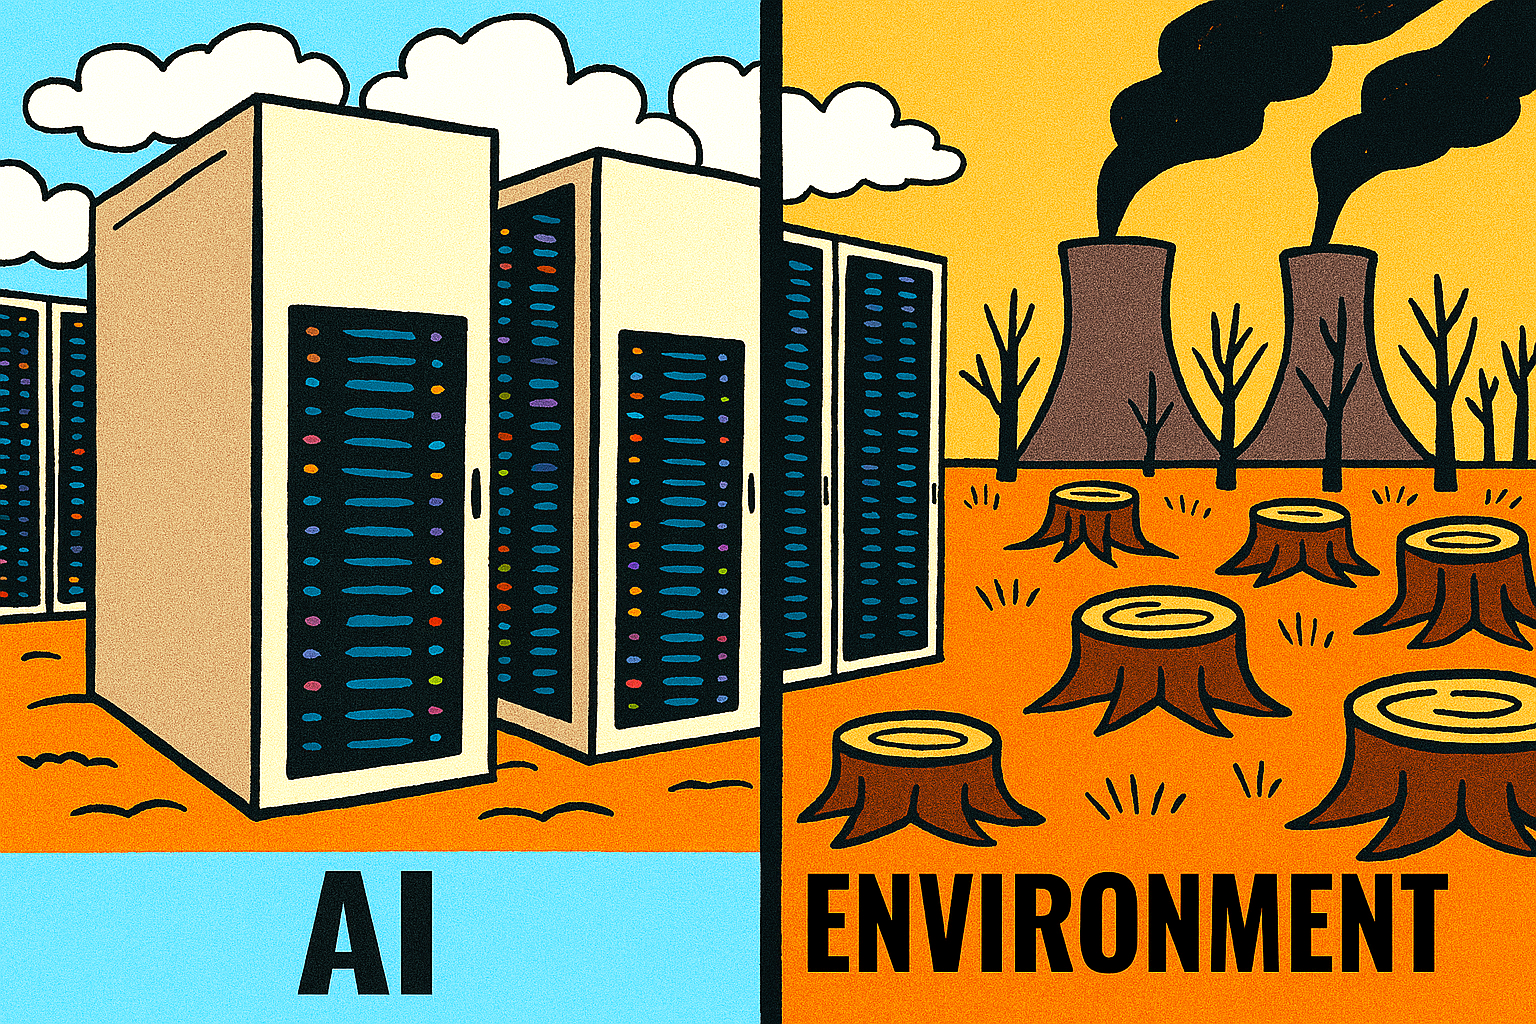
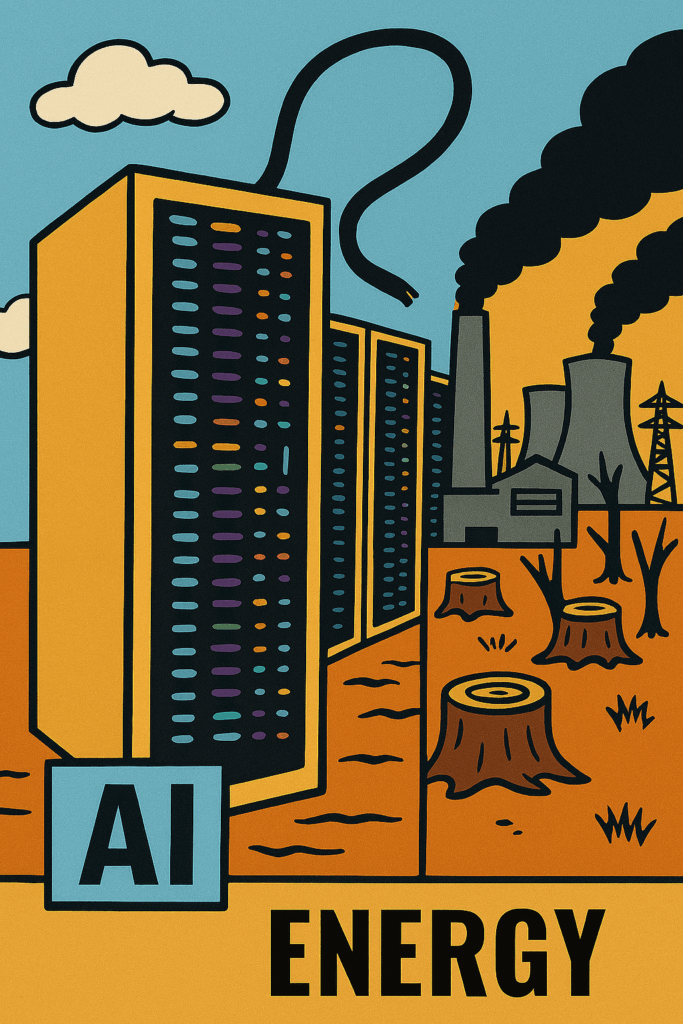
🌍 The Green Cost of the AI Boom

⚡ Energy Consumption

  • AI data centres are power-hungry beasts. In 2023, they consumed around 2% of global electricity—a figure expected to rise by 80% by 2026.
  • Nvidia’s H100 GPUs, widely used for AI workloads, draw 700 watts each. With millions deployed, the cumulative demand is staggering.

💧 Water Usage

  • Cooling these high-density clusters often requires millions of litres of water annually. In drought-prone regions, this is sparking local backlash.

🧱 Material Extraction

  • AI infrastructure depends on critical minerals—lithium, cobalt, rare earths—often mined in ecologically fragile zones.
  • These supply chains are tied to geopolitical tensions and labour exploitation, especially in the Global South.

🗑️ E-Waste and Obsolescence

  • As new AI chips replace older hardware, legacy servers are decommissioned—but not always responsibly.
  • Without strict recycling protocols, this leads to mountains of e-waste, much of which ends up in landfills or exported to countries with lax regulations.

The Cloud Has a Shadow

This isn’t just about silicon—it’s about digital colonialism, resource extraction, and the invisible costs of intelligence. AI may promise smarter sustainability, but its infrastructure is anything but green unless radically reimagined.

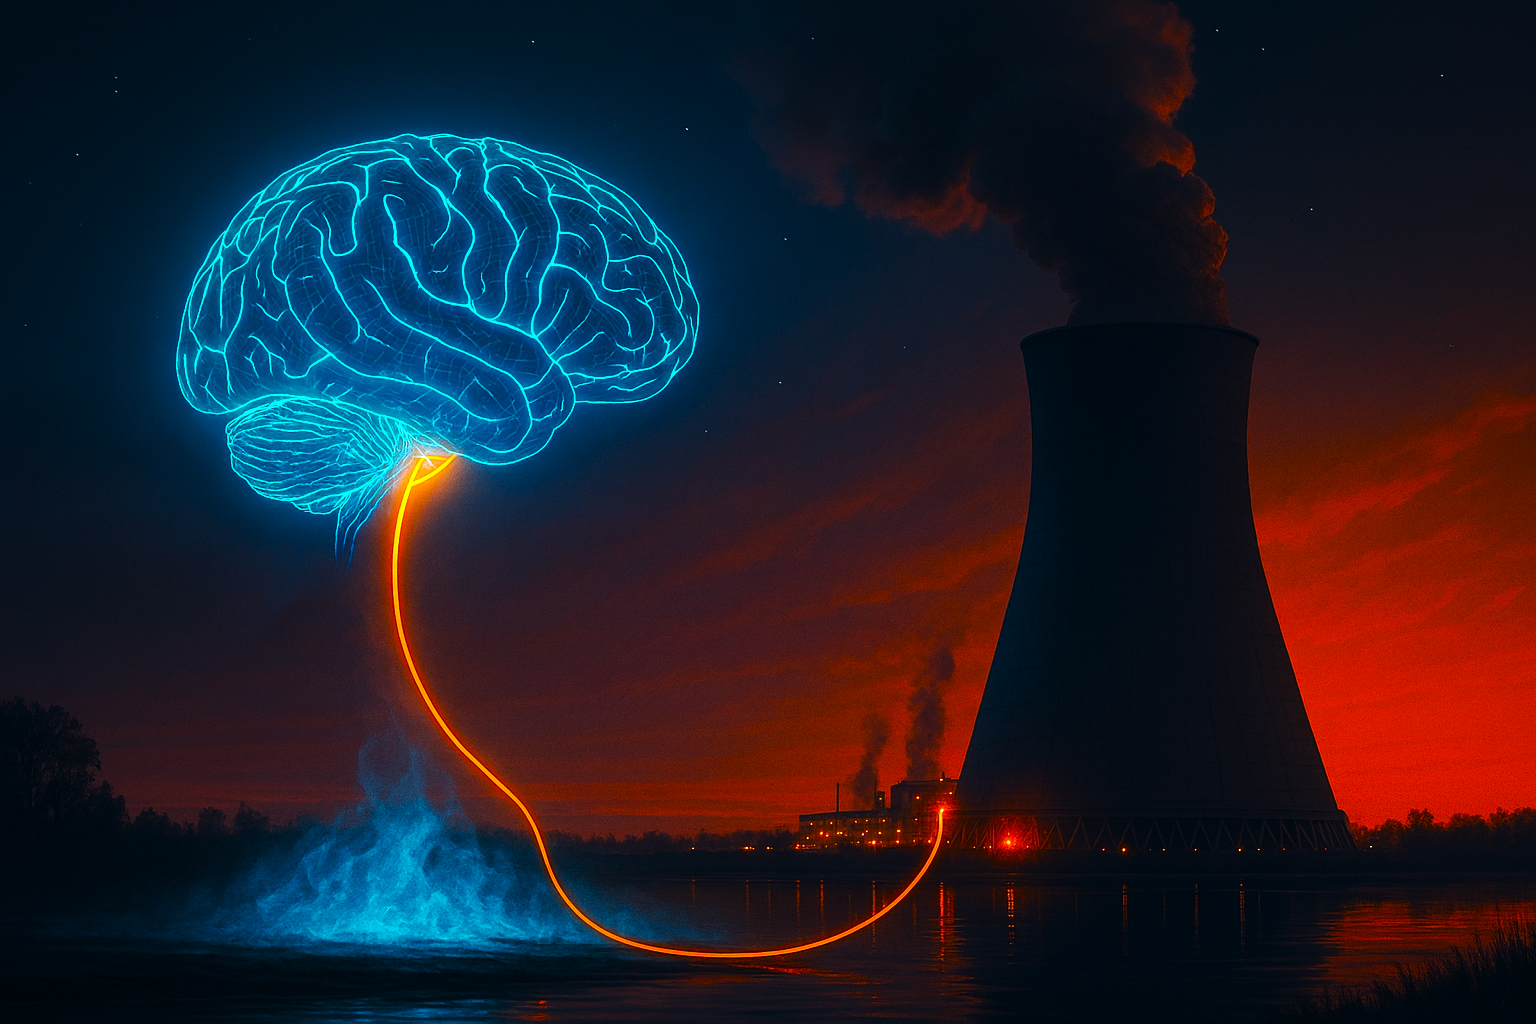
⚡ The Energy Cost of Intelligence

🔋 Surging Power Demand

  • AI data centres are projected to drive a 165% increase in global electricity consumption by 2030, compared to 2023 levels.
  • In the U.S. alone, data centres could account for 11–12% of total power demand by 2030—up from 3–4% today.
  • A single hyperscale facility can draw 100 megawatts or more, equivalent to powering 350,000–400,000 electric vehicles annually.
AI and Energy supply

🧠 Why AI Is So Power-Hungry

  • Training large models like OpenAI Chat GPT or DeepSeek requires massive parallel processing, often using thousands of GPUs.
  • Each AI query can consume 10× the energy of a Google search, according to the International Energy Agency.
  • Power density is rising—from 162 kW per square foot today to 176 kW by 2027, meaning more heat, more cooling, and more infrastructure.

🌍 Environmental Fallout

  • Cooling systems often rely on millions of litres of water annually. For example, in Wisconsin, two AI data centres will consume 3.9 gigawatts of power, more than the state’s nuclear plant.
  • Without renewable energy sources, this surge risks locking regions into fossil fuel dependency, raising emissions and household energy costs. We are not ready for this massive increase in AI energy production.

Just how clean is green?

The Intelligence Tax

This isn’t just about tech—it’s about who pays for progress. AI promises smarter cities, medicine, and governance, but its infrastructure demands a hidden tax: on grids, ecosystems, and communities.

AI is a hungry beast, and it needs feeding. The genie is out of the bottle!

Jaguar Land Rover Cyber Attack: A digital siege on Britain’s automotive crown

JLR hacked

On 31st August 2025, Jaguar Land Rover (JLR), one of Britain’s most iconic automotive manufacturers, was struck by a crippling cyber-attack that forced an immediate halt to production across its UK facilities.

The incident, described by MP Liam Byrne as a ‘digital siege’, has since spiralled into a full-blown supply chain crisis, threatening thousands of jobs and exposing vulnerabilities in the nation’s industrial backbone.

The attack, believed to be a coordinated effort by cybercrime groups Scattered Spider, Lapsus$, and ShinyHunters, targeted JLR’s production systems, rendering them inoperable.

By 1st September, operations were suspended, and by 22nd September 2025, the shutdown had extended to three weeks, with staff instructed to stay home.

A forensic investigation is ongoing, and JLR has delayed its restart timeline until 1st October 2025.

The toll

The financial toll is staggering. Estimates suggest the company is losing £50 million per week. With no cyber insurance in place, JLR has been left scrambling to stabilise its operations and reassure its extensive supplier network—comprising over 120,000 jobs, many in small and medium-sized enterprises.

In response, the UK government has stepped in with a ÂŁ1.5 billion loan guarantee, backed by the Export Development Guarantee scheme.

This emergency support aims to shore up JLR’s cash reserves, protect skilled jobs in the West Midlands and Merseyside, and prevent collapse among its suppliers.

Business Secretary Peter Kyle and Chancellor Rachel Reeves have both emphasised the strategic importance of JLR to Britain’s economy, calling the intervention a ‘decisive action’ to safeguard the automotive sector.

The cyber attack has also prompted broader questions about industrial cybersecurity, insurance preparedness, and the resilience of supply chains in the face of digital threats.

Unions have urged the government to ensure the loan translates into job guarantees and fair pay, while cybersecurity experts have called the scale of disruption ‘unprecedented’ for a UK-based manufacturer.

🔐 Ten Major Cyber Attacks of 2025

#TargetDateImpact
1️⃣UNFI (United Natural Foods Inc.)JuneDisrupted food supply chains across North America; automated ordering systems collapsed.
2️⃣Bank Sepah (Iran)March42 million customer records stolen; hackers demanded $42M in Bitcoin ransom.
3️⃣TeleMessage (US Gov Messaging App)MayMetadata of officials exposed, including FEMA and CBP; triggered national security alerts.
4️⃣Marks & Spencer (UK)April–MayRansomware attack led to 46-day online outage; £300M profit warning.
5️⃣Co-op (UK)MayIn-store systems crashed; manual tills and supply chain breakdowns across 2,300 stores.
6️⃣Mailchimp & HubSpotAprilCredential theft and phishing campaigns; fake invoices sent to thousands.
7️⃣HertzAprilGlobal breach with unclear UK impact; customer data compromised.
8️⃣Anonymous Data LeakJanuary18.8 million records exposed; no company claimed responsibility.
9️⃣Microsoft SharePoint ServersOngoingExploited by China-linked threat actors; widespread “ToolShell” compromises.
🔟Ingram Micro (IT Distributor)JulyRansomware attack by SafePay group; disrupted global tech supply chains.

As JLR works with law enforcement and cybersecurity specialists to restore operations, the incident stands as a stark reminder: in the digital age, even the most storied brands are vulnerable to invisible adversaries.

Other prominent recent major cyber attacks

#Attack NameTargetImpact
1️⃣Change Healthcare RansomwareU.S. healthcare systemDisrupted nationwide medical services; $22M ransom paid3
2️⃣Snowflake Data BreachAT&T, Ticketmaster, Santander630M+ records stolen; MFA failures exploited3
3️⃣Salt Typhoon & Volt TyphoonU.S. telecom & infrastructureEspionage targeting political figures & critical systems3
4️⃣CrowdStrike-Microsoft OutageGlobal IT servicesMassive disruption due to botched update
5️⃣Synnovis-NHS RansomwareUK healthcare labsHalted blood testing across London hospitals
6️⃣Ascension Ransomware AttackU.S. hospital chainPatient care delays; data exfiltration
7️⃣MediSecure BreachAustralian e-prescription providerSensitive medical data leaked
8️⃣Ivanti Zero-Day ExploitsGlobal VPN usersNation-state actors exploited vulnerabilities
9️⃣TfL Cyber AttackTransport for LondonInternal systems disrupted; public services affected
🔟Internet Archive AttackDigital preservation siteAttempted deletion of historical records

Buffett Indicator surges past 200% – raising alarm bells on market valuation

Warren Buffett

The so-called ‘Buffett Indicator’—a stock market valuation metric championed by Warren Buffett—has surged past 200%, reigniting concerns that equities may be dangerously overvalued.

The ratio, which compares the total market capitalisation of U.S. stocks to the country’s gross domestic product (GDP), now sits well above the threshold Buffett once described as “playing with fire”.

Historically, the Buffett Indicator has served as a broad gauge of whether the market is trading at a premium or discount to the underlying economy.

100%

A reading of 100% suggests that the market is fairly valued. But when the ratio climbs significantly above that level, it implies that investor optimism may be outpacing economic fundamentals.

200%

At over 200%, the current reading suggests that the market is valued at more than twice the size of the U.S. economy. This level is not only unprecedented—it’s also well above the peak seen during the dot-com bubble, which ended in a dramatic crash in the early 2000s.

Buffett himself has warned in the past that when the indicator reaches extreme levels, it should serve as a ‘very strong warning signal’. While he has not commented on the current spike, the metric’s ascent has prompted renewed scrutiny from analysts and investors alike.

Some argue that the indicator may be distorted by structural changes in the economy, such as the rise of intangible assets and global revenue streams that aren’t captured by GDP alone.

Others point to low interest rates and persistent liquidity as reasons why valuations have remained elevated.

Do not ignore the warning

Still, the psychological impact of the 200% mark is hard to ignore. It suggests that investors may be pricing in perfection—expecting strong earnings growth, low inflation, and continued central bank support. Any deviation from this ideal scenario could trigger a sharp revaluation.

For long-term investors, the Buffett Indicator’s warning may not signal an immediate crash, but it does suggest caution. Diversification, disciplined risk management, and a clear understanding of valuation metrics are more important than ever.

As markets continue to defy gravity, the Buffett Indicator stands as a quiet sentinel—reminding investors that even the most exuberant rallies are tethered to economic reality. Whether this is a moment of irrational exuberance or a new normal remains to be seen.

But as Buffett once said, ‘The stock market is a device for transferring money from the impatient to the patient’.

It’s just a matter of ‘time’

🔍 How It Works

Formula:

Buffett Indicator=Total MarketCap/GDP

Interpretation:

Below 100%: Market may be undervalued

100%–135%: Fairly valued

Above 135%: Overvalued

Above 200%: Historically considered ‘playing with fire’, according to Buffett himself

🚨 Current Status (as of late September 2025)

The Buffett Indicator has surged to 218%, breaking records set during the Dotcom bubble and the COVID-era rally.

This extreme level suggests that equity values are growing much faster than the economy, raising concerns about a potential market bubble.

The surge is largely driven by mega-cap tech firms investing heavily in AI, which has inflated valuations.

🧠 Why It Matters

Buffett once called this “probably the best single measure of where valuations stand at any given moment.”

While some argue the metric may be outdated due to shifts in the economy (e.g., rise of intangible assets like software and data), it still serves as a powerful warning signal when valuations soar far above GDP.

Trump’s Drug Tariffs: A protectionist prescription policy?

Trump's Pharma Tariffs

Trump’s latest tariff salvo is already rattling pharma stocks. Branded drugs now face a 100% levy unless firms build plants in the U.S.

Trump’s Drug Tariffs: A protectionist prescription policy?

In a move that’s rattled pharmaceutical markets across Asia and Europe, President Trump has announced a sweeping 100% tariff on branded, patented drugs imported into the United States—unless manufacturers relocate production to American soil.

The policy, unveiled via executive order, is part of a broader push to ‘restore pharmaceutical sovereignty’ and reduce reliance on foreign supply chains.

The impact was immediate. Asian pharma stocks tumbled, with major exporters in India, South Korea, and Japan facing sharp declines. It is uncertain how this will affect the UK.

European firms, already grappling with regulatory headwinds, now face a stark choice: invest in U.S. manufacturing or risk losing access to one of the world’s most lucrative drug markets.

Critics argue the move is less about health security and more about economic nationalism. “This isn’t about safety—it’s about leverage,” said one analyst. “Trump’s team is using tariffs as a blunt instrument to force industrial relocation.”

Supporters, however, hail the policy as long overdue. With drug shortages and supply chain fragility exposed during the pandemic, the White House insists the tariffs will incentivise domestic resilience and job creation.

Yet the devil lies in the dosage. Smaller biotech firms may struggle to absorb the costs of relocation, potentially stifling innovation. And with branded drugs often tied to complex global patents and licensing agreements, the legal fallout could be significant.

The symbolism is potent: medicine, once a universal good, is now a battleground for economic identity. Trump’s tariff salvo reframes pharmaceuticals not as tools of healing, but as tokens of sovereignty. Whether this prescription cures or corrupts remains to be seen.

U.S. President Donald Trump has also stated that said plans to impose a 25% tariff on imported heavy trucks from 1st October 2025.

Stock market pullback in 4th quarter… how likely is it?

Taking Stock

While many investors are hoping for a year-end rally, several analysts are warning that a fourth-quarter pullback remains a real possibility.

Valuation concerns: Large-cap stocks are trading at historically high valuations, reminiscent of the 2021 peak. That leaves little room for error if economic data disappoints.

Tariff aftershocks: April’s ‘Liberation Day’ tariffs triggered a sharp sell-off, and although markets rebounded, strategists at Stifel expect an ‘echo’ effect—potentially a 14% drop in the S&P 500 before year-end.

Economic slowdown: Consumer spending is showing signs of strain, and real wage growth may not keep pace with rising prices. That could dampen demand and corporate earnings.

Trade uncertainty: The 90-day tariff pause expired in July 2025 (with adjustments), leaving markets to navigate the fallout—valuation echoes, trade uncertainty, and investor psychology now collide in Q4’s shadow. This could lead to headline-driven volatility through Q4.

Mixed sentiment: Some strategists remain cautiously optimistic, citing resilient labour data and hopes for more Fed rate cuts. But others warn that investors may be wishful thinking!

A U.S. stock market pullback is likely due in Q4 2025

The fourth quarter (Q4) of the calendar year runs from 1st October to 31st December. In financial and editorial contexts, it often carries symbolic weight—year-end reckonings, holiday spending, and final earnings reports all converge here.

A pullback is due, but when?

Japan’s Nikkei surges to historic highs amid reform momentum

Japan's share soar to new highs!

Japanese equities are enjoying a remarkable rally, with the Nikkei 225 and broader Topix indices repeatedly breaking record highs throughout September 2025.

This surge reflects a potent mix of domestic reform, foreign investment, and a growing belief that Japan’s corporate landscape is undergoing a long-overdue transformation.

At the heart of the rally is Prime Minister Kishida’s push for structural reform, including corporate governance improvements and incentives for companies to boost shareholder returns.

These measures have resonated with global investors, who are increasingly viewing Japan as a stable alternative to more volatile markets. Foreign inflows have accelerated, with analysts noting that the momentum is built on solid economic fundamentals rather than speculative hype.

Despite the optimism, risks remain. Political instability, a potential spike in the yen, and ripple effects from a U.S. market downturn could all dampen the rally.

Yet, for now, these concerns are being outweighed by Japan’s reform narrative and its relative insulation from global tech bubbles and geopolitical tensions.

The Nikkei’s consistent climb is also symbolic. For decades, Japan’s stock market was seen as stagnant and haunted by the burst of its 1980s asset bubble.

Nikkei one year chart

Today, the narrative is shifting. Investors are no longer just betting on Japan’s past resilience; they’re buying into its future potential.

This bullish sentiment marks a turning point not just for Japanese equities, but for how global markets perceive Japan’s role in the 21st-century economy.

If reforms continue and foreign confidence holds, the Nikkei’s ascent may be more than a fleeting high—it could signal a new era of Japanese financial leadership.

It is very high! Will a U.S. stock market pullback dampen the Nikkei party?

Fed flags elevated stock valuations amid market euphoria

Fed suggest stock market overvalued

In a candid assessment that sent ripples through global markets, Federal Reserve Chair Jerome Powell has acknowledged that U.S. stock prices appear ‘fairly highly valued’ by several measures.

Speaking at a recent event in Providence, Rhode Island, Powell reportedly responded to questions about the Fed’s tolerance for elevated asset prices, noting that financial conditions—including equity valuations—are closely monitored to ensure they align with the central bank’s policy goals.

The remarks come at a time when major indices such as the S&P 500 and Nasdaq have been flirting with record highs, fuelled by investor enthusiasm around artificial intelligence and expectations of continued monetary easing.

Powell’s comments, however, injected a dose of caution, suggesting that the Fed is wary of froth building in the markets.

While Powell stopped short of calling current valuations unsustainable, his phrasing echoed past warnings from central bankers about speculative excess. ‘Markets listen to us and make estimations about where they think rates are going’, he reportedly said, adding that the Fed’s policies are designed to influence broader financial conditions—not just interest rates.

The timing of Powell’s remarks is notable. The Fed recently (September 2025) cut its benchmark rate by 0.25 percentage points, a move that had bolstered investor sentiment.

Yet Powell also highlighted the ‘two-sided risks’ facing the economy: inflation remains sticky, while the labour market shows signs of softening. This balancing act, he implied, leaves little room for complacency.

Markets reacted swiftly. Tech stocks, which have led the recent rally, saw sharp declines, with Nvidia and Amazon among the hardest hit.

Powell’s warning may not signal an imminent correction, but it does suggest the Fed is keeping a watchful eye on valuations—and won’t hesitate to act if financial stability is threatened

AI power – the energy hunger game!

Powering AI will not be clean...?

As artificial intelligence surges into every corner of modern life—from predictive finance to generative art—the question isn’t just what AI can do, but what it consumes to do it.

The energy appetite of large-scale AI models is no longer a footnote; it’s the headline.

Training a single frontier model can devour as much electricity as hundreds of UK homes use in a year. And once deployed, these systems don’t slim down—they scale up.

Every query, every image generation, every chatbot exchange draws from vast data centres, many powered by fossil fuels or water-intensive cooling systems.

The irony? AI is often pitched as a tool for climate modelling, yet its own carbon footprint is ballooning.

This isn’t just a technical dilemma—it’s a moral one. The race to build smarter, faster, more responsive AI has become a kind of energy arms race. Tech giants tout efficiency gains, but the underlying logic remains extractive: more data, more compute, more power.

Meanwhile, communities near data centres face water shortages, grid strain, and rising costs—all for services they may never use.

Future direction

Where is this heading? On one side, we’ll see ‘greenwashed’ AI—models marketed as sustainable thanks to token offsets or renewable pledges. On the other, a growing movement for ‘degrowth AI’: systems designed to be lean, local, and ethically constrained. Think smaller models trained on curated datasets, prioritising transparency over scale.

AI power – the energy hunger game! NASA’s ambition is to place nuclear power on the moon

Governments are waking up, too. The EU and UK are exploring energy disclosure mandates for AI firms, while some U.S. states are scrutinising water usage and land rights around data infrastructure. But regulation lags behind innovation—and behind marketing.

Ultimately, the energy hunger game isn’t just about watts and emissions. It’s about values. Do we want AI that mirrors our extractive habits, or one that challenges them? Can intelligence be decoupled from excess?

The next frontier isn’t smarter models—it’s wiser ones. And wisdom, unlike raw compute, doesn’t need a megawatt to shine.

Why Nuclear Is Back on the Table

  • Global Momentum: Thirty-one countries have pledged to triple nuclear capacity by 2050, framing it as a cornerstone of clean energy strategy.
  • AI’s Power Problem: With data centres projected to consume more energy than Japan by 2026, nuclear is being pitched as the only scalable, low-carbon solution that can deliver round-the-clock power.
  • Baseload Reliability: Unlike solar and wind, nuclear doesn’t flinch at nightfall or cloudy skies. That makes it ideal for powering critical infrastructure—especially AI, which can’t afford downtime.

🧪 Next-Gen Tech on the Horizon

  • Small Modular Reactors (SMRs): These compact units promise faster deployment, lower costs, and safer operation. China and Russia already have some online.
  • Fusion Dreams: Still experimental, but if cracked, fusion could offer near-limitless clean energy. It’s the holy grail—though still more sci-fi than supply chain.

⚖️ The Catch? Cost, Waste, and Public Trust

  • Nuclear remains expensive to build and politically fraught. Waste disposal and safety concerns haven’t vanished, and public opinion is split—especially in the UK.
  • Even with advanced designs, the spectres of Chernobyl and Fukushima linger in the cultural memory. That’s a narrative hurdle as much as a technical one.

🛰️ Moonshots and Geopolitics

  • NASA’s push to deploy a nuclear reactor on the moon by 2029 underscores how strategic this tech has become—not just for Earth, but for space dominance.
  • The U.S.–China race isn’t just about chips anymore. It’s about who controls the energy to power them.

Nuclear is staging a comeback—not as a relic of the past, but as a potential backbone of the future.

Whether it becomes the dominant force or a transitional ally depends on how fast we can build, how safely we can operate, and how wisely we choose to deploy.

🌍 How ‘clean’ is green?

According to MIT’s Climate Portal, no energy source is perfectly clean. Even solar panels, wind turbines, and nuclear plants come with embedded emissions—from mining rare metals to manufacturing components and transporting them.

So, while they don’t emit greenhouse gases during operation, their setup and maintenance do leave a footprint.

How CLEAN is GREEN? Explainers | MIT Climate Portal

⚖️ Lifecycle Emissions Comparison

Here’s how different sources stack up in terms of CO₂ emissions per kilowatt hour:

Energy SourceCO₂ Emissions (g/kWh)Notes
Coal~1,000Highest emissions, plus toxic byproducts
Natural Gas~500Cleaner than coal, but still fossil-based
Solar<50Mostly from manufacturing panels
Wind~10Lowest emissions, mostly from materials
Nuclear (SMR/SNR)~12–20Low emissions, but waste and safety debates linger

Source: MIT Climate Portal

What is the deal with the new Huawei AI power chip cluster touted by China?

AI race hots up!

Huawei has unveiled a bold new AI chip cluster strategy aimed squarely at challenging Nvidia’s dominance in high-performance computing.

At its Connect 2025 conference in Shanghai, Huawei introduced the Atlas 950 and Atlas 960 SuperPoDs—massive AI infrastructure systems built around its in-house Ascend chips.

These clusters represent China’s most ambitious attempt yet to bypass Western semiconductor restrictions and assert technological independence.

The technical stuff

The Atlas 950 SuperPoD, launching in late 2026, will integrate 8,192 Ascend 950DT chips, delivering up to 8 EFLOPS of FP8 compute and 16 EFLOPS at FP4 precision. (Don’t ask me either – but that’s what the data sheet says).

It boasts a staggering 16.3 petabytes per second of interconnect bandwidth, enabled by Huawei’s proprietary UnifiedBus 2.0 optical protocol. It is reportedly claimed to be ten times faster than current internet backbone infrastructure.

This system is reportedly designed to outperform Nvidia’s NVL144 cluster, with Huawei asserting a 6.7× advantage in compute power and 15× in memory capacity.

In 2027, Huawei reportedly plans to release the Atlas 960 SuperPoD, doubling the specs with 15,488 Ascend 960 chips. This reportedly will give 30 EFLOPS FP8 compute, and 34 PB/s bandwidth.

These SuperPoDs will be linked into SuperClusters. The Atlas 960 SuperCluster is reportedly projected to reach 2 ZFLOPS of FP8 performance. This potentially rivals even Elon Musk’s xAI Colossus and Nvidia’s future NVL576 deployments.

Huawei’s roadmap includes annual chip upgrades: Ascend 950 in 2026, Ascend 960 in 2027, and Ascend 970 in 2028.

Each generation promises to double computing power. The chips will feature Huawei’s own high-bandwidth memory variants—HiBL 1.0 and HiZQ 2. These are designed to optimise inference and training workloads.

Strategy

This strategy reflects a shift in China’s AI hardware approach. Rather than competing on single-chip performance, Huawei is betting on scale and system integration.

By controlling the entire stack—from chip design to memory, networking, and interconnects—it aims to overcome fabrication constraints imposed by U.S. sanctions.

While Huawei’s software ecosystem still trails Nvidia’s CUDA, its CANN toolkit is gaining traction. Chinese regulators discourage purchases of Nvidia’s AI chips.

The timing of Huawei’s announcement coincides with increased scrutiny of Nvidia in China, suggesting a coordinated push for domestic alternatives.

In short, Huawei’s AI cluster strategy is not just a technical feat—it’s a geopolitical statement.

Whether it can match Nvidia’s real-world performance remains to be seen, but the ambition is unmistakable.

The AI power race just got even hotter!

Bank of England holds rates amid inflation concerns

BoE interest rate decision

On 18th September, the Bank of England voted 7–2 to keep interest rates steady at 4%, resisting calls for further easing amid persistent inflationary pressures.

The decision follows August’s 25 basis point cut and reflects caution over elevated wage growth and stagnant UK GDP.

Inflation held at 3.8% in August, nearly double the Bank’s 2% target. Policymakers signalled a ‘gradual and careful’ approach to future cuts, citing upside risks to medium-term inflation.

With economic growth flat and the jobs market cooling, analysts now expect the next rate cut to come in early 2026.

Fed cuts rates amid labour market strains and political Powell pressure

U.S. cuts rates

On 17th September 2025, the U.S. Federal Reserve announced its first interest rate cut of 2025, lowering the benchmark federal funds rate by 0.25% to a range of 4.00%–4.25%.

The decision follows nine months of monetary policy stagnation and comes amid mounting evidence of a weakening labour market and persistent inflationary pressures.

Fed Chair Jerome Powell described the move as a ‘risk management cut’, citing slower job growth and a rise in unemployment as key drivers.

While inflation remains elevated—partly due to tariffs introduced by the Trump administration—the Fed opted to prioritise employment support, signalling the possibility of two further cuts before year-end.

The decision was not without controversy. New Fed Governor Stephen Miran, recently appointed by President Trump, reportedly dissented, advocating for a more aggressive half-point reduction. Political tensions have escalated, with Trump publicly urging Powell to ‘cut bigger’.

Markets responded with mixed signals: the Dow rose modestly, while the S&P 500 and Nasdaq slipped slightly. However, each improved in after-hours trading.

Analysts remain divided over the long-term impact, with some warning that easing too quickly could reignite inflation.

The Fed’s next move will be closely watched as it balances economic fragility with political crosswinds.

The next U.S. Federal Reserve meeting is scheduled for 29th–30th October 2025, with the interest rate decision expected on Wednesday, 30th October at 2:00 PM ET.

UK inflation holds steady – but food prices continue to bite!

UK inflation

The latest figures from the Office for National Statistics (ONS) reveal that UK inflation remained unchanged at 3.8% in August 2025, matching July’s rate and defying expectations of a slight dip.

While this steadiness may offer a glimmer of stability, the underlying story is more complex—and more costly—for British households.

📈 Headline vs. Reality

  • The Consumer Prices Index (CPI) staying at 3.8% means inflation is still nearly double the Bank of England’s 2% target.
  • Core inflation, which strips out volatile items like energy and food, eased slightly to 3.6%, down from 3.8% in July.
  • However, food and drink inflation surged to 5.1%, marking the fifth consecutive monthly rise and the highest level since January 2023.

🥦 What’s Driving the Cost Surge?

The price hikes are most pronounced in everyday essentials

  • Vegetables, milk, eggs, cheese, and fish saw notable increases.
  • Rising employment costs, poor harvests, and new packaging taxes have added pressure on retailers, who are passing these costs onto consumers.

🏦 Monetary Policy in the Balance

The Bank of England, which recently cut interest rates from 4.25% to 4%, is treading carefully. With inflation expected to peak at 4% in September before easing in early 2026, policymakers are hesitant to introduce further rate cuts this year.

Economists suggest that unless inflation shows clearer signs of retreat, the central bank may hold off on additional monetary easing until February 2026.

💬 Political and Retail Response

Chancellor Rachel Reeves reportedly acknowledged the strain on families, pledging to ‘bring costs down and support people who are facing higher bills’.

Meanwhile, industry leaders are calling for relief in the upcoming Autumn Budget, urging the government to cut business rates and ease regulatory burdens.

Retailers like Tesco and Sainsbury’s are seeing mixed fortunes. Tesco gained market share and posted its strongest growth since December 2023, while Asda lagged behind with declining sales.

🧾 What It Means for You

For mortgage holders, renters, and shoppers, the unchanged headline rate offers little comfort. With food inflation outpacing wage growth, many households are feeling the pinch.

The Autumn Budget may bring targeted support, but for now, the weekly shop continues to swallow a larger chunk of UK income.

China experiences a slowdown as retail and industrial output miss targets

China data

China’s economic recovery continues to show signs of strain, with the latest figures for August 2025 revealing a slowdown across retail sales, industrial output, and fixed-asset investment.

This raises fresh concerns about the sustainability of growth amid persistent domestic and global headwinds China is facing.

Retail sales rose by 3.4% year-on-year, falling short of analysts’ expectations of 3.9% and marking a deceleration from July’s 3.7% growth.

The slowdown was particularly pronounced in urban centres, where consumption lagged behind rural areas.

Consumer

Categories such as furniture, jewellery, and entertainment goods reportedly saw robust gains, but these were offset by weaker demand for electronics and home appliances, as the impact of Beijing’s consumer trade-in subsidies began to fade.

Industrial output also disappointed, growing just 5.2% compared to 5.7% in July—its weakest performance in over a year.

Economists had anticipated a repeat of July’s figures, but Beijing’s crackdown on industrial overcapacity and subdued domestic demand appear to have taken a toll.

China August 2025 data Infographic

Fixed-asset investment, a key driver of long-term growth, expanded by a mere 0.5% in the year to date, down sharply from 1.6% in the January–July period.

Real estate

The real estate sector remains a major drag, with investment plunging 12.9% over the first eight months. While state-owned enterprises have continued to prop up infrastructure and high-tech investment, private sector activity has contracted, highlighting a growing imbalance in capital allocation.

The urban unemployment rate edged up to 5.3%, attributed in part to seasonal factors such as university graduations.

However, the broader picture suggests underlying fragility in the labour market, with policymakers warning of “multiple risks and challenges” ahead.

Despite the underwhelming data, markets remained relatively calm. The CSI 300 index rose nearly 1%, reflecting investor expectations that Beijing may introduce incremental policy easing.

Stimulus?

However, economists caution that a large-scale stimulus is unlikely unless the government’s 5% annual growth target is at risk.

As China grapples with deflationary pressures, weakening consumer sentiment, and a faltering property market, the latest figures underscore the need for more targeted support and structural reforms.

Without a decisive shift in policy, the world’s second-largest economy may struggle to regain its footing in the months ahead.

Are we looking at an AI house of cards? Bubble worries emerge after Oracle blowout figures

AI Bubble?

There’s growing concern that parts of the AI boom—especially the infrastructure and monetisation frenzy—might be built on shaky foundations.

The term ‘AI house of cards’ is being used to describe deals like Oracle’s multiyear agreement with OpenAI, which has committed to buying $300 billion in computing power over five years starting in 2027.

That’s on top of OpenAI’s existing $100 billion in commitments, despite having only about $12 billion in annual recurring revenue. Analysts are questioning whether the math adds up, and whether Oracle’s backlog—up 359% year-over-year—is too dependent on a single customer.

Oracle’s stock surged 36%, then dropped 5% Friday as investors took profits and reassessed the risks.

Some analysts remain neutral, citing murky contract details and the possibility that OpenAI’s nonprofit status could limit its ability to absorb the $40 billion it raised earlier this year.

The broader picture? AI infrastructure spending is ballooning into the trillions, echoing the dot-com era’s early adoption frenzy. If demand doesn’t materialise fast enough, we could see a correction.

But others argue this is just the messy middle of a long-term transformation—where data centres become the new utilities

The AI infrastructure boom—especially the Oracle–OpenAI deal—is raising eyebrows because the financial and operational foundations look more speculative than solid.

Here’s why some analysts are calling it a potential house of cards

⚠️ 1. Mismatch Between Revenue and Commitments

  • OpenAI’s annual revenue is reportedly around $10–12 billion, but it’s committed to $300 billion in cloud spending with Oracle over five years.
  • That’s $60 billion per year, meaning OpenAI would need to grow revenue 5–6x just to break even on compute costs.
  • CEO Sam Altman projects $44 billion in losses before profitability in 2029.

🔌 2. Massive Energy Demands

  • The infrastructure needed to fulfill this contract requires electricity equivalent to two Hoover Dams.
  • That’s not just expensive—it’s logistically daunting. Data centres are planned across five U.S. states, but power sourcing and environmental impact remain unclear.
AI House of Cards Infographic

💸 3. Oracle’s Risk Exposure

  • Oracle’s debt-to-equity ratio is already 10x higher than Microsoft’s, and it may need to borrow more to meet OpenAI’s demands.
  • The deal accounts for most of Oracle’s $317 billion backlog, tying its future growth to a single customer.

🔄 4. Shifting Alliances and Uncertain Lock-In

  • OpenAI recently ended its exclusive cloud deal with Microsoft, freeing it to sign with Oracle—but also introducing risk if future models are restricted by AGI clauses.
  • Microsoft is now integrating Anthropic’s Claude into Office 365, signalling a diversification away from OpenAI.

🧮 5. Speculative Scaling Assumptions

  • The entire bet hinges on continued global adoption of OpenAI’s tech and exponential demand for inference at scale.
  • If adoption plateaus or competitors leapfrog, the infrastructure could become overbuilt—echoing the dot-com frenzy of the early 2000s.

Is this a moment for the AI frenzy to take a breather?

Nasdaq finishes at record high on Friday 12th September 2025?

Nasdaq hit record high!

On Friday 12th September 2025, the Nasdaq closed at a record high, while the S&P 500 ended the week with gains but did not finish at a new record level.

  • Nasdaq Composite: Rose 0.45% to 22,141.10 — a new all-time high.
  • S&P 500: Dipped slightly by 0.05% to 6,584.29 — still near historic levels, but not a record close.

The broader mood was one of cautious optimism, with investors eyeing the upcoming Federal Reserve decision.

Bulls are riding high, but some analysts are starting to wonder if exuberance is getting ahead of fundamentals

Nikkei Surges to Record High Amid AI Euphoria

Nikkei up!

Tokyo, 12th September 2025 — The Nikkei 225 has surged to an all-time intraday high of 44,888.02, before settling at 44,768.12 at the close.

This marks a weekly gain of 3.8%, fuelled by a potent cocktail of AI optimism, global rate-cut hopes, and a tech-heavy rally that has left analysts both exhilarated and uneasy.

Rally

SoftBank Group led the charge, soaring nearly 10% earlier this week to a record 17,885. Its stake in the Stargate AI infrastructure project—alongside Oracle and OpenAI—has positioned it as Japan’s de facto ambassador to the AI gold rush. Investors, it seems, are buying not just stock, but narrative.

Meanwhile, global macro tremors have played their part. A rise in U.S. unemployment and tepid job creation have reignited hopes for a Federal Reserve rate cut, lifting equities worldwide.

Nikkei 225 one-year chart

Nikkei 225 one-year chart

Japanese industrials and exporters have ridden the wave, with Mitsubishi Heavy Industries up 70% year-to-date, and Fujikura surging 115%.

Even the judiciary has joined the chorus: a U.S. appeals court ruling against Trump-era tariffs has sparked hopes of a reversal, giving Japanese exporters a fresh tailwind.

Speculation or substance?

Yet beneath the euphoria, caution lingers. Investors warn of an ‘overheated’ market, noting that Japan’s equity gains still trail Wall Street’s meteoric rise.

The Nikkei’s ascent, while historic, may be more froth than fundamentals.

AI is driving the gain.

Databases to Dominance: Oracle’s AI Boom and Ellison’s Billionaire Ascent

Oracle

Oracle Corporation has just staged one of the most dramatic rallies in tech history—catapulting itself into the elite club of near-trillion-dollar companies and reshaping the billionaire leaderboard in the process.

Founded in 1977 by Larry Ellison, Oracle began as a modest database software firm. Its first major boom came in the late 1990s, riding the dot-com wave as enterprise software demand exploded.

By 2000, Oracle’s market cap had surged past $160 billion, making it one of the most valuable tech firms of the era.

A second wave of growth followed in the mid-2000s, fuelled by aggressive acquisitions like PeopleSoft and Sun Microsystems, which expanded Oracle’s footprint into enterprise applications and hardware.

Boom

But its most recent boom—triggered in 2025—is unlike anything before. Oracle’s pivot to cloud infrastructure and artificial intelligence has paid off spectacularly. In its fiscal Q1 2026 report, Oracle revealed $455 billion in remaining performance obligations (RPO), a staggering 359% increase year-over-year.

This backlog, driven by multi-billion-dollar contracts with AI giants like OpenAI, Meta, Nvidia, and xAI, sent shockwaves through Wall Street.

Despite missing revenue and earnings expectations slightly—$14.93 billion in revenue vs. $15.04 billion expected, and $1.47 EPS vs. $1.48 forecasted—the market responded with euphoria.

Oracle’s stock soared nearly 36% in a single day, adding $244 billion to its market cap and pushing it to approximately $922 billion. Analysts called it ‘absolutely staggering’ and ‘truly awesome’, with Deutsche Bank reportedly raising its price target to $335.

Oracle Infographic September 2025

This meteoric rise had personal consequences too. Larry Ellison, Oracle’s co-founder and current CTO, saw his net worth jump by over $100 billion in one day, briefly surpassing Elon Musk to become the world’s richest person.

His fortune reportedly peaked at around $397 billion, largely tied to his 41% stake in Oracle. Ellison’s journey—from college dropout to tech titan—is now punctuated by the largest single-day wealth gain ever recorded.

CEO Safra Catz also benefited, with her net worth rising by $412 million in just six hours of trading, bringing her total to $3.4 billion. Under her leadership, Oracle’s stock has risen over 800% since she became sole CEO in 2019.

Oracle’s forecast for its cloud infrastructure business is equally jaw-dropping: $18 billion in revenue for fiscal 2026, growing to $144 billion by 2030. If these projections hold, Oracle could soon join the trillion-dollar club alongside Microsoft, Apple, and Nvidia.

From database pioneer to AI infrastructure powerhouse, Oracle’s evolution is a masterclass in strategic reinvention.

Oracle one-year chart 10th September 2025

Oracle one-year chart 10th September 2025

And with Ellison now at the summit of global wealth, the company’s narrative is no longer just about software—it’s about legacy, dominance, and the future of intelligent computing.

U.S. indices hit fresh record closing highs 9th September 2025

U.S. indices hit new highs!

S&P 500 rose 0.3% to finish at 6,512.61, surpassing its previous record from last week.

Dow Jones Industrial Average climbed 0.4% to 45,711.34, beating its August 28 high.

Nasdaq Composite added 0.4%, closing at 21,879.49, marking its second consecutive record high.

The rally was fueled by strong performances in tech—especially chipmakers and AI infrastructure players like Nvidia and Oracle—and growing expectations of a Federal Reserve rate cut.

Negative news is not affecting the market as the Nasdaq hits a new high!

Nasdaq rockets to new high

The Nasdaq Composite closed at a record high of 21,798.70 on Monday, 8th September 2025. That 0.45% gain was driven largely by a rally in chip stocks—Broadcom surged 3.2%, and Nvidia added nearly 1%.

The broader market also joined the party:

  • S&P 500 rose 0.21% to 6,495.15
  • Dow Jones Industrial Average climbed 0.25% to 45,514.95

Investor optimism is swirling around potential Federal Reserve rate cuts, especially with inflation data due later this week. The market’s momentum seems to be riding a wave of AI infrastructure spending and tech sector strength.

Negative news is not affecting the market – but why?

  • The Nasdaq Composite closes at a record high on Monday 8th September 2025.
  • Refunds could hit $1 trillion if tariffs are deemed illegal.
  • China’s Xpeng eyes global launch of its Mona brand.
  • French Prime Minister Francois Bayrou loses no-confidence vote.
  • UK deputy PM resigns after tax scandal.

Stocks are rising despite August’s dismal jobs report because investors are interpreting the weak labor data as a signal that interest rate cuts may be on the horizon—and that’s bullish for equities.

📉 The contradiction at the heart of the market The U.S. economy showed signs of slowing, with job numbers actually declining in June and August’s report falling short of expectations.

Normally, that would spook investors—fewer jobs mean less consumer spending, which hurts corporate earnings and stock prices.

📈 But here’s the twist Instead of panicking, markets rallied. The Nasdaq Composite hit a record high, and the S&P 500 and Dow Jones also posted gains.

Why? Because a weaker jobs market increases the likelihood that the Federal Reserve will cut interest rates to stimulate growth. Lower rates make borrowing cheaper and boost valuations—especially for tech stocks.

🤖 AI’s role in the rally Tech firms, particularly those tied to artificial intelligence like Broadcom and Nvidia, led the charge.

The suggestion is that investors may be viewing job cuts as a sign that AI is ‘working as intended’—streamlining operations and improving margins. Salesforce and Klarna, for instance, have both reportedly cited AI as a reason for major workforce reductions.

Summary

IndicatorValue / ChangeInterpretation
Nasdaq Composite📈 21,798.70 (Record High)Tech led rally, 
investor optimism
S&P 500➕ 6,495.15Broad market strength
Dow Jones➕ 45,514.95Industrial resilience
August Jobs Report📉 Missed expectationsLabour market weakness
Job Growth (June & Aug)📉 NegativeEconomic slowdown
Investor Reaction🟢 Rate cuts expectedBullish for equities
AI Layoff Narrative🤖 ‘Efficiency gains’Tech streamlining 
Featured StocksBroadcom +3.2%, Nvidia +0.9%AI infrastructure driving
Infographic summary

So, while the jobs report paints a gloomy picture for workers, the market sees a silver lining: rate relief and tech-driven efficiency.

It’s a classic case of Wall Street optimism—where bad news for Main Street can be good news for stock prices.

The career ladder is broken—but the Nasdaq is building a rocket.

The Fed up next to move the market.

Japan’s yield curve bites back as it hits new highs!

Japan' Bond Yields

After decades of economic sedation, Japan’s long-term bond yields are rising with a vengeance.

The 30-year government bond has breached 3.286%—its highest level on record—while the 20-year yield has climbed to 2.695%, a peak not seen since 1999.

These aren’t just numbers; they’re seismic signals of a nation confronting its delayed past, now its deferred future.

Indicative Yield Curve for Japan

For years, Japan’s yield curve was a monument to inertia. Negative interest rates, yield curve control, and relentless bond-buying by the Bank of Japan created an artificial calm—a kind of economic Zen garden, raked smooth but eerily still.

That era is ending. Inflation has persisted above target for three years, and the BOJ’s retreat from monetary intervention has unleashed market forces long held at bay.

This steepening curve is more than financial recalibration—it’s a symbolic reckoning. Rising yields demand accountability: from policymakers who masked structural fragility, from investors who chased safety in stagnation, and from a society that postponed hard choices on demographics, debt, and productivity.

The bond market, once a passive witness, now acts as judge. Each basis point is a moral verdict on Japan’s economic past.

The shadows of the Lost Decades—deflation, aging populations, and overspending—are being dispelled not by command, but through the process of price discovery.

In this new era, Japan’s yield curve resembles a serpent uncoiling—no longer dormant but rising with intent.

The question isn’t whether the curve will flatten again, but whether Japan can meet the moment it has long delayed.

China-U.S. trade slump deepens as exports plunge 33%

U.S. imports from China fall in August 2025

China’s exports to the United States fell sharply in August 2025, marking a six-month low and underscoring the growing strain in global trade dynamics.

According to recent data, shipments from China to the U.S. dropped by 33% year-on-year, reflecting both weakening demand and the ongoing effects of geopolitical tensions.

This decline is part of a broader slowdown in China’s export sector, which saw overall outbound shipments contract for the sixth consecutive month.

Analysts point to several contributing factors: tighter monetary policy in the U.S., shifting supply chains, and a cooling appetite for Chinese goods amid rising tariffs and trade barriers.

Down 33%

The 33% plunge is particularly striking given the scale of bilateral trade. The U.S. remains one of China’s largest export markets, and such a steep drop signals deeper economic recalibrations.

Sectors hit hardest include electronics, machinery, and consumer goods—industries that once formed the backbone of China’s export dominance.

Economists warn that this trend could have ripple effects across global markets. For China, it raises questions about domestic resilience and the need to pivot toward internal consumption.

For the U.S., it may accelerate efforts to diversify supply chains and invest in domestic manufacturing.

The timing is also politically charged. With President Trump’s tariff policies still in effect and China navigating its own economic headwinds, trade relations remain tense.

This downturn may prompt renewed negotiations—or further decoupling.

Despite the ongoing slump in trade, the U.S. continues to be China’s largest export destination among individual countries.

The staying power of gold!

Gold

Gold’s recent surge—hitting over $3,550 per ounce (4th September 2025)—isn’t just a speculative blip.

It’s a convergence of deep structural shifts and short-term catalysts that are reshaping how investors, central banks, and governments think about value and stability.

Here’s why

🧭 Strategic Drivers (Long-Term Forces)

Central Bank Buying: Nearly half of surveyed central banks reportedly plan to increase gold reserves through 2025, citing inflation hedging, crisis resilience, and reduced reliance on the U.S. dollar.

Dollar Diversification: After Western sanctions froze Russia’s reserves in 2022, many countries began reassessing their exposure to dollar-denominated assets.

Fiscal Expansion & Debt Concerns: With U.S. debt surpassing $37 trillion and new legislation adding trillions more, gold is seen as a hedge against long-term dollar instability.

⚡ Tactical Catalysts (Short-Term Triggers)

Geopolitical Tensions: Ongoing wars, trade disputes, and questions around Federal Reserve independence have heightened uncertainty, boosting gold’s ‘fear hedge’ appeal.

Interest Rate Expectations: The Fed has held rates steady, but markets anticipate cuts. Lower yields make non-interest-bearing assets like gold more attractive.

Weakening U.S. Dollar: The dollar’s decline against the euro and yen has made gold cheaper for foreign buyers, increasing global demand.

ETF Inflows & Retail Demand: Physically backed gold ETFs saw their largest first-half inflows since 2020, while bar demand rose 10% in 2024.

Gold futures price one-year chart (December 2025 Gold)

🧮 Symbolic Undercurrent

Gold isn’t just a commodity—it’s a referendum on trust. When institutions wobble and currencies lose their shine, gold becomes the narrative anchor: a timeless, tangible vote of no confidence in the system.

Summary

🛡️ Safe Haven: Retains value during crisis.

📈 Inflation Hedge: Preserves purchasing power.

🧩 Portfolio Diversifier: Low correlation with other assets.

✋ Tangible Asset: Physical, unlike stocks or bonds.

China’s EV Price War: BYD falters as the Chinese EV machine reshapes the global car market

EV global price war

China’s electric vehicle (EV) powerhouse is rewriting the global automotive playbook—but not without homegrown company damage.

BYD, now the world’s largest EV manufacturer by volume, has been caught in the crossfire of a domestic price war.

Damaging price war

The price war is damaging margins. It is unnerving investors and revealing the perils of hyper-competition in the world’s most aggressive car market.

In Q2 2025, BYD posted a 30% drop in net profit to 6.4 billion yuan (ÂŁ700 million), its first earnings decline in over three years.

Despite a 145% surge in overseas sales, the company’s sweeping discounts across 22 models have eroded profitability at home.

Gross margins slipped to around 16%, and its Hong Kong-listed shares tumbled 8% to a five-month low.

Analysts reportedly now question whether BYD can hit its ambitious 5.5-million-unit sales target, having reached only 45% by July 2025.

The price war, ignited by BYD’s aggressive cuts in May 2025, has forced rivals like Geely, Chery, and SAIC-GM to follow suit. Entry-level EVs now start below (£6,500), with features like driver assistance and smart infotainment once reserved for premium models.

But the race to the bottom has drawn concern from regulators and industry leaders. The China Association of Automobile Manufacturers (CAAM) warned of “disorderly competition”, while executives fear quality compromises and supplier strain.

Yet even as BYD stumbles, the broader Chinese EV machine is gaining global momentum. In Europe, BYD overtook Tesla in July sales, capturing 1.1% market share versus Tesla’s 0.7%.

Chinese EV car brands account for around 10% of new UK car sales

Chinese brands now account for around 10% of new car sales in the UK. There are over 30 affordable EV models priced under ÂŁ30,000.

Their edge lies in battery supply chains, manufacturing efficiency, and software integration. Transforming cars into ‘smartphones on wheels’ tailored to digitally connected consumers.

China’s EV revolution is no longer just a domestic shake-up—it’s a global reordering. Legacy automakers are retreating from the budget segment. But Chinese firms flooding international markets with sleek, connected, and competitively priced vehicles.

BYD’s profit dip may be a temporary wobble. The long-term trajectory is clear: China isn’t just building cars—it’s building the future of mobility.

For global rivals, the message is unmistakable: adapt, or be outpaced by the dragon’s electric roar.

Infographic: China’s BYD and other EVs

Summary

BYD’s Q2 2025 net profit drop of 30% to 6.4 billion yuan: This figure aligns with recent earnings reports and analyst commentary. The drop is consistent with margin pressure from domestic price cuts.

Gross margin falling to 16.3%: Matches industry estimates for BYD’s automotive segment, which has seen compression due to aggressive discounting.

Overseas sales up 145% YoY: BYD’s international expansion—especially in Europe, Southeast Asia, and Latin America—has been rapid. This growth rate is plausible and supported by export data.

BYD reaching only 45% of its 5.5 million unit sales target by July: This tracks with cumulative delivery figures through mid-year, suggesting a potential shortfall unless H2 volumes accelerate.

Price war triggered by BYD’s cuts across 22 models in May: Confirmed by industry reports and BYD’s own promotional campaigns. Other automakers like Geely and Chery have responded with similar discounts.

CAAM warning of “disorderly competition”: This quote has appeared in official statements and media coverage, reflecting regulatory concern over unsustainable pricing.

Chinese EVs gaining market share in Europe and UK: BYD overtaking Tesla in July 2025 sales in Europe is supported by registration data. Chinese brands now account for ~10% of UK new car sales, with many models priced under ÂŁ30,000.

India’s GDP: High growth amid global headwinds

GDP India

India’s economy continues to defy gravity, posting a robust 7.8% year-on-year GDP growth in the April–June quarter of 2025—the fastest pace in five quarters.

This surge, driven by strong domestic consumption, infrastructure investment, and a booming services sector, beat market expectations and reaffirmed India’s position as the world’s fastest-growing major economy.

Government-led infrastructure spending has catalysed private investment and job creation, while the digital economy—powered by fintech and e-commerce—continues to expand India’s economic footprint.

Manufacturing grew by 7.7%, and services soared by 9.3%, with government services hitting a 12-quarter high.

Yet, external pressures loom. The reintroduction of U.S. tariffs, particularly under a potential Trump administration, could dampen export momentum and strain trade relations.

Rising oil prices and geopolitical tensions in Asia further complicate India’s economic outlook. Despite these risks, the Reserve Bank of India has held steady, managing inflation and currency volatility with precision.

India’s GDP growth isn’t just a number—it’s a narrative of resilience and reinvention. From a service-dominated model to a more balanced mix of manufacturing, tech, and green energy, the country is repositioning itself as a global economic force.

The challenge now lies in sustaining this momentum while navigating fiscal constraints and global uncertainty.

📈 Chart Highlights

QuarterGDP GrowthAction
Q2 20246.5%U.S. signals tariff reintroduction
Q3 20246.9%India negotiates trade deals
Q4 20247.2%U.S. imposes limited tariffs
Q1 20257.8%India expands export incentives

U.S. inflation holds steady in July 2025 but Core Inflation edges higher

U.S. Inflation data

The latest inflation data for the month of July 2025 shows a mixed picture for the U.S. economy, as price pressures remain persistent despite signs of cooling in some sectors.

According to the Bureau of Economic Analysis, the headline Personal Consumption Expenditures (PCE) Price Index rose 2.6% year-over-year, unchanged from June, while the core PCE index—which excludes volatile food and energy costs—ticked up to 2.9%, marking its highest annual rate since February.

On a monthly basis, core prices increased 0.3%, in line with expectations, while consumer spending rose 0.5%, suggesting households are still resilient despite elevated costs. Personal income also climbed 0.4%, reinforcing the narrative of steady wage growth.

The Federal Reserve, which uses the PCE index as its preferred inflation gauge, faces a delicate balancing act.

With inflation still above its 2% target and labor market data showing signs of softening, markets are increasingly betting on a rate cut at the Fed’s September meeting.

Fed Chair Jerome Powell, speaking at Jackson Hole, reportedly acknowledged the risks to employment but maintained a cautious tone on policy shifts.

Investors and traders alike now see an 80% chance of a quarter-point cut, keeping all eyes on upcoming jobs data.