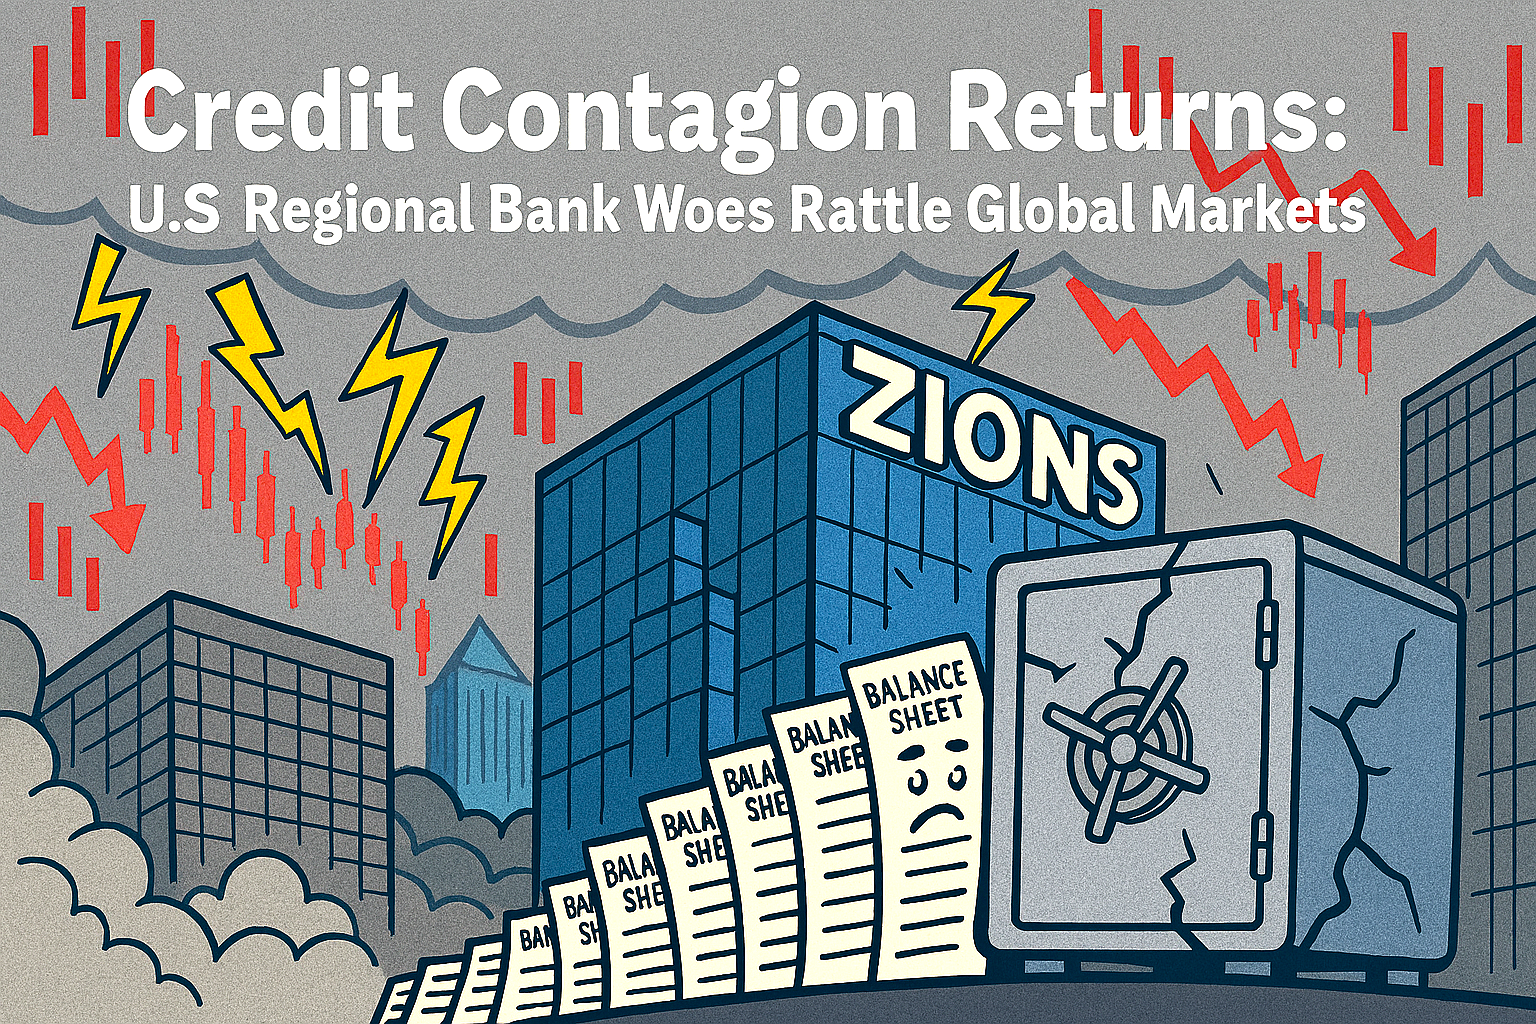
On Friday 17th October 2025, a fresh wave of credit concerns erupted across financial markets, triggered by troubling disclosures from U.S. regional lenders Zions Bancorporation and Western Alliance.
Both banks revealed significant exposure to deteriorating commercial real estate loans, reigniting fears of systemic fragility just months after the collapse of Silicon Valley Bank and Signature Bank.
The revelations sent shockwaves through Wall Street. Shares in Zions plunged over 11% in early trading, while Western Alliance dropped nearly 9%.
Larger institutions weren’t spared either—JP Morgan, Bank of America, and Citigroup all saw declines, as investors reassessed the health of the broader banking sector.
Volatile
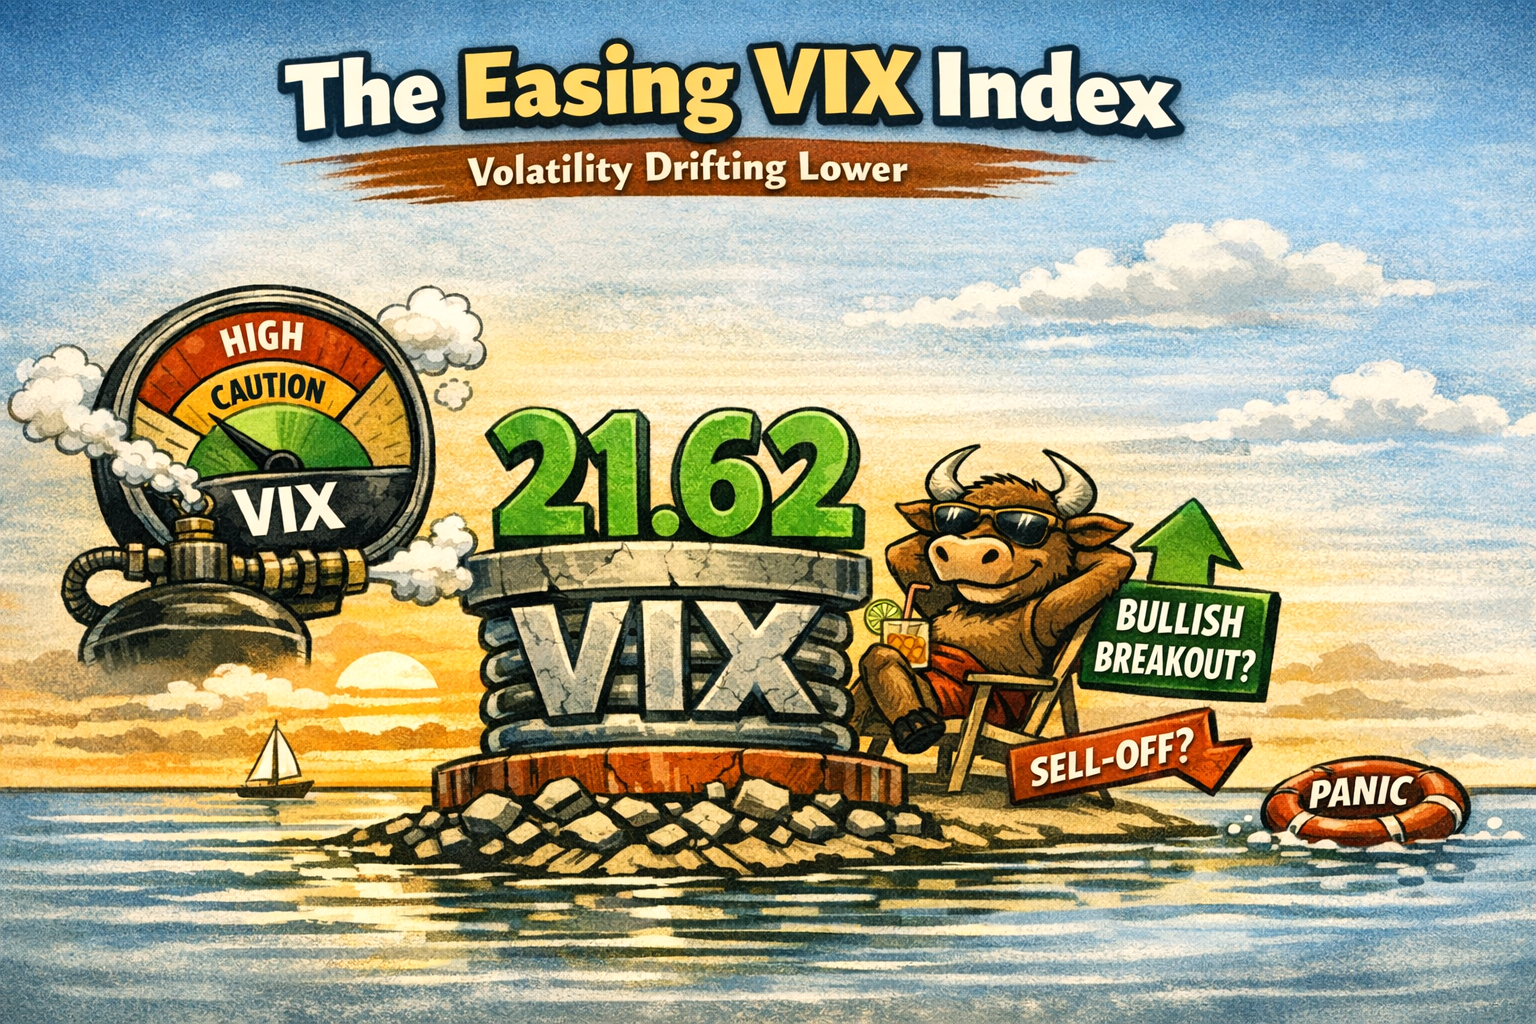
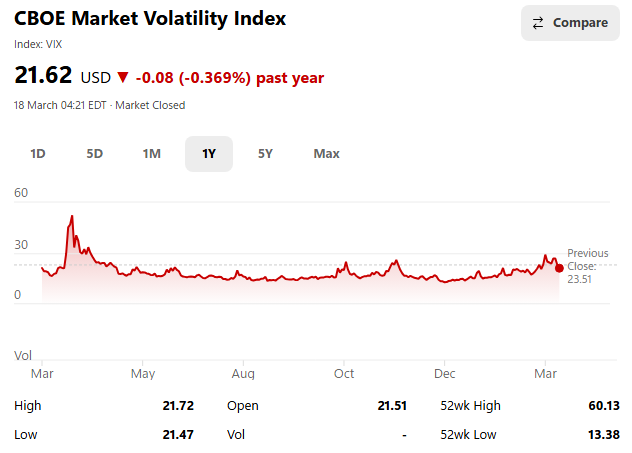
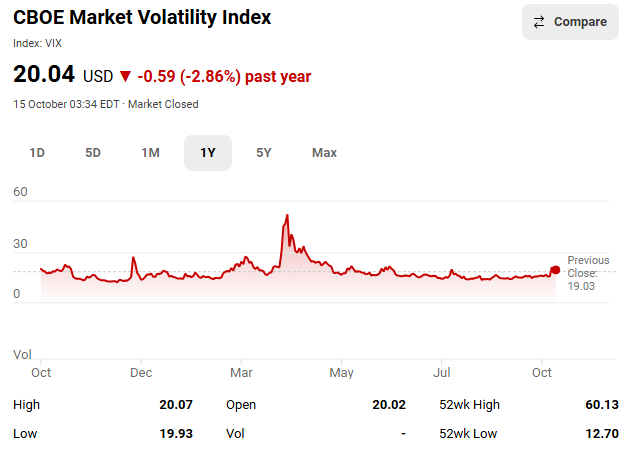
The CBOE Volatility Index (VIX), often dubbed Wall Street’s ‘fear gauge’, spiked to its highest level since April, signalling a sharp uptick in investor anxiety.
The panic quickly spread across the Atlantic. UK lenders bore the brunt of the fallout, with Barclays tumbling 6.2%, Standard Chartered down 5.4%, and NatWest shedding 4.8%.
£13 billion loss to UK banks
In total, nearly £13 billion was reportedly wiped off the value of British banks in a single trading session. The FTSE 100 closed down 1.5%, its worst performance in over a month.
At the heart of the crisis lies commercial real estate—a sector battered by high interest rates, remote working trends, and declining occupancy. U.S. regional banks, which often hold concentrated portfolios of property loans, are particularly vulnerable.
Analysts warn that rising defaults could trigger a domino effect, undermining confidence in institutions previously deemed stable.
The Bank of England’s Financial Stability Report had already flagged elevated risks from global fragmentation and sovereign debt pressures. As did the IMF Financial Stability Report.
Credit outlook review
The events of Friday 17th October 2025 appear to validate those concerns, with Moody’s and other agencies now reviewing credit outlooks for multiple institutions.
While some commentators view the sell-off as a temporary overreaction, others see it as a harbinger of deeper trouble.
The symbolic resonance is hard to ignore: vaults cracking, balance sheets buckling, and trust—once again—on the brink. Why?
For editorial observers, the moment invites reflection. Is this merely a cyclical tremor, or the start of a structural reckoning?
Either way, the illusion of resilience has been punctured. And as markets brace for further disclosures, the spectre of contagion looms large.
Remember the sub-prime loans fiasco?
I thought banks were ‘funded and ring-fenced’ more now to prevent this from happening again.