S&P 500 and Nasdaq close at new all-time highs again

S&P 500 and Nasdaq all at new highs!

The S&P 500 and Nasdaq Composite reached new closing highs on Tuesday 11th June 2024, propelled by Apple as the tech giant’s stock hit a record itself.

The S&P 500 index climbed to a new high to close at 5375, while the Nasdaq Composite finished the day at 17343. Both indices also hit new intraday highs. However, the Dow Jones Industrial Average fell by around 120 points to close at 38747.

S&P 500 reaches new all-time high on 11th June 2024

S&P 500 reaches new all-time high on 11th June 2024

Nasdaq Composite hits new all-time high on 11th June 2024

Investors seemed to be cashing in on Nvidia, a leader in artificial intelligence, and shifting focus to Apple, which recently introduced new features likely to drive a surge in iPhone upgrades.

Apple’s stock reached a new high during the trading session, its first since December 2023, with around a 7% increase. Nvidia’s stock declined by 0.7% as some profit taking ensued.

Nvidia $3 trillion market cap propels S&P 500 and Nasdaq to new all-time highs

Nvidia at $3 trillion market cap

The S&P 500 reached a new high as Nvidia surpassed the $3 trillion mark for the first time, and the anticipation of an interest rate cut grew due to softer-than-expected job data.

S&P 500 all-time high as of 5th June 2024

S&P 500 all-time high as of 5th June 2024

Similarly, the Nasdaq 100 and Nasdaq Composite achieved new record highs

Nasdaq 100 as of 5th June 2024
Nasdaq Comp as of 5th June 2024

AI boom catapults Nvidia passed Apple’s market cap’ valuation

Artificial intelligence (AI) chipmaker Nvidia passed Apple’s market cap’ to become the world’s second most valuable company after Microsoft.

Nvidia’s shares have surged 24% following its impressive earnings report in May, in contrast to Apple’s shares, which have increased by only 5% this year amid a slowdown in sales growth in recent months.

Nvidia one year share price as of 5th June 2024

Nvidia one year share price as of 5th June 2024

Nvidia Market Cap at $3.01 trillion as of 5th June 2024

Nvidia £3.01 trillion market cap’

Nasdaq 100 and Nasdaq Composite hit all-time highs on 28th May 2024


The Nasdaq Composite closed at an all-time high above 17,000 for the first time, propelled by a rise in Nvidia shares, despite a generally uneventful market day.

Nasdaq 100 all-time high of 18907

Nasdaq 100 all-time high of 18907

Nasdaq Comp hit all-time high of 17019

Nasdaq Comp hit all-time high of 17019

The S&P 500 saw a marginal increase of 0.02%. Following remarks from Minneapolis Federal Reserve President Neel Kashkari.

The Dow Jones Industrial Average dropped over 200 points.

These levels were not held and were lost over subsequent trading days as even Nvidia could not stop the Nasdaq from losing ground.

Nasdaq Composite Index hits a new all-time high on Monday 20th May 2024

Nasdaq all-time high

The Nasdaq is a stock market index predominantly comprising technology and internet-related companies. Investors and traders closely monitor its performance as it serves as a barometer for the technological sector’s robustness and the general market mood.

Nasdaq all-time high

The Nasdaq Composite surpassed its previous highest value, marking a significant milestone in its history.

Contributing factors

Tech success

The surge was propelled by robust performances from leading tech companies like Apple, Amazon, Microsoft, and Alphabet (Google).

Economic optimism

Positive economic data, the lingering promise of interest rate cuts, and optimism about future growth contributed to investor confidence.

Market sentiment

The all-time high indicates a positive sentiment in the stock market; however, it is crucial to keep an eye on current trends and potential corrections.

Note

Keep in mind that stock markets are subject to volatility, with prices capable of swift fluctuations. It’s crucial for investors to proceed with caution and take into account their individual risk tolerance before making any investment choices.

If in doubt – do nowt!

RESEARCH! RESEARCH! RESEARCH!

DOW does it – hits history high of 40000!

Dow Jones index up

The Dow Jones Industrial Average marked a historic achievement by closing above 40,000 points for the first time. On Friday 17th May 2024, the index increased by 134.21 points to settle at 40,003.59.

Concurrently, the S&P 500 saw a modest rise, while the Nasdaq Composite closed lower. The rise this week has shifted the three major stock indexes into the green for the second quarter, following a challenging start.

Despite some investors’ concerns about the sustainability of the rally, the mix of economic expansion and slowing inflation continues to act as a positive driver.

It’s an optimistic setup for the near future in 2024

FTSE 100 in record territory

The FTSE 100 soared past 8300, reaching a new record high amid busy trading as London markets reopened after the bank holiday.

A catch-up trading session is evident, with mainland-listed stocks having a robust session on Monday 7th May 2024 and continuing to rise. The FTSE reached around 8335 in intraday trading.

Wall Street also experienced another positive session, with the Dow Jones climbing for the fourth consecutive day following the Federal Reserve’s less aggressive stance, and the S&P 500 gaining too. Despite mixed results, earnings have bolstered risk appetite. The low U.S. job count has encouraged traders/investors to take heart that rate cuts will be on the agenda again soon, even if they are now late.

Bank of England

Attention will now turn to the Bank of England (BoE), which faces a decision on whether to guide the market towards a rate cut – the first in four years – or to exercise more patience. The consensus is that it’s premature for a cut this week, with August 2024 being the more likely date, although the Monetary Policy Committee’s (MPC) opinions vary.

Last month the Deputy Governor of the BoE, indicated his readiness to vote for a rate cut with little additional evidence of declining inflation, highlighting the ‘downside risks’ to the BoE’s February inflation forecast. In contrast, the Bank of England’s Chief Economist, expressed a more cautious stance in April regarding the initiation of rate cuts.

Inflation

Inflation is on a downward trajectory, expected to return to 2% in the next few months. CPI decreased from 3.4% to 3.2% between February and March 2024, and core inflation dropped from 4.5% to 4.2%. However, the BoE is likely to await April’s data before taking any decision.

Persistent wage growth of around 6% indicates continued strength in the labour market. Financial markets anticipate a Bank of England rate cut by August 2024, but it is believed the BoE may be prepared to act as early as June 2024, aligning with the anticipated policy move by the ECB.

S&P 500 hit new all-time high and Nasdaq closing in on record

S&P 500 new high

The S&P 500 surged to a new all-time high on Thursday 22nd February 2024

Microchip maker Nvidia reported much stronger-than-expected quarterly results, lifting tech sector and markets higher.

S&P 500

The S&P 500 gained just over 2% to close at 5087, notching its best day since January 2023. The Nasdaq Composite advanced 2.96% for its best day since February 2023, closing at 16041 and ever closer to its all-time high.

Nasdaq

The tech-heavy index is very close now to its all-time closing high of 16,057.44.

Dow

The Dow Jones Industrial Average surged 456 points to surpass 39000 for the first time ever and close at a new high of 39069.

Other tech names were also higher. Meta and Amazon gained about 3.9% and 3.5%. Microsoft and Netflix each advanced more than 2%.

Nvidia driving tech gains

Shares of Nvidia climbed around 16% to an all-time high after the company said total revenue rose a massive 265% from a year ago.

Nvidia, which has become one of the largest U.S. companies by market capitalization, also forecast another stellar revenue gain for the current quarter.

Nasdaq 100 hits new all-time high of 17962

Chart up

The index continues its march breaking all-time records on its way

The index continues on its march breaking all-time records on its journey

Nasdaq 100 climbs to new record 9th February 2024

A solid earnings season, easing inflation data and a resilient economy have charged 2024′s market rally. It has helped propel the Nasdaq 100 to close at these new highs!

We are enjoying good news at an economic and earnings level, and the market is reacting positively. The longer the good news story plays out, the more likely it will be that the market will hold from here.

FOMO or the fear of missing out is likely playing its part here too.

S&P 500 closes above 5000 for the first time

Stoks chart up

The S&P 500 climbed to a new all-time high of 5026 on 9th February 2024

Stocks rose on Friday 9th February 2024 after December’s revised inflation reading came in lower than first reported, and the S&P 500 closed above the key 5,000 level as strong earnings and economic news came in.

A solid earnings season, easing inflation data and a resilient economy have charged 2024′s market rally. It propelled the S&P 500 to close above the 5,000 level after first touching the milestone during the trading week. The index first crossed 4,000 in April 2021.

We are enjoying good news at an economic and earnings level, and the market is reacting positively. The longer the good news story plays out, the more likely it will be that the market will hold from here.

But it won’t take much to spoil the party, right now I don’t know what that might be…?

S&P 500 1-year chart 9th February 2024 – new all-time high of 5026

S&P 500 1 year chart 9th February 2024 – new all-time high of 5026

FOMO or the fear of missing out is likely playing its part here too.

All hail the rally?

U.S. stocks rally

U.S. stocks have had a good year in 2023, and a great start to 2024 with new record highs being set.

Many major indices have recorded double-digit gains. However, some analysts have warned that the rally may not last, as it has been driven by a few large-cap technology and growth stocks, while many other sectors and regions have lagged behind. 

A stock market rally is a broad and rapid rise in share prices, often defined as a 20% increase from a recent low. 

This could indicate a lack of breadth and sustainability in the rally, and potentially signal a market pullback, correction or even a crash in the future.

Bull bear, bull?

Chartists with their technical analysis might see a pattern that points to a substantial upside, but they should not get too carried away with their own observations, right now would be a sensible time for markets to find level ground, if only temporarily. 

The bullish view is that the ‘laggards’ should catch up the ‘mega cap’ stalwarts once again. The bearish view is that the ‘mega cap’ stocks’ will realise they’ve gone too far and need to ride back to the rest of the market. Too few stocks in the same sector hold the balance of power – go check out the Magnificent 7 or even the old FANG stocks.

Catch-up

Either way, there ought to be an opportunity for underrepresented sectors and industries to gain lost ground.

The question is, will there be a pause to allow laggards to catch-up, or will the mega caps simply continue on their march?

S&P 500, Nasdaq 100 and Dow all hit new highs!

S&P 500, Nasdaq 100 and Dow all up at new highs!

The S&P 500 climbed again Wednesday 7th February 2024 and edged ever closer to the 5,000 level.

S&P 500 hit a new high of 4995

S&P 500 hit a new high of 4995 on 7th February 2024

The index, which first breached the 4,000 level in April 2021, added around 0.82% to close at 4,995.06. During session highs, the S&P hit 4,999.89. Quarterly results signalled a thriving U.S. economy.

The Nasdaq 100 jumped to a new high of 15,755

The Nasdaq 100 jumped to a new high of 15,755 on 7th February 2024

The Dow Jones Industrial Average rallied 156 points to close at 38,677 and an all-time high

DJIA closes at new high of 38677 on 7th February 2024

Euphoric

Are investors getting swept away with the latest wave of AI related tech results? Quite possibly, as some of what we’re seeing could be based on FOMO (fear of missing out) as traders/investors don’t want to be left behind like they were last year.

However, one undeniable fact is that the U.S. economy isn’t facing as recession any time soon as predicted by many.

December 2023 U.S. inflation data came in higher-than-expected

U.S. December inflation

Stocks moved lower Thursday 11th January 2024, reflecting the higher-than-expected December 2023 inflation data.

The S&P 500 in early trade edged lower by around 0.7%, while the Nasdaq Composite dropped nearly 0.8%. The Dow Jones Industrial Average dropped by 0.6%. The S&P 500 briefly touched 4800 after climbing above its record high of 4,796.

Higher than expected

December’s consumer price index figure came out slightly higher-than-expected, reflecting a 0.3% increase in consumer prices for the month, pushing the annual rate to 3.4%.

Core CPI, excluding volatile food and energy prices, came out in line with expectations, however, pointing to persistent, but easing inflation pressures. The new inflation data figures suggests that future interest rate cuts may be slower to come.

This move up in CPI is an absolute reminder of the unpredictable nature of economic recovery.

Sudden sell-off confounds analysts – is it profit taking or economic woe?

Wall Street

The Nasdaq and Dow hit new all-time highs in recent days and the S&P 500 is hot on their heels.

After nine straight days of gains, Wall Street suddenly reversed an hour and a half before the closing bell on Wednesday 20th December 2023.

The sell-off expanded into Asia overnight, with Japan’s Nikkei 225 leading losses, before stocks across Europe also slid into the red on the Thursday morning, 21st December 2023.

Some indicated Wednesday’s sell-off was as simple as investors taking profits after a nine-day mini bull run, in the absence of any obvious catalyst and with U.S. stocks widely seen as overbought.

Other market analysts pointed to a high volume of zero-day options trading as the death knell for the winning streak.

Time left for a Santa rally?

Markets have been on a tear in recent eeks and months, maybe it’s time for a breather. But some suggest U.S. equities are overbought in general – so, is this something more discerning?

Latest U.S. job data indicates that job growth accelerated by 199,000

Work

The latest U.S. job data indicates that job growth accelerated in November 2023, with seasonally adjusted non-farm payrolls increasing by 199,000. 

The unemployment rate has dropped to 3.7%, even as more workers entered the labour market. This points to underlying strength in the labour market and is a positive sign for the U.S. economy. 

U.S. job creation chart January 2022 – November 2023

U.S. job creation chart January 2022 – November 2023

Stocks had risen as investors awaited these latest employment figures, which are closely watched as an indicator of potential moves by the central bank on interest rates.

Mixed reaction

Markets showed a mixed reaction to the report, with stock market futures modestly negative while Treasury yields surged. Job creation showed little signs of slowing as payrolls grew even faster than expected and the unemployment rate fell despite signs of a weakening economy.

Good news for the U.S. economy but Treasury yields are on the up again.

If profit growth accelerates over the next two quarters – is it wise to buy the dip now?

Stocks roller coaster

Some analysts say yes!

Buying the dip means purchasing an asset, usually a stock, when its price has dropped. The expectation is that the drop is a short-term anomaly, and the asset’s price will soon go back up. It is a strategy that some traders and investors use to take advantage of price fluctuations and profit from market rebounds. 

However, buying the dip can also be risky, as there is no guarantee that the price will recover or that the asset is not in a long-term downtrend. Therefore, it is important to do your research, use indicators, and have a risk management plan before buying the dip.

Current market situation and general ‘readout’

The S&P 500 is still ‘buy the dip’ for the next six months,’ some analysts suggest.

In some reports, it is expected that the profit cycle will be positive over the next six months and for data to improve before a consumer-spending led downturn leads to a selloff in U.S. stocks! That’s the ‘general’ readout.

Corporate profit expectations are behind much of that forecast for stocks. Analysts expect profit growth to accelerate over the next two quarters and see the S&P 500 in a range of 4,050 to 4,750. A mild recession in early or middle 2024 should lead to a higher risk premium, pushing the S&P 500 back close to 3,800. This is all conjecture.

Other analysts doubt the earnings uplift potential and anticipate stocks to fall back sooner as PE ratios sit at an already high level.

Take your pick

My view, for what it’s worth, is for stocks to climb for the time being through into the New Year and then to face pullback.

Truth is, no one knows. We can all make educated guesses.

Just watch the markets and be ready for the fall – that is coming for sure!

Dow up 300 points Friday, 6th October 2023 as stocks reverse sharp losses

Nasdaq

Stocks rallied Friday 6th October 2023 even after the release of stronger-than-expected U.S. jobs data and an increase in Treasury yields.

The U.S. economy added 336,000 jobs in September 2023, the Labour Department said. Economists expected 170,000 jobs. 

Confused?

Stocks posted a surprise turnaround on Friday, 6th October 2023 after initially falling on a hotter-than-expected jobs report. At its session low, the Dow had fallen some 270 points, then surged by more than 400 points at in intraday trading. The Nasdaq and the S&P 500 also lost ground too only but then quickly recovered the losses.

Unclear

Traders were unclear as to the reason for the intraday reversal. Some noted it could be the softer wage number in the jobs report that made investors rethink their earlier bearish stance. Others noted the pullback in yields from the day’s highs.

Rally

The rally may just be because the market had been extremely oversold with the S&P 500 at one point in the week down more than 8% from its high earlier this year.

Yields initially surged after the report, with the 10-year Treasury rate trading near its highest level in 16 years. The benchmark rate later eased from those levels, but was still up around 6 basis points at 4.78%.

Extreme market movements maybe here for a while yet.

U.S. stock market volatility continues

Yields

The stock market has been experiencing some volatility and uncertainty in September and October 2023, as investors fret about inflation, interest rates, and the possibility of a U.S. recession.

Main facts affecting the current stock market

The month of October has produced some severe stock market crashes over the past century, such as the Bank Panic of 1907, the Wall Street Crash of 1929, and Black Monday 1987.

October has also marked the start of several major long-term stock market rallies, such as Black Monday itself and the 2002 nadir of the Nasdaq-100 after the bursting of the dot-com bubble.

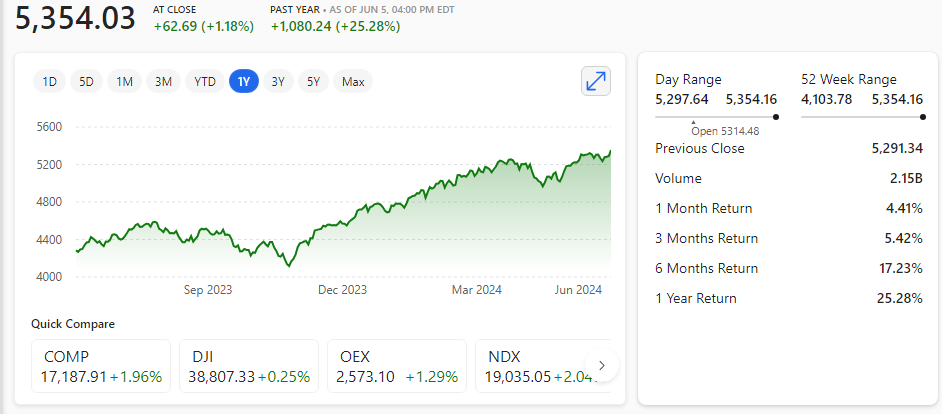
The S&P 500 dropped 4.5% in September 2023 and finished the third quarter in the red.

The U.S. Treasury yield curve has been inverted for months – which is a historically strong recession indicator.

The Fed maintained interest rates at the current target range of between 5.25% and 5.5% in September 2023, but signalled that it may need to raise rates again to combat inflation.

The consumer price index gained 3.7% year-over-year in August 2023, down from peak inflation levels of 9.1% in June 2022 but still well above the Fed’s 2% long-term target.

The bond market is currently pricing in an 81.7% chance the Fed will choose not to raise rates again on 1st November 2023.

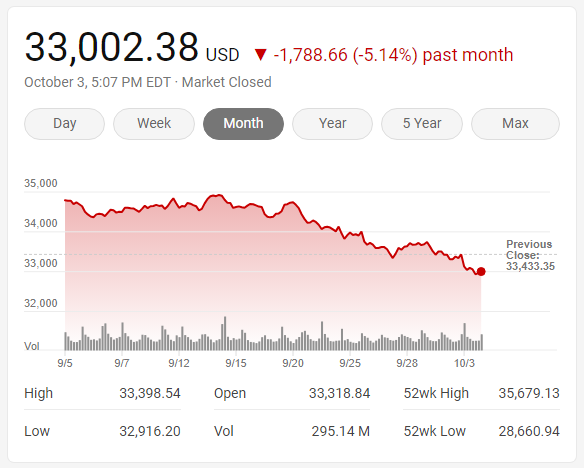
Wall Street closed down on 3rd October 2023 as the yield on the U.S. 10-year treasury rose to 4.80%, reaching its highest level since 2007.

The Dow Jones Industrial Average was down at 33002, Tuesday 3rd October 2023.

Stocks fell as investors pulled money from equities and moved it to the hot bond market.

International markets also faced significant turmoil, sending mini shockwaves through global financial centres, which reverberated in equities.

The dollar rose to the highest since December and is heading towards the twelfth positive week in a row.

Uncertainty

Uncertainty in the U.S. political system is having a major affect too. Especially with the ousting of the speaker and the real fear of a government shutdown looming large.

An August U.S. stock market stumble, or more?

Eurozone interest rates

August typically a rocky month

The U.S. stock market has experienced a 5.6% slide for the S&P 500 index over 15 trading sessions through 17th August 2023 and levelling off in the last trading day of that week. 

This is about as bad as August typically gets, as August is a rocky month with low volume and high volatility. Some of the reasons for the pullback include the rise in the 10-year Treasury yield, the strengthening of the U.S. dollar, and the signs of a slowing Chinese economy.

Pullback temporary for August?

However, some analysts argue that the pullback will likely prove to be temporary and not turn into a serious market rout. It has been suggested that the bull run isn’t quite over just yet, and that a 10% ‘pullback’ was on the cards.

Analysts also suggest that the rise in yields would need to threaten a serious shift or there would need to be an additional shock to cause a larger selloff. 

NASDAQ

NASDAQ drops some 7% in one month from 19th July – 18th August 2023

However, some suggest that the market is showing signs of stability, as the speed of the surge in the 10-year yield often occurs near the end of a selling cycle for equities. Investors should watch for indicators such as oil prices, wage pressures, and inflation expectations to gauge the market sentiment.

The S&P 500 and the Dow levelled off the week at the close of trading Friday 18th August 2023.

The NASDAQ did score its best first half of the trading year since 1983 January to June 2023 so a pullback was likely to happen.