The staying power of gold!

Gold

Gold’s recent surge—hitting over $3,550 per ounce (4th September 2025)—isn’t just a speculative blip.

It’s a convergence of deep structural shifts and short-term catalysts that are reshaping how investors, central banks, and governments think about value and stability.

Here’s why

🧭 Strategic Drivers (Long-Term Forces)

Central Bank Buying: Nearly half of surveyed central banks reportedly plan to increase gold reserves through 2025, citing inflation hedging, crisis resilience, and reduced reliance on the U.S. dollar.

Dollar Diversification: After Western sanctions froze Russia’s reserves in 2022, many countries began reassessing their exposure to dollar-denominated assets.

Fiscal Expansion & Debt Concerns: With U.S. debt surpassing $37 trillion and new legislation adding trillions more, gold is seen as a hedge against long-term dollar instability.

⚡ Tactical Catalysts (Short-Term Triggers)

Geopolitical Tensions: Ongoing wars, trade disputes, and questions around Federal Reserve independence have heightened uncertainty, boosting gold’s ‘fear hedge’ appeal.

Interest Rate Expectations: The Fed has held rates steady, but markets anticipate cuts. Lower yields make non-interest-bearing assets like gold more attractive.

Weakening U.S. Dollar: The dollar’s decline against the euro and yen has made gold cheaper for foreign buyers, increasing global demand.

ETF Inflows & Retail Demand: Physically backed gold ETFs saw their largest first-half inflows since 2020, while bar demand rose 10% in 2024.

Gold futures price one-year chart (December 2025 Gold)

🧮 Symbolic Undercurrent

Gold isn’t just a commodity—it’s a referendum on trust. When institutions wobble and currencies lose their shine, gold becomes the narrative anchor: a timeless, tangible vote of no confidence in the system.

Summary

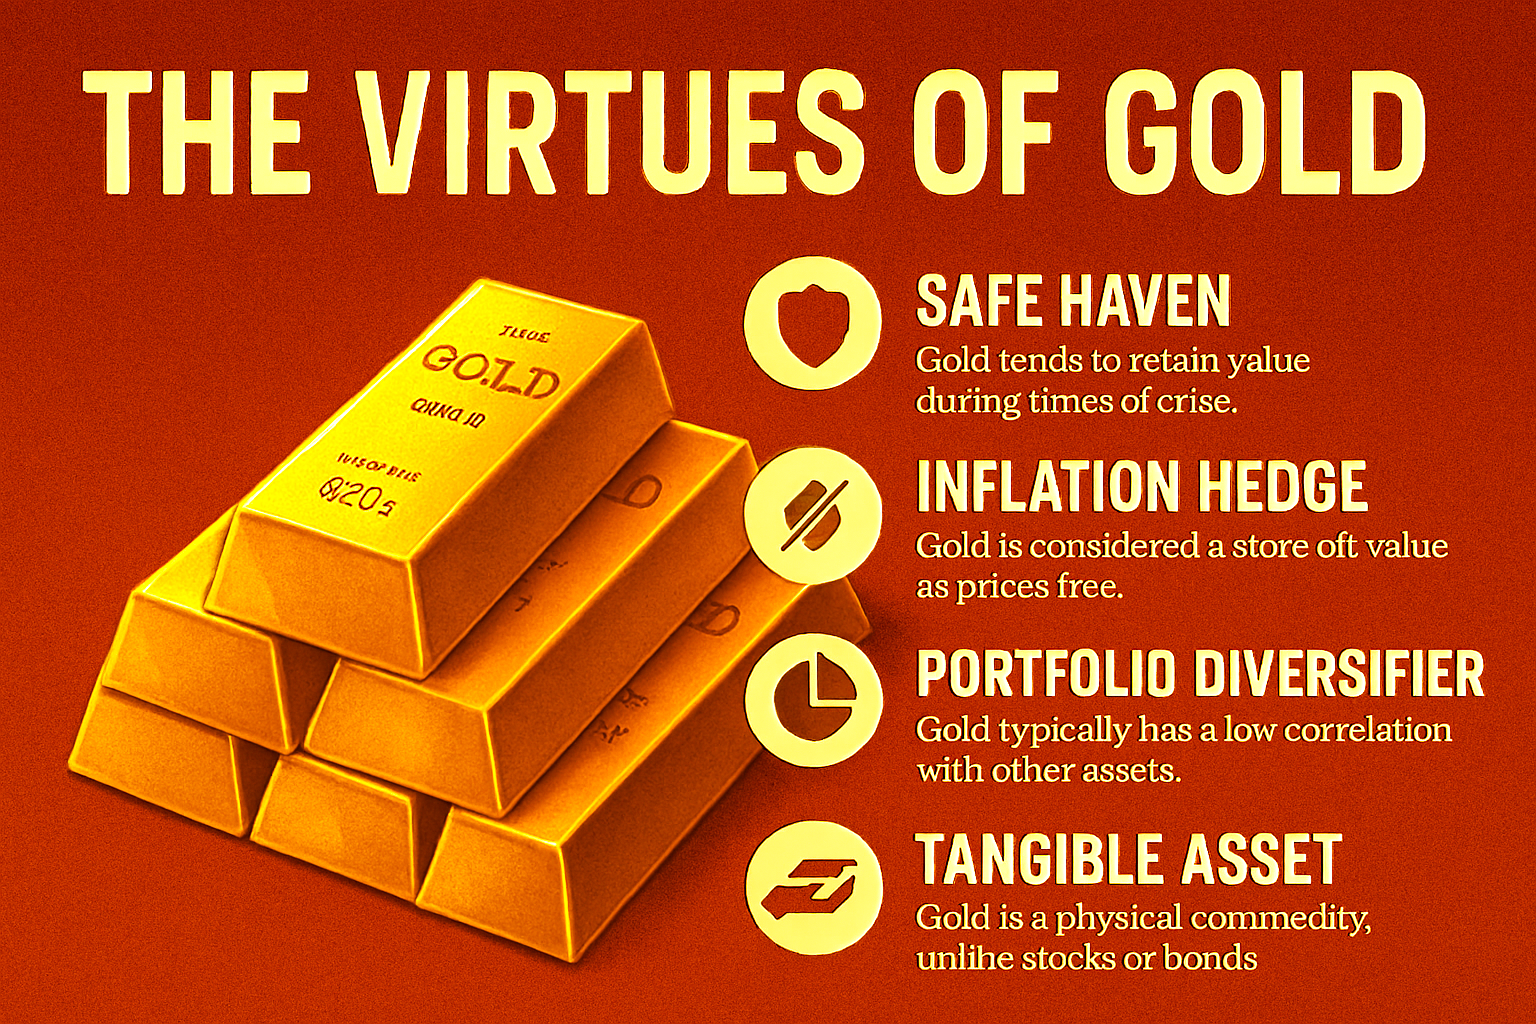
🛡️ Safe Haven: Retains value during crisis.

📈 Inflation Hedge: Preserves purchasing power.

🧩 Portfolio Diversifier: Low correlation with other assets.

Tangible Asset: Physical, unlike stocks or bonds.

Asia’s shift away from the U.S. Dollar gains momentum

De-dollar

The global financial landscape is undergoing a significant transformation as Asian economies accelerate their move away from the U.S. dollar.

This trend, known as de-dollarisation, is driven by a combination of geopolitical uncertainties, monetary policy shifts, and efforts to reduce reliance on the greenback in trade and investment.

The forces behind de-dollarisation

For decades, the U.S. dollar has dominated global trade and foreign exchange reserves. However, its share in global reserves has steadily declined from over 70% in 2000 to 57.8% in 2024.

This shift is particularly pronounced in Asia, where nations are actively promoting the use of local currencies to mitigate exchange rate risks and strengthen regional financial stability.

The Association of Southeast Asian Nations (ASEAN) has committed to increasing local currency settlements in trade and investment as part of its Economic Community Strategic Plan for 2026-2030.

Additionally, major economies like China and India are developing alternative payment systems to bypass traditional dollar-based transactions, further reducing dependency on the greenback.

Implications for the U.S. Dollar

The dollar has faced increased volatility, with a sharp 8% decline in the dollar index since the start of 2025. Investors and policymakers are recognising that the dollar can be leveraged in trade negotiations, prompting a reassessment of portfolios overweight in U.S. assets.

While the dollar remains the world’s primary reserve currency, its dominance is being challenged. Asian economies, particularly Singapore, South Korea, Taiwan, and China, hold substantial foreign assets, giving them the ability to repatriate earnings into local currencies.

The shift away from the dollar is a slow but steady process, signalling a broader transition towards a multipolar financial system.

Crypto and DeFi are playing a growing role in de-dollarisation.

Many nations, particularly within BRICS, are turning to digital assets to reduce reliance on the U.S. dollar in global trade.

How crypto supports de-dollarisation

Alternative Payment Systems – Cryptocurrencies like Bitcoin and Ethereum allow countries under U.S. sanctions to bypass traditional dollar-based financial systems.

Central Bank Digital Currencies (CBDCs) – Over 130 countries are exploring CBDCs to strengthen local currency transactions and reduce dependence on the dollar.

Stablecoins & Cross-Border Trade – Stablecoins such as USDT and USDC facilitate international payments, with daily transaction volumes exceeding $150 billion.

The bigger picture

The shift away from the dollar is not just about crypto – it’s part of a broader movement toward a multipolar financial system.

While digital assets provide alternatives, traditional financial institutions are also adapting by promoting local currency settlements

Global markets slide into chaos as Trump pushes his ‘America First Agenda’

U.S. tariffs

Global markets have been thrown into turmoil following the announcement of sweeping tariffs by U.S. President Donald Trump

U.S. tariffs, which include a 25% levy on imports from Canada and Mexico and a 10% increase on Chinese goods, have sparked fears of a global trade war. Retaliatory measures from Canada and China have only added to the uncertainty, sending shockwaves through financial markets worldwide.

The FTSE 100, London’s blue-chip index, fell by 1.3%, marking its steepest decline since October last year. Across the Atlantic, Wall Street saw significant losses, with the S&P 500 dropping 1.6% and the Dow Jones Industrial Average falling 1.7%. European markets were not spared, as Germany’s DAX and France’s CAC 40 plunged by 3.5% and 2.1%.

Investors are increasingly concerned about the long-term implications of these tariffs. The measures threaten to disrupt global supply chains, inflate costs, and dampen economic growth. Analysts warn that prolonged trade tensions could push the global economy closer to a recession.

The tariffs have also had a notable impact on currency markets. The U.S. dollar weakened against major currencies, with the pound rising to a six-week high of $1.27. Meanwhile, safe-haven assets like gold saw a surge in demand, with prices climbing above $2,900 per ounce.

Oil markets were not immune to the fallout, as Brent crude futures dropped to a three-month low of $70.65 per barrel. The decline reflects growing concerns over reduced demand amid escalating trade tensions.

As the world braces for further economic uncertainty, the focus now shifts to how global leaders will navigate these turbulent waters.

The stakes are high, and the path forward remains uncertain.

Trump U.S. election win drives gold price down and Crypto up!

Gold prices have fallen to near a two-month low as the dollar strengthens in the wake of Donald Trump’s election victory last week.

This downturn has halted the bullion’s rally, which had achieved a series of record highs over the past year. Gold has seen a decline in six of the seven most recent trading sessions following Trump’s win, interrupting its streak of record-breaking milestones over the last twelve months.

On the other hand, Crypto has relished the Trump pump with Bitcoin and many altcoins setting new all-time highs!

Gold price charts – 3 month and one-year snapshot as of: 15th November 2024 (08:10 GMT)

China’s exports and imports came in less than expected in September 2024 – missing targets

China exports and imports

China’s exports increased by 2.4% in September 2024 compared to the previous year when measured in U.S. dollars, and imports saw a rise of 0.3%, customs data showed Monday 14th October 2024

The figures fell short of expectations. China’s exports were predicted to rise by 6% year-on-year in September 2024, measured in U.S. dollars, as per reported analysts’ data. This increase would be less than the 8.7% rise seen in August 2024.

Imports were also projected to grow by 0.9% in September from the previous year, based on analysts’ data, which would be a slight uptick from the 0.5% growth in August 2024.

Exports have been a highlight for China’s economy amidst subdued consumer spending and a downturn in real estate.

According to reported analysis of the official data, China’s exports to the U.S., its biggest trading partner, went up by 2.2% in September year-on-year, while imports from the U.S. saw a 6.7% increase.

Yuan hits strongest level against U.S. dollar in over 16 months

Dollar vs Yuan

China’s yuan hit its strongest level in over 16 months on Wednesday 25th September 2024 after Beijing unveiled a slew of stimulus measures to shore up the slowing economy on Tuesday 24th September 2024.

The Chinese yuan had weakened against the U.S. dollar over the last several weeks, as the dollar strengthened, and as investors fretted about China’s economic growth prospects pre-stimulus measure.

Unlike the Fed’s focus on a main interest rate, the PBOC uses a variety of rates to manage monetary policy.

Pound hits highest level versus dollar for a year

Pound Sterling

The pound reached its highest level against the dollar in a year on Wednesday 17th July 2024, as investors wagered that UK interest rates would remain elevated for longer.

New data released on Wednesday 17th July 2024 indicated that inflation was more persistent than some analysts had anticipated, leading traders to reduce their expectations of a rate decrease in August 2024, propelling the pound above $1.30 for the first time since the previous July.

Additionally, the pound’s strength has been supported by market optimism that the newly elected Labour government will provide economic stability.

Japanese yen slumps to fresh 38-year low against the U.S. dollar

Yen slumps against dollar

On Friday 28th June 2024, the Japanese yen dropped to its lowest point in 38 years, surpassing the 161 threshold against the dollar reached for the first time since December 1986.

The yen has faced challenges, slipping beyond the 160 mark again.

Since the Bank of Japan concluded its negative interest rate policy and reportedly abandoned its yield curve control policy in March 2024, the yen has been on a consistent decline.

After this policy change, the yen breached the 150 level against the U.S. dollar and hit 160 in late April 2024, which prompted intervention by the country’s finance ministry.

Bad economic news can be good for stocks

Bad news and good news

Bad economic news appears to have had an interesting impact on the stock market recently.

Traditionally, negative economic data might be anticipated to result in falling stock prices; however, recent trends have diverged from this norm.

News trend

In the past two months, negative economic news has had a paradoxically positive effect on equities. Investors have responded well to poor economic indicators, partly due to the belief that these could lead the Federal Reserve to begin reducing interest rates.

Dollar and the stock market

In recent times, the S&P 500, a large-cap equity index, and the U.S. dollar have exhibited a nearly perfect correlation. As the dollar has seen a gradual decline, the stock market has conversely experienced a rise. Typically, investors flock to the security of cash, and consequently the dollar, in times of uncertainty, yet they also channel investments into stocks upon the arrival of favourable news.

Economic data

Despite the upbeat trend in the stock market, real economic data has frequently fallen short of Wall Street’s predictions. The Citi Economic Surprise Index, a gauge that compares data to expectations, has been on a downward trajectory. This suggests that expectations have been surpassing the actual economic conditions, signalling that the economic situation may not be as favorable as previously thought.

Dilemma for the Fed

The Federal Reserve methodically reviews economic indicators to influence their interest rate decisions. Typically, unfavorable economic reports might prompt the Fed to reduce rates, unless there’s an uptick in inflation. Escalating inflation generally nudges the Fed towards a tighter monetary policy.

Monthly data roll-out

Data concerning the U.S. labour market presented to the Fed and markets may create that ‘pivotal’ moment – it often does – markets move of Fed comments and ‘awaited’ news. Reports detailing job openings, private sector job creation, and the Bureau of Labour Statistics’ nonfarm payrolls will shed light on the economy’s condition.

If job growth remains within the ‘Goldilocks range’ (neither too strong nor too weak), it may preserve the fragile equilibrium where unfavourable economic news has paradoxically favoured stock prices, while preventing excessive gloom.

Conclusion

To summarize, although adverse economic news has lately been advantageous for stock markets, monitoring this precarious balance is crucial. Excessive pessimism could be a harbinger of impending difficulties, despite its current benefits.

Note about Citigroup Economic Surprise Index

The Citigroup Economic Surprise Index is the sum of the difference between the actual value of various economic data and their consensus forecast. If the index is greater than zero, it means that the overall economic performance is generally better than expected, and the S&P 500 has a high probability of strengthening, and vice versa.

Is the shine returning for gold as investors place bets on rate cuts?

Gold

Gold prices on Monday 27th November 2023 climbed to a more than six-month high as the U.S. dollar weakened.

Investors, it is reported, have placed their bets, suggesting the Federal Reserve is finished with interest rate hikes.

Gold was up around 0.52% at $2,012 per ounce in early afternoon trading (London time). It reached a high of $2,017.82 earlier in the day. Gold futures for December 2023 hit $2,018.90 according to analysts’ data.

CME Fed watch tool

The dollar index, a measure of the greenback against major currencies, was 0.13% lower as markets price in a more than 90% chance the Fed will hold rates at its next two meetings.

Analysts at Goldman Sachs reportedly said that the outlook for 2024 is that gold’s ‘shine is returning’.

The potential upside in gold prices will be closely tied to U.S. real rates and dollar moves.

UK pound closes in on a six month low

GB Pound Sterling


According to the latest data, 1.00 GBP is equal to 1.22 USD

This means that one British pound can buy 1.22 U.S. dollars at the current market rate. The exchange rate fluctuates depending on various factors such as supply and demand, interest rates, inflation, trade balance, and political stability.

Weak against U.S. dollar

The British pound has been weakening against the U.S. dollar since the Brexit referendum in 2016, when the UK voted to leave the European Union. The uncertainty and instability caused by the Brexit process have reduced the confidence and attractiveness of the British currency in the global market. The U.S. dollar, on the other hand, has been strengthening due to its status as a safe haven and a reserve currency in times of crisis.

In September 2022 the pound fell to its lowest level against the U.S. dollar

  • Excessive government spending and tax cuts that undermined confidence in the UK economy.
  • Price caps and record high inflation that eroded the purchasing power of the pound.
  • The strength of the dollar as a safe haven currency amid global uncertainty.
  • The prospect of a new Scottish independence referendum that increased political risk.
  • The impact of the Covid pandemic and the Russia-Ukraine conflict on supply chains and trade.

Artwork of GBP

GB Pound £
UK pound closes in on a six month low

September 2022

The pound reached $1.0327 at one point in late September 2022, its lowest since Britain went decimal in 1971. It also fell more than 1% against the euro to about 86.80p, its lowest level since May 2020.

Today, 22nd Septmber 2023

The current exchange rate of 1.22 USD per GBP is near the lowest point in the last 30 and 90 days, which was 1.2383 USD per GBP

The highest point in the same period was 1.3128 USD per GBP. The average exchange rate in the last 30 days was 1.2563 USD per GBP, and in the last 90 days was 1.2721 USD per GB pound.

Pound Sterling from 2012 – 2023