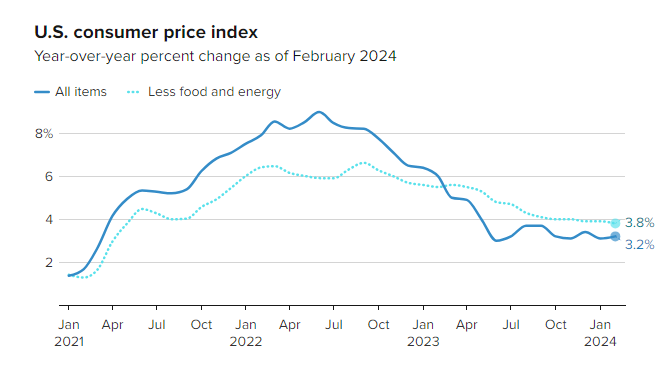
The latest U.S. inflation figures show a modest increase in consumer prices. The annual rate rose to 3.0% in September 2025, up from 2.9% in August. 2025.
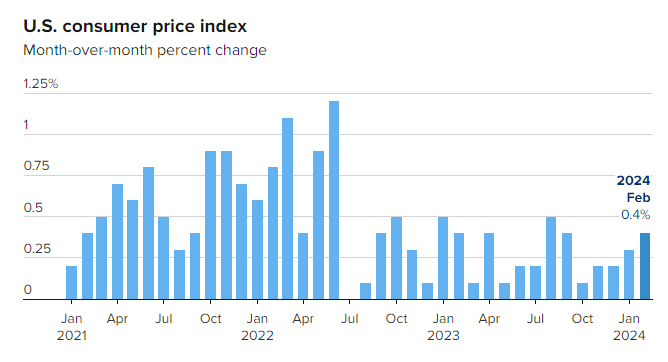
According to the U.S. Bureau of Labor Statistics, the Consumer Price Index (CPI) increased by 0.3% month-on-month, slightly below economists’ expectations.
Core inflation—which excludes volatile food and energy prices—also rose by 0.2% in September. This brought the year-on-year rate to 3.0%, again undercutting forecasts of 3.1%.
A notable contributor to the headline figure was a 4.1% surge in petrol prices. This offset declines in other areas such as used vehicles and household furnishings.
Federal Reserve
The data arrives just ahead of the Federal Reserve’s next policy meeting, where a 0.5% rate cut is widely anticipated. Softer inflation readings have buoyed market sentiment, with futures posting gains on hopes of looser monetary policy.
Despite a partial government shutdown, the inflation report was released on schedule, underscoring its significance for financial markets and policymakers.
With inflation now hovering near the Fed’s target, attention turns to wage growth and consumer spending as key indicators of future price stability.
The next CPI update is due mid-November.
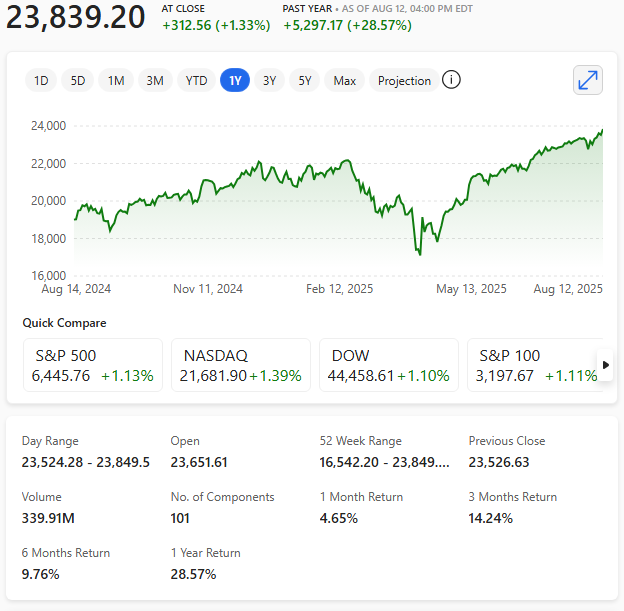
This CPI news added to the possibility of a Fed rate cut in conjunction to the possibility of a U.S. China ‘tariff trade’ deal and relaxation of Rare Earth material sales pushed markets to new all-time highs!