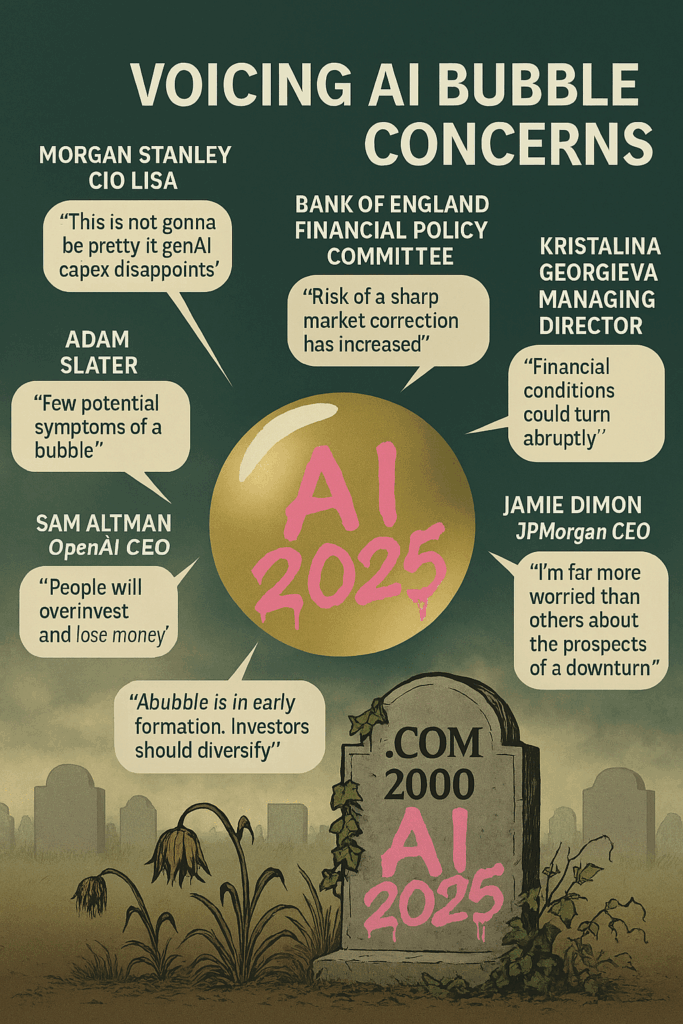
The sense of unease rippling through global markets has grown steadily louder, and now several veteran analysts reportedly argue that the rally of 2025 may be running out of steam.
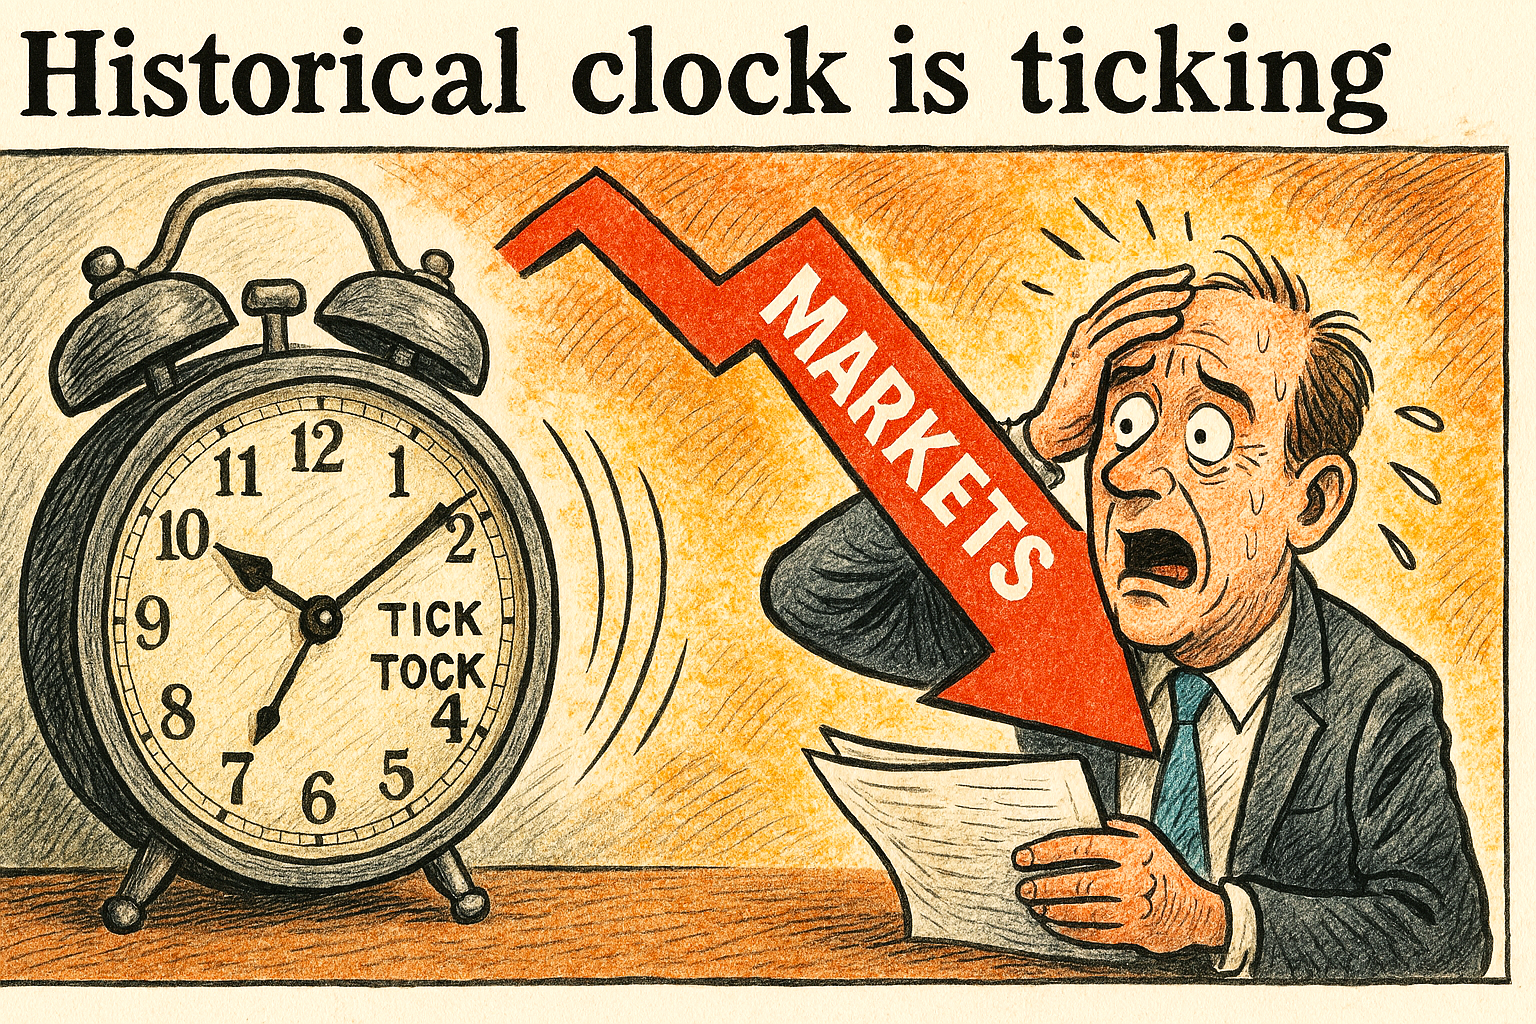
Their warning is stark: the ‘historical clock is ticking’, and the conditions that typically precede a broad market correction are increasingly visible.
Throughout 2025, equities surged with remarkable momentum, fuelled by resilient corporate earnings, strong consumer spending, and a wave of optimism surrounding technological innovation.
Weakening
Yet beneath the surface, the foundations of this rally have begun to look less secure. Analysts reportedly highlighted that geopolitical risks are approaching an inflection point, creating a fragile backdrop in which even a modest shock could tip markets into correction territory.
One of the most pressing concerns is valuation. After a year of exceptional gains, many global indices now appear stretched relative to historical norms.
When markets price in near‑perfect conditions, they leave little margin for error. Any deterioration in earnings, policy stability, or global trade dynamics could prompt a swift reassessment of risk.
This is precisely the scenario experts fear as 2026 unfolds.
Geopolitics
Geopolitics adds another layer of complexity. Rising tensions across key regions, shifting alliances, and unpredictable policy decisions have created an environment where sentiment can turn rapidly.
Some strategists emphasise that these pressures are converging at a moment when markets are already vulnerable, increasing the likelihood of a meaningful pullback.
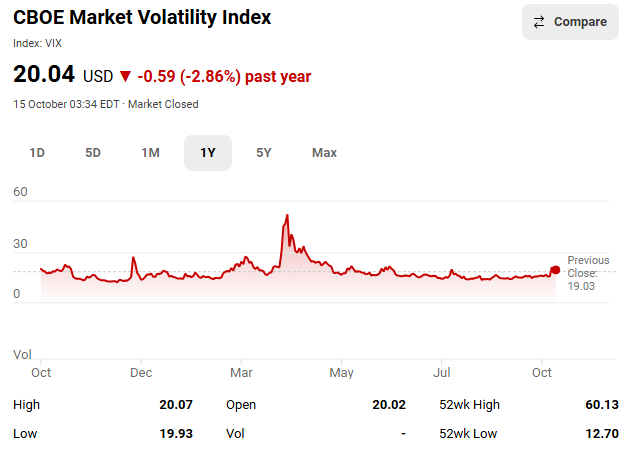
Technical indicators also point towards late‑cycle behaviour. Extended periods of low volatility, accelerating sector rotations, and narrowing market leadership are all hallmarks of a maturing bull run.
While none of these signals guarantee a correction, together they form a pattern that seasoned investors recognise from previous cycles.
Don’t panic?
Despite the warnings, experts are not advocating panic. Corrections, they argue, are a natural and even healthy part of market dynamics.
They reset valuations, curb excesses, and create opportunities for disciplined investors. The key is preparation: reassessing risk exposure, diversifying across sectors and geographies, and avoiding over‑concentration in the most speculative corners of the market.
As 2026 begins, the message from analysts is clear. The rally of 2025 was impressive, but it may also have been the calm before a necessary storm.
Whether the correction arrives swiftly or unfolds gradually, the prudent approach is to stay alert, stay balanced, and recognise that even the strongest markets cannot outrun history forever.
A healthy correction is overdue.