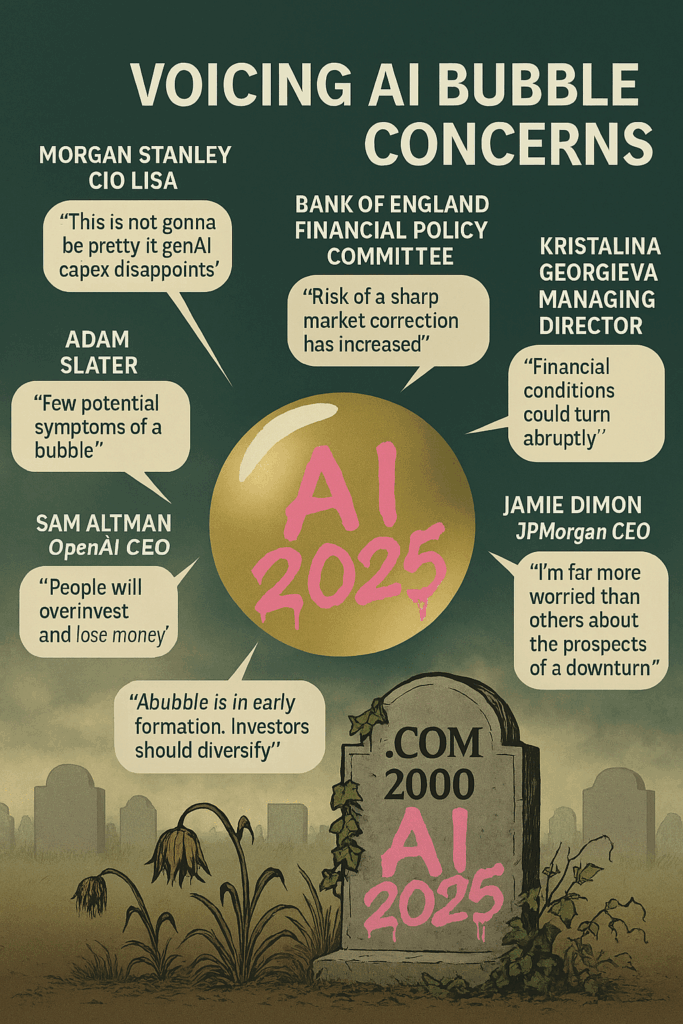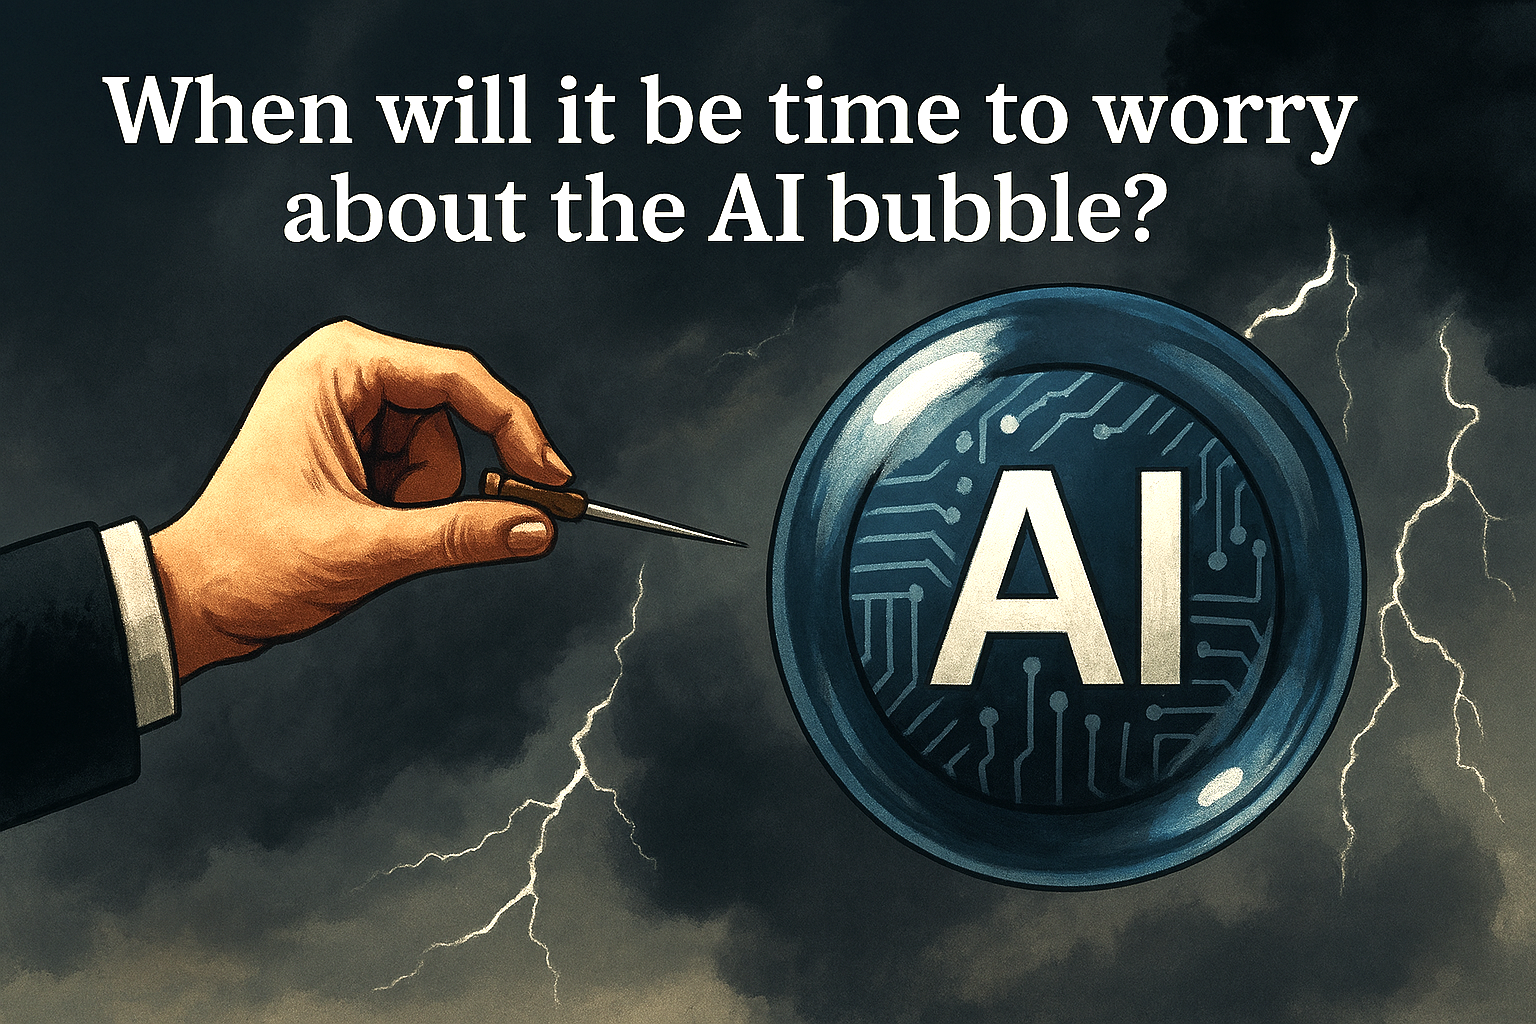
For some time now, talk of an ‘AI bubble‘ has largely come from investors and financial analysts. Now, strikingly, some of the loudest warnings are coming from inside the industry itself.
At the Web Summit in Lisbon, senior executives from companies such as DeepL and Picsart reportedly admitted they were uneasy about the soaring valuations attached to artificial intelligence ventures. Sam Altman of OpenAI has also sounded warnings of AI overvaluation.
DeepL’s chief executive Jarek Kutylowski reportedly described current market conditions as ‘pretty exaggerated’ and suggested that signs of a bubble are already visible.
Picsart’s Hovhannes Avoyan reportedly echoed the sentiment, criticising the way start‑ups are being valued despite having little or no revenue. He reportedly coined the phrase ‘vibe revenue’ to describe firms being backed on hype rather than substance.
These remarks highlight a paradox. On one hand, demand for AI services remains strong, with enterprises expected to increase adoption in 2026.
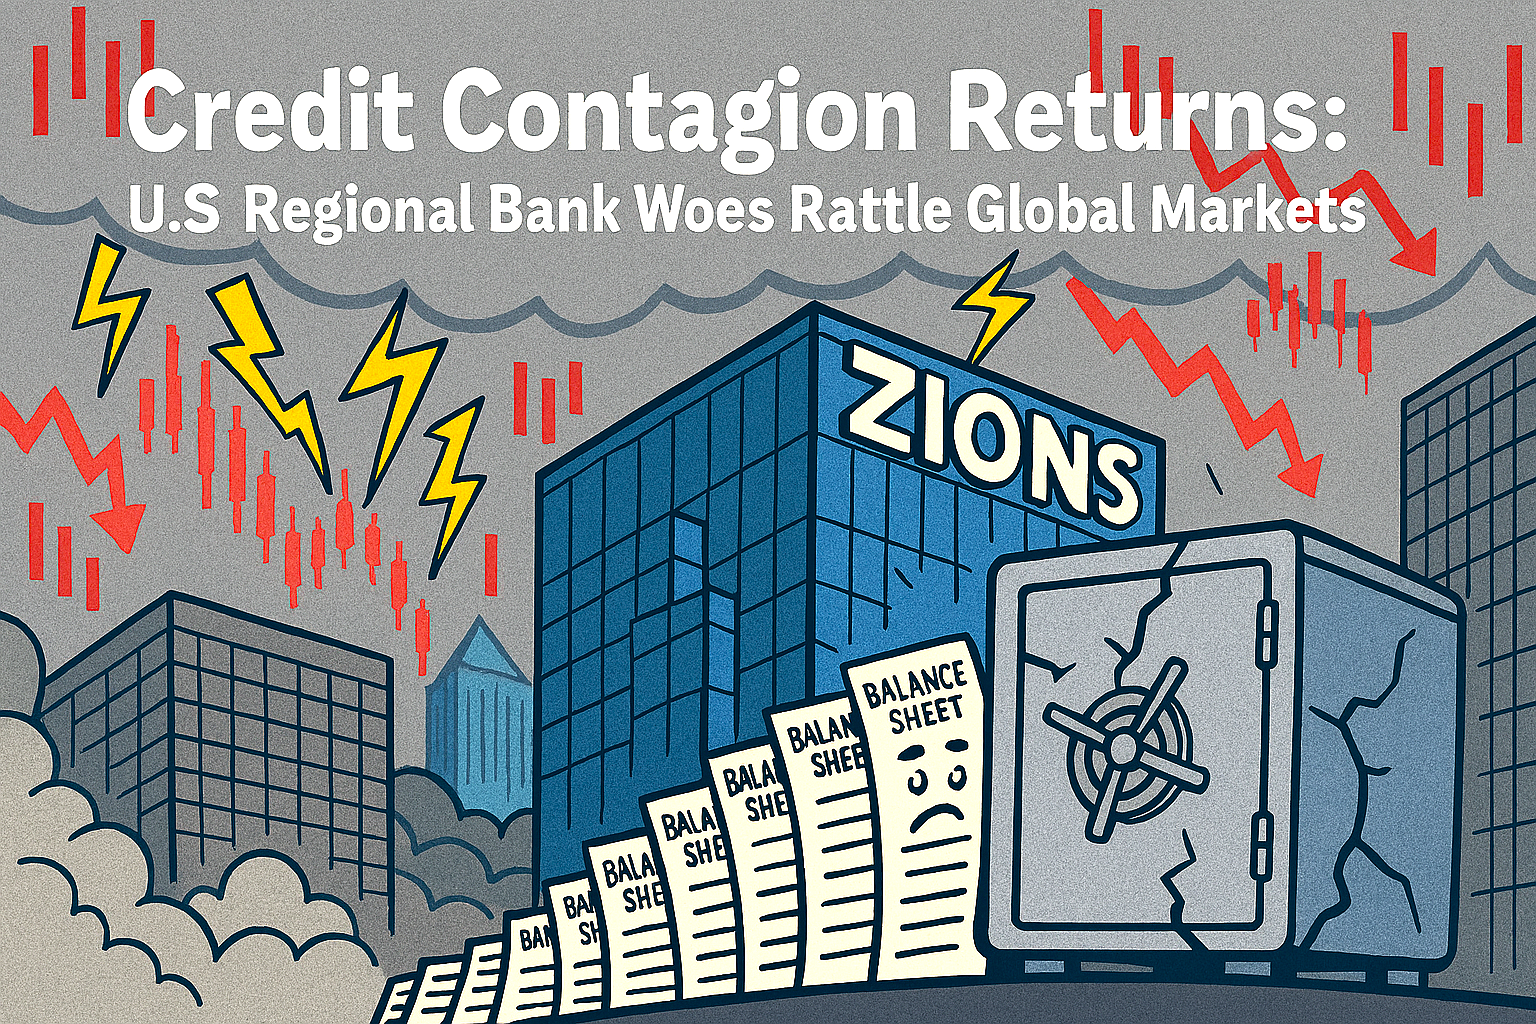
On the other, the financial side of the sector looks overheated. Investors such as Michael Burry have accused major cloud providers of overstating profits, while banks including Goldman Sachs and Morgan Stanley have warned of potential corrections.
The tension reflects a broader question: can the industry sustain its rapid expansion without a painful reset?
Venture capital forecasts suggest trillions will be poured into AI data centres over the next five years, yet some insiders argue that the scale of spending is unnecessary.
Even optimists concede that businesses are struggling to integrate AI effectively, meaning the promised returns may take longer to materialise.
For now, the AI sector stands at a crossroads. The technology’s transformative potential is undeniable, but the financial exuberance surrounding it may prove unsustainable.
If the warnings from within the industry are correct, the next chapter of the AI story could be less about innovation and more about value correction.