Observing the data available at CME FedWatch the stock market does not seem to expect the Fed to start cutting rates aggressively anytime soon, this opinion is based on the current pricing data of the fed-funds futures market.
According to the CME FedWatch Tool, the probability of a rate cut in the next FOMC meeting on 13th December 2023 is very low. It is likely interest rates will be left unchanged.
The market seems to expect the Fed will hold the current rate of 5.25% until at least March 2024, but will then gradually lower it to 4.75% by December 2024.
The market seems to be more optimistic about the U.S. economic outlook and the Fed’s ability to control inflation. The mood on rates has been buoyed recently with inflation data coming in better than expected.
It is highly likely that the Fed will have to cut rates more aggressively in 2024 and 2025 to stimulate the economy and avoid a potential prolonged recession.
South Korea stocks surged on Monday, 6th November 2023 after the country imposed a ban on short selling, while most Asia-Pacific markets took the lead from a lighter than expected U.S. jobs report that helped reduce interest rate expectations.
Financial decision makers in South Korea said short selling will be banned until the end of June 2024. Short selling is when a trader sells borrowed shares to buy back at a lower price and pocket the difference.
Stocks retreated Friday as a surge in the 10-year Treasury yield prompted broader concerns about the state of the economy.
The Dow Jones Industrial Average (DJIA) is one of the most widely followed stock market indices in the world. It tracks the performance of 30 large U.S. companies from various sectors, such as Boeing, Coca-Cola, Apple and Walmart.
The DJIA is often used as a proxy for the overall health of the U.S. economy and investor sentiment.
Market pressure
Lately, the DJIA has been under pressure as U.S. Treasury yields have climbed to their highest levels in over sixteen years.
Treasury yields are the interest rates that the U.S. government pays to borrow money by issuing bonds. When Treasury yields rise, it means that investors are demanding higher returns to lend money to the government, which reflects their expectations of higher inflation and economic growth.
Treasury yields
Higher Treasury yields can have a negative impact on the stock market for several reasons. Firstly, they increase the borrowing costs for companies and consumers, which can affect spending and profits.
Secondly, they make bonds more attractive as an alternative investment to stocks, which can reduce the demand for equities.
Thirdly, they can signal that the Federal Reserve may tighten its monetary policy sooner than expected, which can also dampen the stock market’s momentum.
The DJIA has fallen by more than 300 points in recent days as Treasury yields climbed above 5%, a level not seen since 2007. The rise in yields was driven by strong economic data, such as the September 2023 consumer price index (CPI), which showed that inflation remained elevated at 3.7% year-over-year. But only 1.7% off the Fed target of 2%.
Dow Johns Industrial Average close 20th September 2023
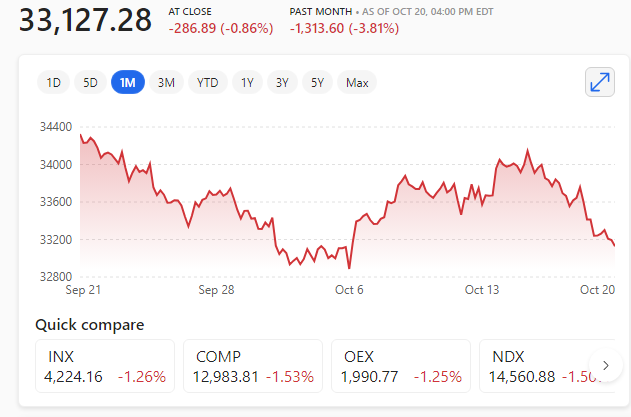
U.S. 10-year Treasury yield hits 5% for the first time since 2007 – Dow closes down nearly 300 points
The S&P 500 lost 1.26% to 4,224. The Nasdaq dropped 1.53% to 12,984. The Dow Jones Industrial Average lost 287 points, or 0.86%, to end at 33,127.28.
The yield on the benchmark 10-year Treasury crossed 5% for the first time in 16 years on Thursday 19th October 2023, a level that could easily spread through the economy by raising rates on mortgages, credit cards, vehicle loans and more. It retreated slightly from this value on Friday 20th October 2023.
Not to mention, it offers investors an attractive alternative to stocks.
London has regained its status as Europe’s largest stock market from Paris, boosted by rising crude oil prices.
The combined market capitalization of primary listings in London but excluding ETFs and ADRs, is now $2,888.4 billion versus Paris’s $2,887.5 billion, as of 19th October, 2023.
London had lost its position as Europe’s biggest stock market in November 2022, extending a decline that started with Britain’s vote to leave the European Union in 2016.
London market
The London market, which has a large exposure to commodity stocks, such as Shell and BP, has outperformed recently due to the surge in oil prices, which reached a seven-year high this month.
Paris, on the other hand, has been weighed down by the slump in luxury stocks, such as LVMH and Kering, which have been hit by China’s crackdown on consumption and corruption.
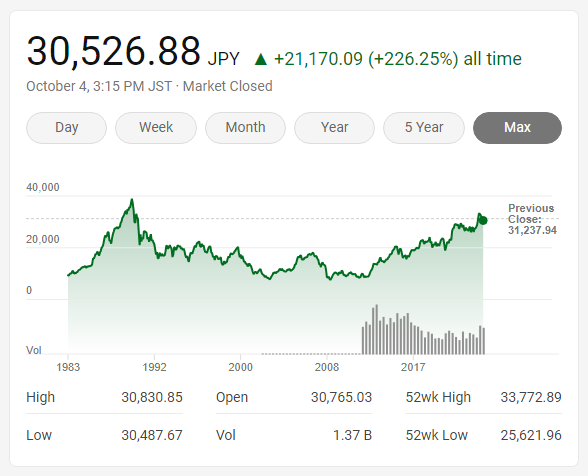
The Nikkei 225 index, is a stock market index for the Tokyo Stock Exchange.
The Nikkei 225 reached its all-time high on 29 December 1989, during the peak of the Japanese asset price bubble, when it reached an intra-day high of 38,957.44, before closing at 38,915.87. This was after a decade-long bull run throughout the 1980s, when the index grew sixfold.
Since then, the index has never surpassed this level, and has experienced several periods of decline and stagnation. As of October 4, 2023, the index closed at 30,526.88, down by 2.28% from the previous day and 8389 points off its all-time high.
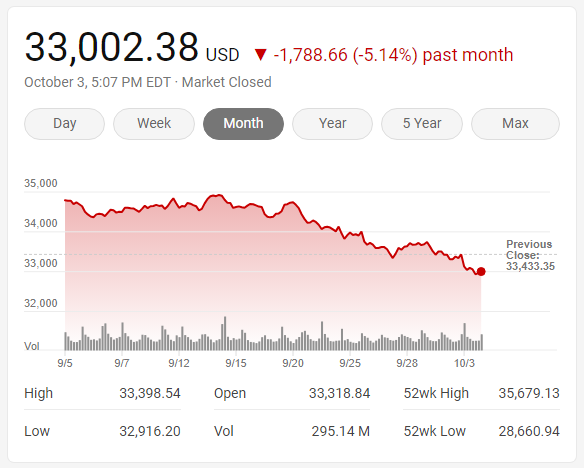
Dow Jones Industrial Average (Dow) performance on 3rd October 2023.
The Dow fell more than 400 points, turning negative for the year. The main reason for the drop was the surge in U.S. Treasury yields, which reached their highest levels in 16 years.
Higher yields mean higher borrowing costs for businesses and consumers, which could hurt the economic recovery and the housing market.
S&P 500 on 3rd October 2023
Nasdaq on 3rd October 2023
The tech-heavy Nasdaq Composite gained a 0.7% on October 3rd, 2023, as some investors saw an opportunity to buy some of the high-growth stocks that had been under pressure recently.
The stock market has been experiencing some volatility and uncertainty in September and October 2023, as investors fret about inflation, interest rates, and the possibility of a U.S. recession.
Main facts affecting the current stock market
The month of October has produced some severe stock market crashes over the past century, such as the Bank Panic of 1907, the Wall Street Crash of 1929, and Black Monday 1987.
October has also marked the start of several major long-term stock market rallies, such as Black Monday itself and the 2002 nadir of the Nasdaq-100 after the bursting of the dot-com bubble.
The S&P 500 dropped 4.5% in September 2023 and finished the third quarter in the red.
The U.S. Treasury yield curve has been inverted for months – which is a historically strong recession indicator.
The Fed maintained interest rates at the current target range of between 5.25% and 5.5% in September 2023, but signalled that it may need to raise rates again to combat inflation.
The consumer price index gained 3.7% year-over-year in August 2023, down from peak inflation levels of 9.1% in June 2022 but still well above the Fed’s 2% long-term target.
The bond market is currently pricing in an 81.7% chance the Fed will choose not to raise rates again on 1st November 2023.
The Dow Jones Industrial Average was down at 33002, Tuesday 3rd October 2023.
Stocks fell as investors pulled money from equities and moved it to the hot bond market.
International markets also faced significant turmoil, sending mini shockwaves through global financial centres, which reverberated in equities.
The dollar rose to the highest since December and is heading towards the twelfth positive week in a row.
Uncertainty
Uncertainty in the U.S. political system is having a major affect too. Especially with the ousting of the speaker and the real fear of a government shutdown looming large.
The stock market can be very volatile and unpredictable, especially in times of uncertainty and crisis. It seems like investors are reacting to every piece of news, whether it’s good or bad, with fear and panic.
According to some analysts, the main factors that are driving the market turmoil are the rising bond yields, the slowing global growth, the ongoing trade tensions, and the potential fiscal risks. These issues have created a lot of uncertainty and anxiety among market participants, who are looking for signs of stability and direction.
Long-term investing makes sense
Some experts suggest that the best way to deal with the market volatility is to have a long-term perspective, diversify your portfolio, and avoid emotional decisions. They also advise to stay informed, but not to overreact to every headline or rumour.
Remember that the market has gone through many ups and downs in the past and has always recovered over time.
October is a special month in the stock market for several reasons. It is the month when some of the most spectacular market crashes have occurred, such as in 1929 and 1987.
However, it is also a month that has historically performed well on average, with a 0.6% price gain for the Dow Jones Industrial Average from 1928 to 2022.
The month of October also marks the beginning of a seasonal pattern that favours stocks, as the fourth quarter and the winter months tend to see strong rallies. The ‘Santa’ rally may also visit.
Swings
However, October can also be a volatile month, with significant swings in both directions. It is the only month where all major indices have recorded losses of at least 17% (in 1987 and 2008), but also the month where the S&P 500 and the Dow Jones Industrial Average have posted their highest percentage gains of any month (in 1974 and 2022).
Therefore, investors should be prepared for potential turbulence and seek professional advice to navigate the market. Do your research!
RESEARCH! RESEARCH! RESEARCH!
Read-all-about-it, 1987 October stock market crash!
Additionally, October may face some special factors that could affect the market performance this year, such as the ongoing strike action, the rising inflation and interest rates, and the political uncertainty in the U.S. over the debt ceiling and government spending. These factors could create headwinds or even opportunities for different sectors and industries, depending on how they are resolved.
Summary
In summary, October is a month that has a mixed reputation in the stock market, with both risks and rewards. Investors should be aware of the historical trends and the current events that could influence the market direction.
‘How bad can October really get?’ ‘Remember the 1987 crash?’
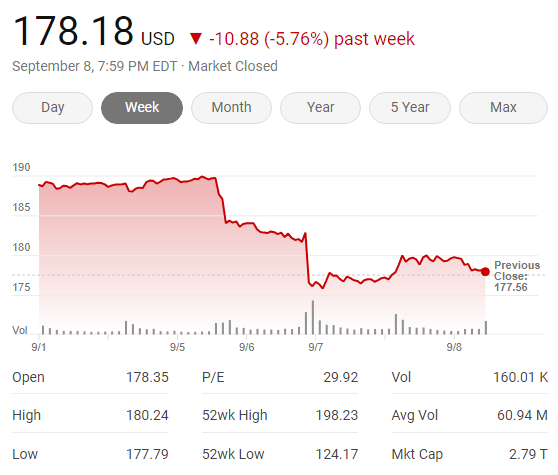
Apple sells around 50 million iPhones in China annually. A sweeping ban is what investors fear and that spells trouble for Apple.
Apple stock drops after The Wall Street Journal reported a day earlier that Chinese authorities have curbed the use of the iPhone. Apple’s flagship product will no longer be legal to use by some central government officials.
The potential crackdown threatens to dissrupt Apple’s sales as China accounts for about 20% of Apple’s total revenue. Uncertainties about the news prompted investors to retreat from Apple postions, leading to a 6% drop in Apple shares in two days. More than $200bn of market cap was wiped out.
$200 market cap drop
Apple shares fall $200 billion in just days September 2023
The iPhone commeth
Adding to the concern, Apple is just days away from its key event. On the 12th september 2023, the company is expected to officially announce the launch of its newest smartphone – the iPhone 15.
At 4.33%, the 10-year Treasury yield in the U.S. is at its highest in 16 years. That represents a risk-free, long-duration asset with relatively high returns and this is challenging the stock market.
Why should traders invest in stocks that may not return as much, or just slightly more and take unecessary risks, when there is an asset class that guarantees around 4% return or slighlty more?
Cash is king?
Cash is now yielding 5% in the U.S., short term bonds are yielding 5% plus, so equities for the first time in a long time, have actually got some competition.
Typically stocks if they do well, are likely to return more than a risk-free asset, precisely because it isn’t certain stocks will rise. That’s called the equity risk premium, a return that’s supposed to compensate stock investors for the chance that they might lose money. But, as the premium is below 1% now. Historically, it’s been between 2% and 4% – meaning stocks are looking much less attractive than Treasuries.
Harder job for the Fed?
Another potential issue that could crop up with high Treasury yields is that it could make the Federal Reserve’s job tougher. During the recent Jackson Hole gathering, the Fed head has indicated that more interest rate hikes are still high possibility.
But don’t panic just yet… this is likely a pullback phase of a bull market analysts suggest. That is, it’s still too early to be bearish on stocks.
Yardeni Research president Ed Yardeni is reported to have said that the market is ‘going to hang in there’ and ‘a year-end rally will bring the S&P 500 back to something like 4,600‘.
That implied an increase of almost 5% in stocks – while not certain – would give Treasuries a run for their money again.
The U.S. stock market has experienced a 5.6% slide for the S&P 500 index over 15 trading sessions through 17th August 2023 and levelling off in the last trading day of that week.
This is about as bad as August typically gets, as August is a rocky month with low volume and high volatility. Some of the reasons for the pullback include the rise in the 10-year Treasury yield, the strengthening of the U.S. dollar, and the signs of a slowing Chinese economy.
Pullback temporary for August?
However, some analysts argue that the pullback will likely prove to be temporary and not turn into a serious market rout. It has been suggested that the bull run isn’t quite over just yet, and that a 10% ‘pullback’ was on the cards.
Analysts also suggest that the rise in yields would need to threaten a serious shift or there would need to be an additional shock to cause a larger selloff.
NASDAQ
NASDAQ drops some 7% in one month from 19th July – 18th August 2023
However, some suggest that the market is showing signs of stability, as the speed of the surge in the 10-year yield often occurs near the end of a selling cycle for equities. Investors should watch for indicators such as oil prices, wage pressures, and inflation expectations to gauge the market sentiment.
The S&P 500 and the Dow levelled off the week at the close of trading Friday 18th August 2023.
The NASDAQ did score its best first half of the trading year since 1983 January to June 2023 so a pullback was likely to happen.
The Buffet Indicator is a valuation multiple used to assess how expensive or cheap the aggregate stock market is at a given point in time. It was proposed by investor Warren Buffett in 2001, who called it ‘probably the best single measure of where valuations stand at any given moment‘ . It compares the total value of all publicly traded securities in the U.S. to the U.S. GDP .
The current value of the Buffet Indicator is 181%, (July 2023) – which suggests that the U.S. stock market is reportedly worth $48.37 trillion, while the U.S. GDP is $26.74 trillion.
This ratio is 50.50% above the historical trend line, suggesting that the stock market is overvalued relative to GDP. Buffett warned that if the ratio approaches 200%, ‘you are playing with fire‘.
Buffett Indicator: $48.85T ÷ $26.91T = 182%
Does it Matter?
The Buffett Indicator expresses the value of the U.S. stock market in terms of the size of the U.S. economy. If the stock market value is growing much faster than the actual economy, then it may be in a bubble.
Buffet Indicator Movement Above and Below Trend Line