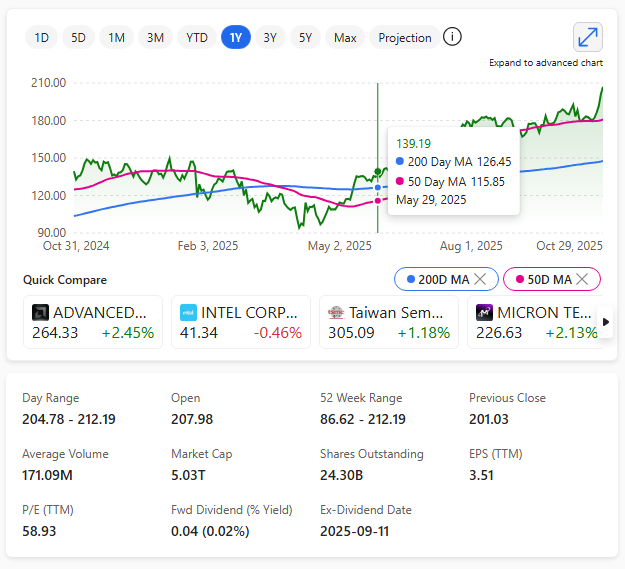
In October 2025, Nvidia’s stock surged past $207 per share, lifting its market capitalisation to $5.06 trillion. Once a niche graphics chip maker, Nvidia now powers the backbone of artificial intelligence worldwide.
CEO Jensen Huang confirmed over $500 billion in chip orders and plans for seven U.S. supercomputers.
This milestone, reached just three months after crossing $4 trillion, places Nvidia ahead of Microsoft and Apple, cementing its dominance in the AI era and redefining the future of computing.
Nvidia one-year chart as of October 2025
Nvidia one-year chart as of October 2025 passes $5 trillion Market Cap
In the world of stock markets, few phenomena are as captivating—or as perilous—as bull runs and speculative bubbles.
Though often conflated, these two forces represent distinct psychological and financial dynamics that shape investor behaviour and market outcomes.
Bull Markets: Confidence with Momentum
A bull market is defined by sustained price increases across major indices. Typically driven by strong economic fundamentals, corporate earnings growth, and investor optimism.
In the U.S., iconic bull runs include the post-World War II expansion. The 1980s Reagan-era boom, and the tech-fuelled rally of the 2010s. The Dot-Com bull run, and subsequesnt crash is probably the most famous.
Bull markets feed on confidence: low interest rates, rising employment, and technological innovation often act as catalysts. Investors pile in, believing the upward trajectory will continue—sometimes for years.
But even bulls can lose their footing. When valuations stretch beyond reasonable earnings expectations, the line between bullish enthusiasm and irrational exuberance begins to blur.
Bubbles: Euphoria Untethered from Reality
A bubble occurs when asset prices inflate far beyond their intrinsic value. This is fuelled not by fundamentals but by speculation and herd mentality.
The dot-com bubble of the late 1990s is a textbook example. Companies with no profits—or even products—saw their valuations soar simply for having ‘.com’ in their name.
Similarly, the U.S. housing bubble of the mid-2000s was driven by easy credit and the belief that property prices could only go up.
Bubbles often follow a predictable arc: stealth accumulation, media attention, public enthusiasm, and finally, a euphoric peak.
When reality sets in—be it through disappointing earnings, regulatory shifts, or macroeconomic shocks—the bubble bursts! Leaving behind financial wreckage and a trail of disillusioned investors.
Spotting the Difference
While bull markets can be healthy and sustainable, bubbles are inherently unstable. The key distinction lies in valuation discipline.
Bulls are supported by earnings and growth; bubbles are driven by hype and fear of missing out (FOMO).
Tools like the cyclically adjusted price-to-earnings (CAPE) ratio and historical trend analysis can help investors discern whether they’re riding a bull or inflating a bubble.
📉 The Aftermath and Opportunity Ironically, the collapse of a bubble often sows the seeds for the next bull market. As excesses are purged and valuations reset, long-term investors find opportunities in the rubble.
The challenge lies in resisting the emotional extremes—greed during the rise, panic during the fall—and maintaining a clear-eyed view of value.
In markets, as in life, not every rise is rational, and not every fall is fatal
As of October 2025, many analysts argue that the U.S. stock market is exhibiting classic signs of a bubble. Valuations stretched across major indices and speculative behaviour intensifying—particularly in mega-cap tech stocks and passive index funds.
The S&P 500 recently hit record highs despite a backdrop of political gridlock and a government shutdown. This suggests a disconnect between price momentum and underlying economic risks.
Indicators like Market Cap to Gross Value Added (GVA) and excessive investor sentiment point to a speculative mania. Some experts are calling it the largest asset bubble in U.S. history.
While a full-blown crash hasn’t materialised yet, the market’s frothy conditions and historical October volatility have many bracing for a potential correction.
In a landmark moment for the tech industry, Microsoft has officially joined Nvidia in the exclusive $4 trillion market capitalisation club, following a surge in its share price after stellar Q4 earnings.
This accolade achieved on 31st July 2025 marks a dramatic shift in the hierarchy of global tech giants, with Microsoft briefly overtaking Nvidia to become the world’s most valuable company. But for how long?
The rally was fuelled by Microsoft’s aggressive investment in artificial intelligence and cloud infrastructure. Azure, its cloud platform, posted a 39% year-on-year revenue increase, surpassing $75 billion in annual sales.
The company’s Copilot AI tools, now boasting over 100 million monthly active users, have become central to its strategy, embedding generative AI across productivity software, development platforms, and enterprise services.
Microsoft’s transformation from a traditional software provider to an AI-first powerhouse has been swift and strategic. Its partnerships with OpenAI, Meta, and xAI, combined with over $100 billion in planned capital expenditure, signal a long-term commitment to shaping the future of AI utility.
While Nvidia dominates the hardware side of the AI revolution, Microsoft is staking its claim as the platform through which AI is experienced.
This milestone not only redefines Microsoft’s legacy—it redraws the map of pure tech power and reach the company has around the world.
This has been earned over decades of business commitment.
Nvidia $279 billion market cap wipeout — the biggest in U.S. history for just ONE company
On Tuesday 3rd September 2024, around $279 billion of value was wiped off of Nvidia. That was the biggest one-day market capitalisation drop for a U.S. stock in HISTORY!
Nvidia one-day chart closed 108 on 3rd September 2024
Nvidia one-day chart closed 108 on 3rd September 2024
Nvidia shares continued sliding in post-market trading Tuesday, falling 2%, after Bloomberg reported that the company received a subpoena from the Department of Justice as part of an antitrust investigation.
Global semiconductor stocks and related sectors subsequently experienced a decline on Wednesday 4th September 2024, after Nvidia’s share price in the U.S. saw a significant plunge overnight.
Update: in a subsequent statement Nvidia reportedly said it didn’t receive antitrust subpoena from DOJ. This according to a report on CNBC.
To put this figure into some perspective, the loss is comparable to the GDP output of a small country, such as Norway, Singapore, or the UAE, for example.
Global semiconductor stocks experienced volatility on Tuesday following a decline in Nvidia’s shares from the previous trading sessions.
Shares of chip firms in Europe and Asia fell in early trade as investors reacted to Nvidia losing more than $500 billion in market capitalization over three trading days. Some of the stocks recouped losses, however, as shares in the U.S. chipmaking giant recovered around 6 – 6.5% as of Tuesday 25th June 2024.
This follows a significant drop in Nvidia’s share value, which fell 13% over three consecutive sessions from the record highs achieved on Thursday 20th June 2024.
On Monday 24th June 2024, Nvidia’s stock closed down 6.7%, marking its second-largest decline of the year, yet the shares began to recover in early trading on Tuesday 25th June 2024.
Last week, the company surpassed Apple and Microsoft to become the most valuable U.S. company, achieving a market capitalization of over $3.4 trillion. However, by the end of Monday, Nvidia’s market value had declined by more than $540 billion from its intraday record on Thursday 20th June 2024.
Nvidia reported that the demand for its highly sought-after artificial intelligence graphics processing units (GPUs) continues to be strong.
Companies such as Microsoft, Google, Amazon, and Meta are investing billions of dollars in these chips to enhance their data centres and cloud services.
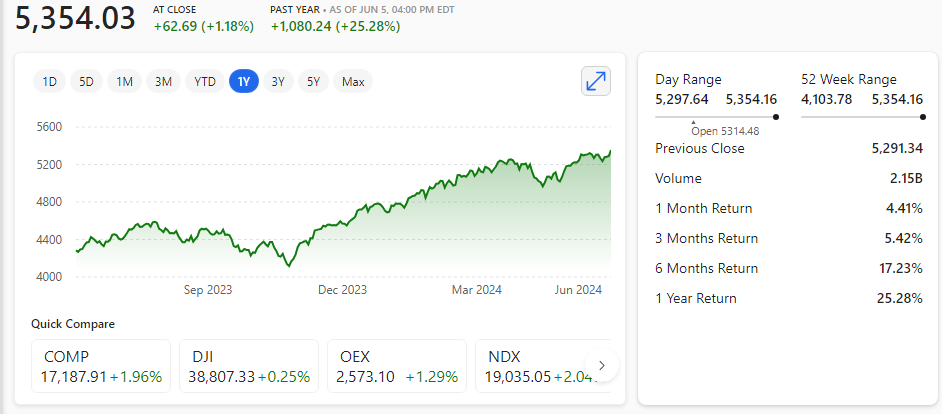
The S&P 500 reached a new high as Nvidia surpassed the $3 trillion mark for the first time, and the anticipation of an interest rate cut grew due to softer-than-expected job data.
S&P 500 all-time high as of 5th June 2024
S&P 500 all-time high as of 5th June 2024
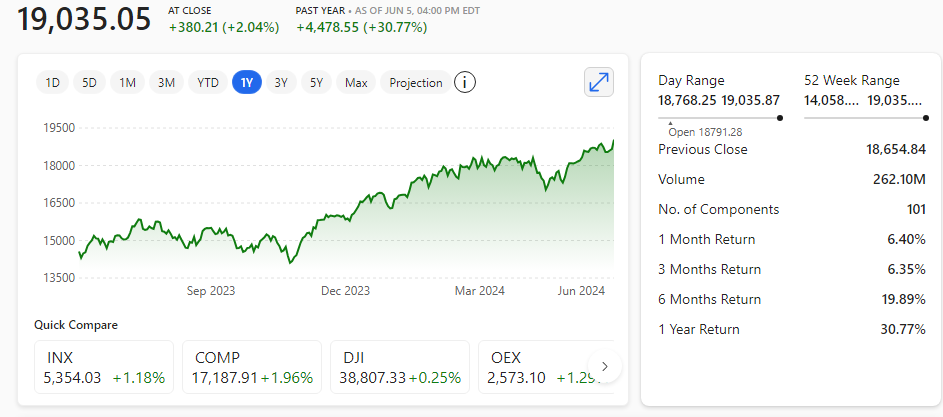
Similarly, the Nasdaq 100 and Nasdaq Composite achieved new record highs
Nasdaq 100 as of 5th June 2024
Nasdaq Comp as of 5th June 2024
AI boom catapults Nvidia passed Apple’s market cap’ valuation
Nvidia’s shares have surged 24% following its impressive earnings report in May, in contrast to Apple’s shares, which have increased by only 5% this year amid a slowdown in sales growth in recent months.
Nvidia one year share price as of 5th June 2024
Nvidia one year share price as of 5th June 2024
Nvidia Market Cap at $3.01 trillion as of 5th June 2024
The Magnificent Seven, or MAMA ANT, is a term coined by Bank of America to describe the seven most dominant tech companies in the world
The Seven are: Microsoft, Amazon, Meta Platforms, Apple, Nvidia, Tesla, and Alphabet. These companies have not only led the tech sector in terms of innovation, growth, and profitability, but have also become some of the most valuable entities in the world by market capitalization.
Valuation at $15 trillion
Market capitalization, or market cap, is the total value of all the shares of a company that are traded on the stock market. It reflects the market’s perception of the company’s future prospects and earnings potential.
As of January 2023, the Magnificent Seven had a combined market cap of about $15 trillion, which was more than the gross domestic product (GDP) of almost every country in the world, except for the United States, China and Japan (just).
Magnificent Seven
The Magnificent Seven have achieved such a remarkable feat by leveraging their core competencies in various fields of technology, such as artificial intelligence (AI), cloud computing, social media, e-commerce, gaming, electric vehicles, and online advertising. They have also diversified their revenue streams by acquiring or developing new products and services, such as Activision Blizzard, AWS, Oculus, iPhone, GeForce, SpaceX, and YouTube. They have also benefited from the increased demand for digital solutions amid the Covid-19 pandemic, which accelerated the adoption of online platforms, remote work, and entertainment.
Challenges
However, the Magnificent Seven also face some challenges and risks that could threaten their dominance and valuation. These include increasing competition from other tech companies, especially from China, such as Alibaba, Tencent, Baidu, and Huawei.
They also face regulatory scrutiny and pressure from governments and consumers over issues such as antitrust, privacy, taxation, content moderation, and environmental impact. Furthermore, they may encounter technical difficulties, security breaches, or ethical dilemmas that could damage their reputation and customer trust.
Conclusion
In conclusion, the Magnificent Seven are the most powerful and influential tech companies in the world, and their market cap surpasses that of almost every country in the world.
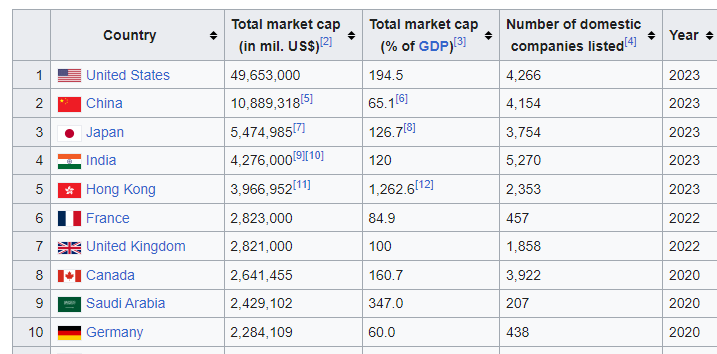
List of 10 countries by stock market capitalization
List of 10 countries by stock market capitalisation
The meteoric rise in the profits and market capitalisations of the Magnificent 7 U.S. tech giants: Apple, Amazon, Alphabet, Meta, Microsoft, Nvidia and Tesla – outstrip those of all listed companies in almost every G20 country. Of the non-U.S. G20 countries, only China and Japan (and the latter, only just) have greater profits when their listed companies are combined.
They have achieved this by exploiting their competitive advantages in various domains of technology and expanding their offerings and markets. However, they also need to overcome some challenges and risks that could hamper their growth and value in the future.
A forced size reduction to stop the monopolising of market share could help tame these beasts too and open up fairer competition.
Should we worry?
Basically, yes, we should be concerned about the size and dominance of these companies.
This level of wealth and power concentrated in just a handful of companies has led some analysts to voice concerns over related risks in the U.S. and global stock markets.
Economists and stock market analysts have cautioned that the U.S. stock market is rivalling 2000 and 1929 in terms of being at its most concentrated in history.