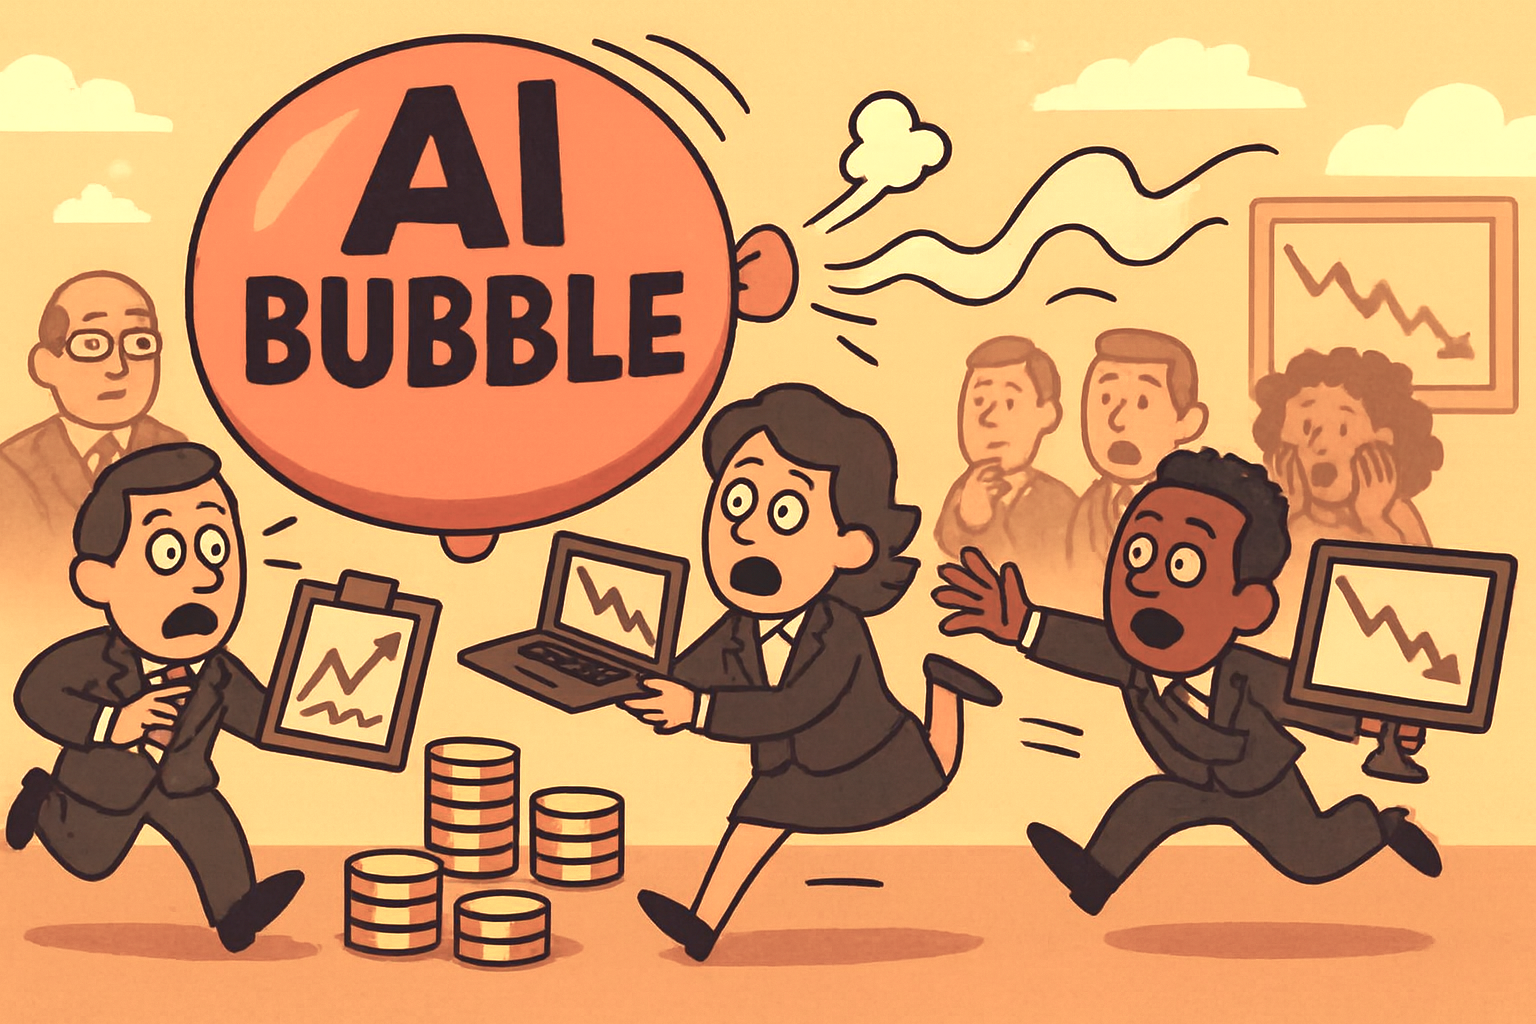
Either way, the balloon is close to popping!
AI‑linked markets are undeniably stretched, and the debate over whether a correction is imminent has intensified.
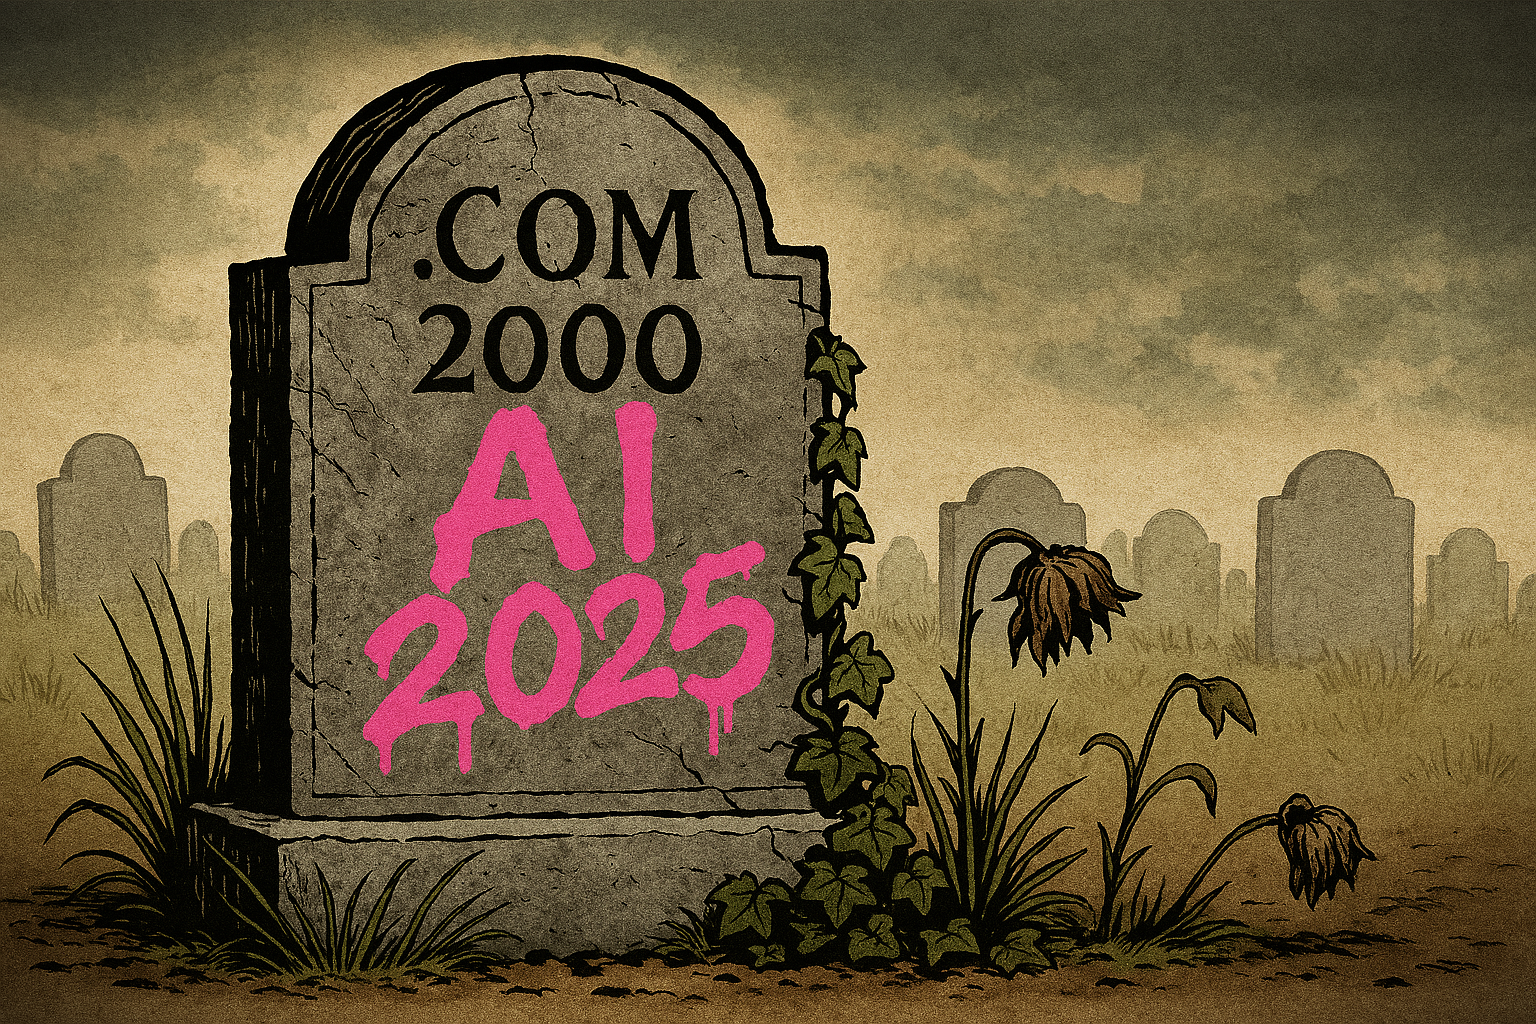
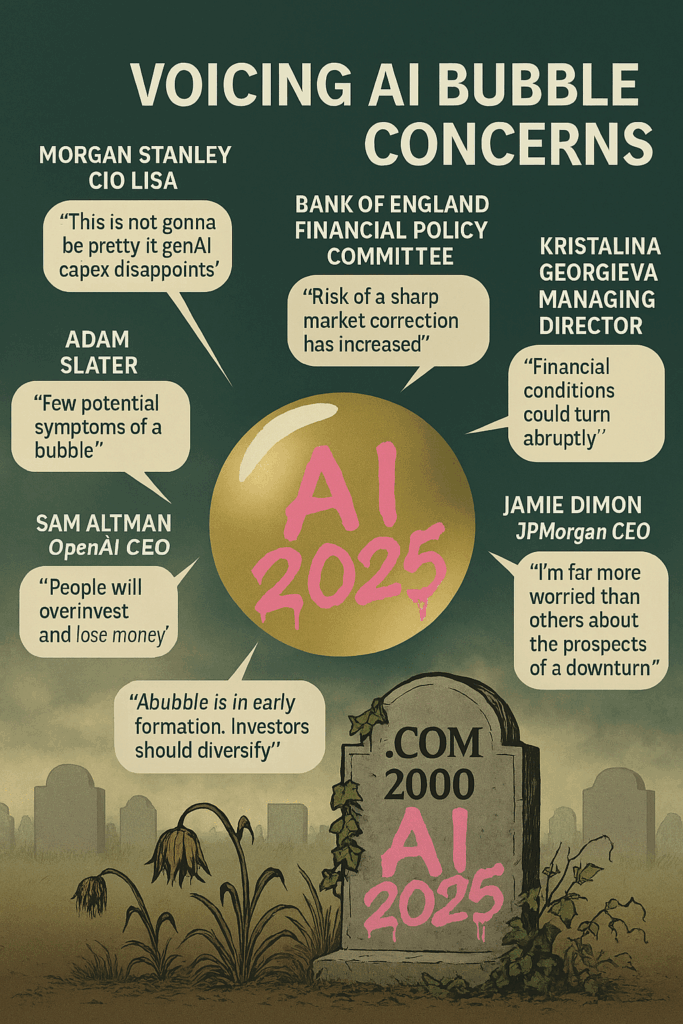
Several analysts warn that valuations across AI‑heavy indices now resemble late‑cycle excess, with the Bank of England noting that some multiples are approaching levels last seen at the peak of the dot‑com bubble.
At the same time, experts argue that enthusiasm for AI stocks has pushed prices far beyond what current earnings can justify, raising the risk of a sharp pullback if sentiment turns or growth expectations soften.
AI reckoning
A number of commentators even outline scenarios for a broader ‘AI reckoning’, where inflated expectations collide with the slower, more incremental reality of enterprise adoption.
This doesn’t guarantee a crash, but it does suggest that the market is vulnerable to any disappointment in revenue growth, chip demand, or data‑centre utilisation.
However, not all analysts believe a dramatic collapse is inevitable. Some argue that while valuations are undeniably high, the scale of investment may still be justified by long‑term structural demand for compute, automation, and agentic AI systems.
Survey
A recent survey of 40 industry leaders shows a split: many fear a bubble, but others maintain that heavy capital expenditure is necessary to meet future AI workloads and that the sector could experience a period of deflation or consolidation rather than a full‑scale crash.
A more moderate scenario—favoured by several economists—is a multi‑quarter pullback as markets digest rapid gains, capital costs normalise, and companies shift from hype‑driven spending to proving real returns.
In this view, AI’s long‑term trajectory remains intact, but the near‑term path is likely to be bumpier and more disciplined than the exuberance of the past two years.
Are we in an AI bubble? Here is my conclusion
The latest commentary suggests we’re still in a highly speculative phase of the AI boom, with massive infrastructure spending and concentrated market gains creating bubble‑like conditions.
So, the safest summary is this: valuations are stretched, expectations are overheated, and investment is flowing faster than proven revenue.
Yet unlike past bubbles the underlying technology is delivering real adoption and measurable productivity gains, meaning we may be in an overhyped surge rather than a classic doomed bubble.
A deflation effect of some sort is likely and soon.