


The highest coal using countries in the world
- China, which consumes over half of the global coal demand and produces over 4 billion tonnes of coal per year.
- India, which consumes about 14% of the global coal demand and produces over 900 million tonnes of coal per year.
- The United States, which consumes about 9% of the global coal demand and produces over 600 million tonnes of coal per year.
- Japan, which consumes about 3% of the global coal demand but imports most of its coal.
These countries accounted for about 82% of the global coal production in 2021 according to 2021 data set. China alone produced more than half of the world’s coal, followed by India with nearly 10%.
Global coal use in 2023 hits few high
Global coal use in 2023 has hit a record high, surpassing 8.5 billion tons for the first time, on the back of strong demand in countries like India and China, said IEA. These countries are the world’s largest consumers of the dirtiest fossil fuel, and continued modernization puts their energy consumption on a rapid growth trajectory.
China
China and India’s growing economies will continue to fuel demand for coal even as they set ambitious renewable energy targets, according to experts.
While China is the world’s largest energy consumer, India is ranked third globally, and both countries are the top consumers of coal as they strive to fuel economic growth.
China’s share of global electricity consumption, 60% of which is coal, is set to jump to one-third by 2025, compared with a quarter in 2015, according to projections by energy watchdog International Energy Agency (IEA).
Global coal usage in 2023 hit a record high, surpassing 8.5 billion tons for the first time, on the back of strong demand in emerging and developing countries such as India and China, IEA noted in a recent report.
China’s electricity sector has been in the throes of a clean revolution over the past few years, with an almost five-fold growth in wind and solar generation since 2015. As a result, the share of coal generation has fallen by 17 percentage points, from 78% in 2000 to 61% in 2022.
China has suffered from drought in recent years, which reduced hydroelectric power generation in its southern provinces. To maintain the necessary power output, the country had to turn to coal.
United States
By contrast, U.S., which is the world’s second largest consumer of coal, has seen a decrease in its usage of the fuel. According to the Institute for Energy Economics and Financial Analysis, the amount of coal that the superpower consumes each day recorded a 62% drop from 2.8 million to 1.1 million tons a day.
75% of India’s power is derived via coal-fired plants. Coal accounts for 61% of China’s power generation, even though the country is recognized as the indisputable leader in renewable energy expansion. It has been adding new projects to the grid almost as fast as the rest of the world combined in 2022 and has ambitions of becoming carbon neutral by 2060.
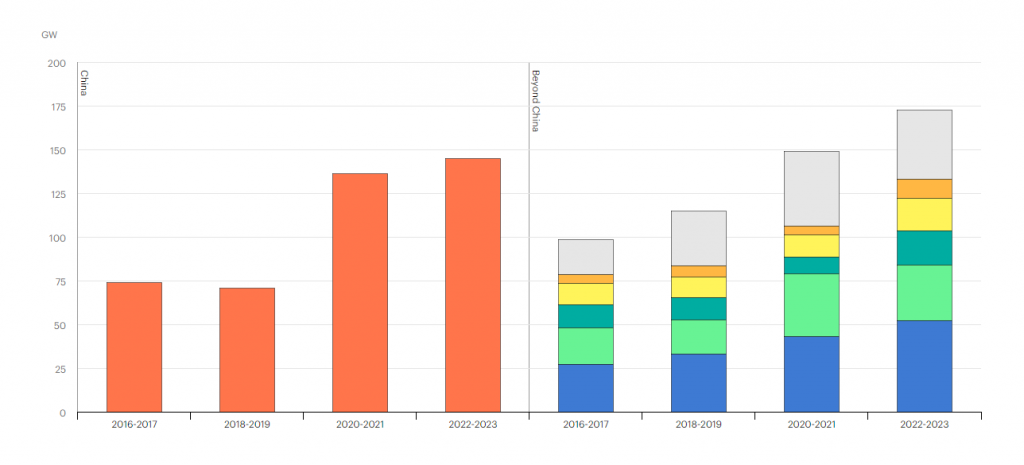
Annual average capacity additions by country and region, 2016-2023

India’s coal production rose to 893 million tons during the financial year ending March 2023, jumping nearly 15% from a year earlier. China’s raw coal production in 2023 went up by 2.9% compared with the same period in 2022.
There are no signs of a slowdown, with the IEA saying coal consumption in India and Southeast Asia is projected to grow significantly.
Coal won’t go!
But the lack of reliability of renewables means coal has still very much been a critical fallback option for the two countries.
Top five coal producing countries in the world
- China: 4,126.0 million tonnes
- India: 762.0 million tonnes
- Indonesia: 614.0 million tonnes
- United States: 523.8 million tonnes
- Australia: 467.1 million tonnes
Five of the Greenest energy producers in the world
- Sweden
- Norway
- Denmark
- Finland
- Switzerland
The greenest were based on these five criteria: carbon emissions, energy transition, green society, clean innovation, and climate policy.
Top countries by renewable energy production
- China: 2,271.9 TWh (28.2% of total electricity)
- United States: 804.8 TWh (20.5% of total electricity)
- Brazil: 491.9 TWh (83.3% of total electricity)
- Canada: 433.6 TWh (66.9% of total electricity)
- India: 303.5 TWh (24.5% of total electricity)
Note: three of the world’s worst offenders of fossil fuel use are also in the top five for energy production by renewables – China, U.S. and India.
So, are things changing slowly?


