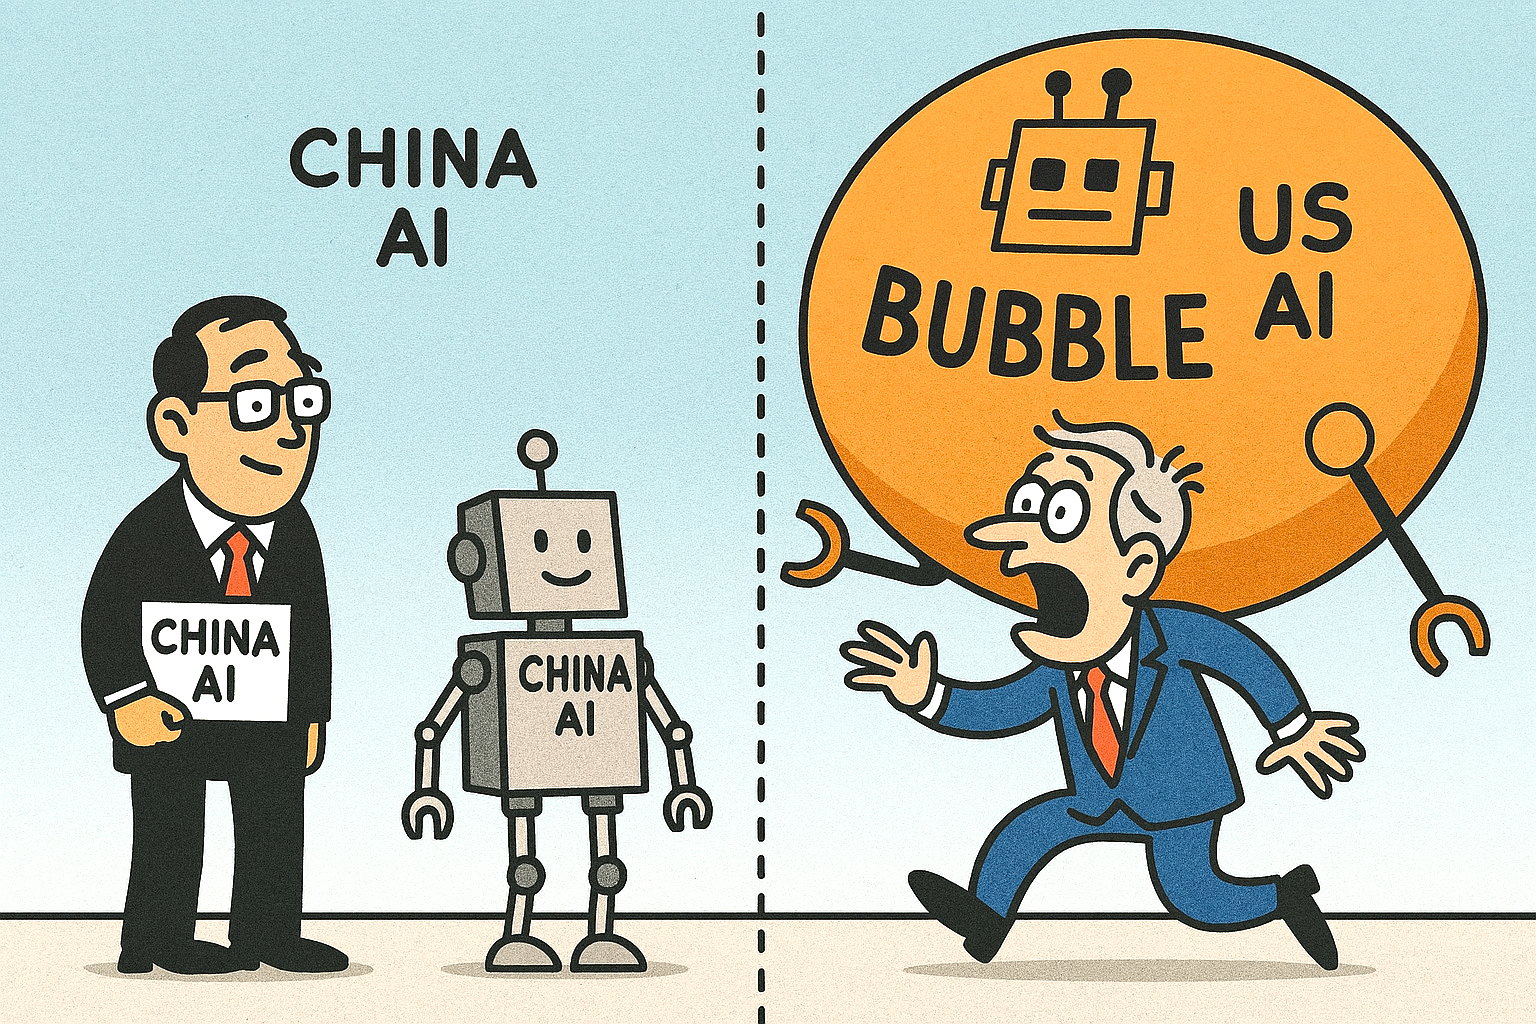
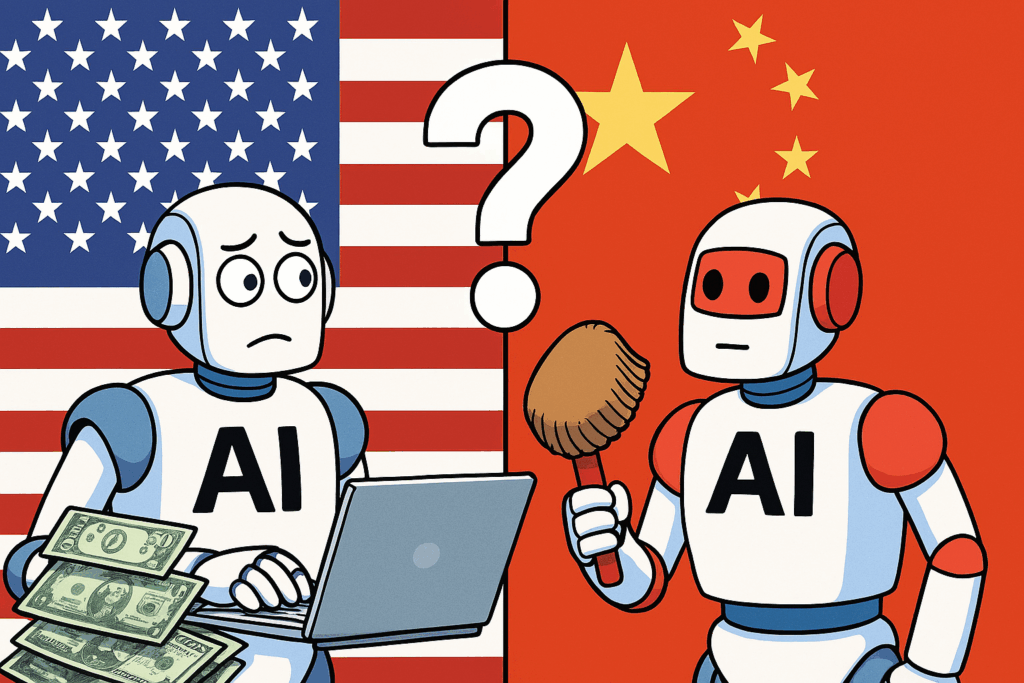
China’s AI industry has indeed cultivated a reputation for ‘doing more with less’, while the U.S. has poured vast sums into AI development, raising concerns about overinvestment and inflated valuations.
The contrast lies not only in the scale of funding but also in the efficiency and strategic focus of each country’s approach.
The U.S. Approach: Scale and Spending
The United States remains the global leader in AI infrastructure, driven by massive private investment and access to advanced computing resources.
Venture capital deals in U.S. AI and robotics startups have more than quadrupled since 2023, surpassing $160 billion in 2025.
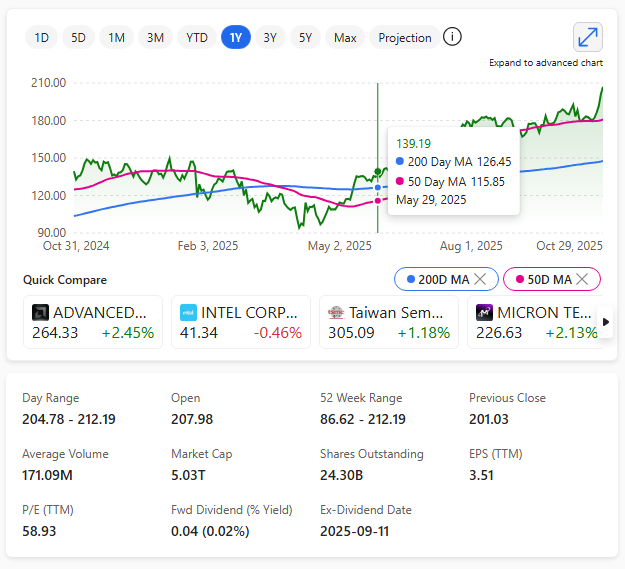
This surge has produced headline-grabbing valuations, such as humanoid robotics firms raising billions in single rounds. Yet analysts warn of bubble risks, with valuations often detached from sustainable revenue models.
The U.S. strategy prioritises scale: building the largest models, securing the most powerful GPUs, and attracting top-tier talent.
This has led to breakthroughs in generative AI and large language models, but at extraordinary cost.
Estimates suggest that OpenAI alone has spent over $100 billion on development. Critics argue this reflects a ‘more is better’ philosophy, where innovation is equated with sheer financial muscle.
China’s Approach: Efficiency and Restraint
China, by contrast, has invested heavily but with a different emphasis. In 2025, Chinese AI investment is reportedly projected at $98 billion, far below U.S. levels.
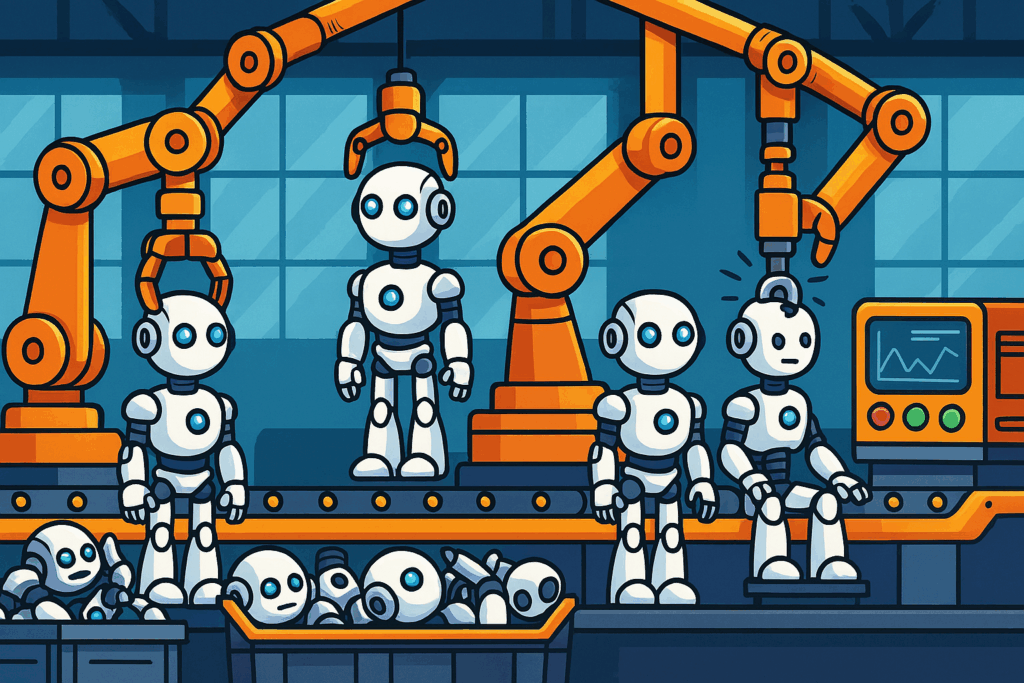
Yet Chinese firms have achieved notable progress by focusing on cost-efficient innovation. For example, AI2 Robotics developed a model requiring less than 10% of the parameters used by Alphabet’s RT-2, demonstrating a commitment to leaner, more resource-conscious design.
Foreign investors are increasingly drawn to China’s cheaper valuations, which are roughly one-quarter of U.S. equivalents.
This efficiency stems from lower research costs, government-led initiatives, and a culture of frugality shaped by regulatory pressures and limited access to advanced hardware.
Rather than chasing scale, Chinese firms often prioritise practical applications and affordability, enabling broader adoption across industries.
Doing More with Less?
The evidence suggests that China has achieved competitive outcomes with far fewer resources, while the U.S. has arguably overpaid in pursuit of dominance.
However, the U.S. still leads in infrastructure, talent, and global influence. China’s strength lies in its ability to innovate under constraints, turning scarcity into efficiency.
Ultimately, the question is not whether one side has ‘overinvested’ or ‘underinvested’, but whether their strategies align with long-term sustainability.
The U.S. risks a bubble fuelled by excess capital, while China’s leaner approach may prove more resilient. In this sense, China is indeed ‘doing more with less’—but whether that will be enough to surpass U.S. dominance remains uncertain.
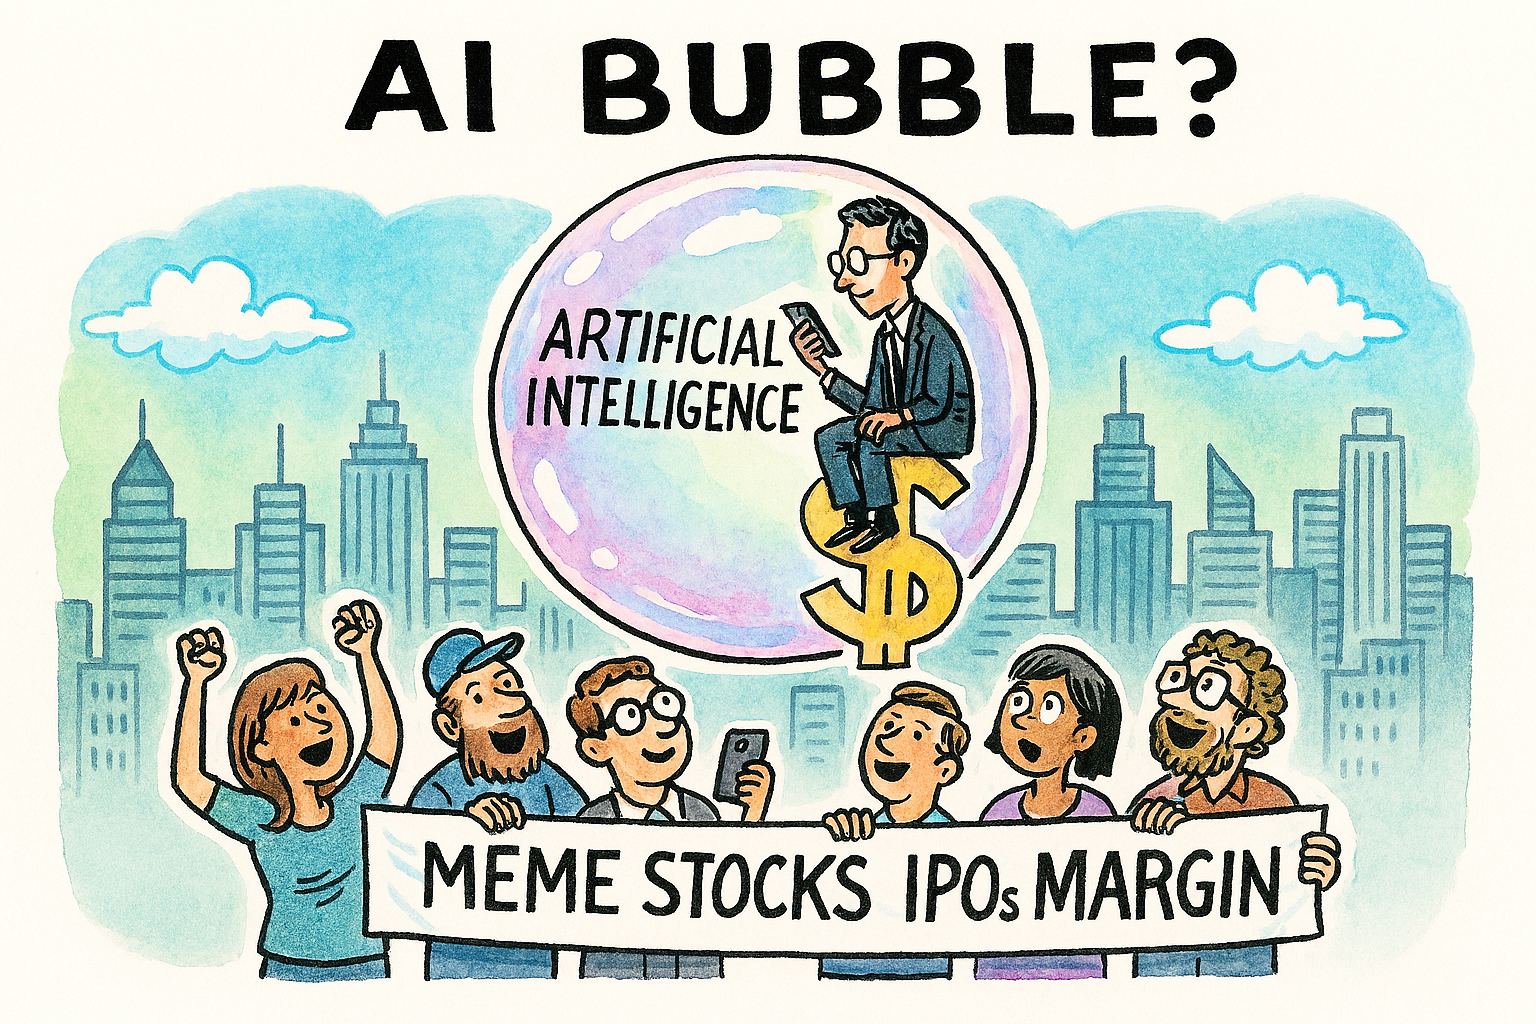
Bubble vulnerability
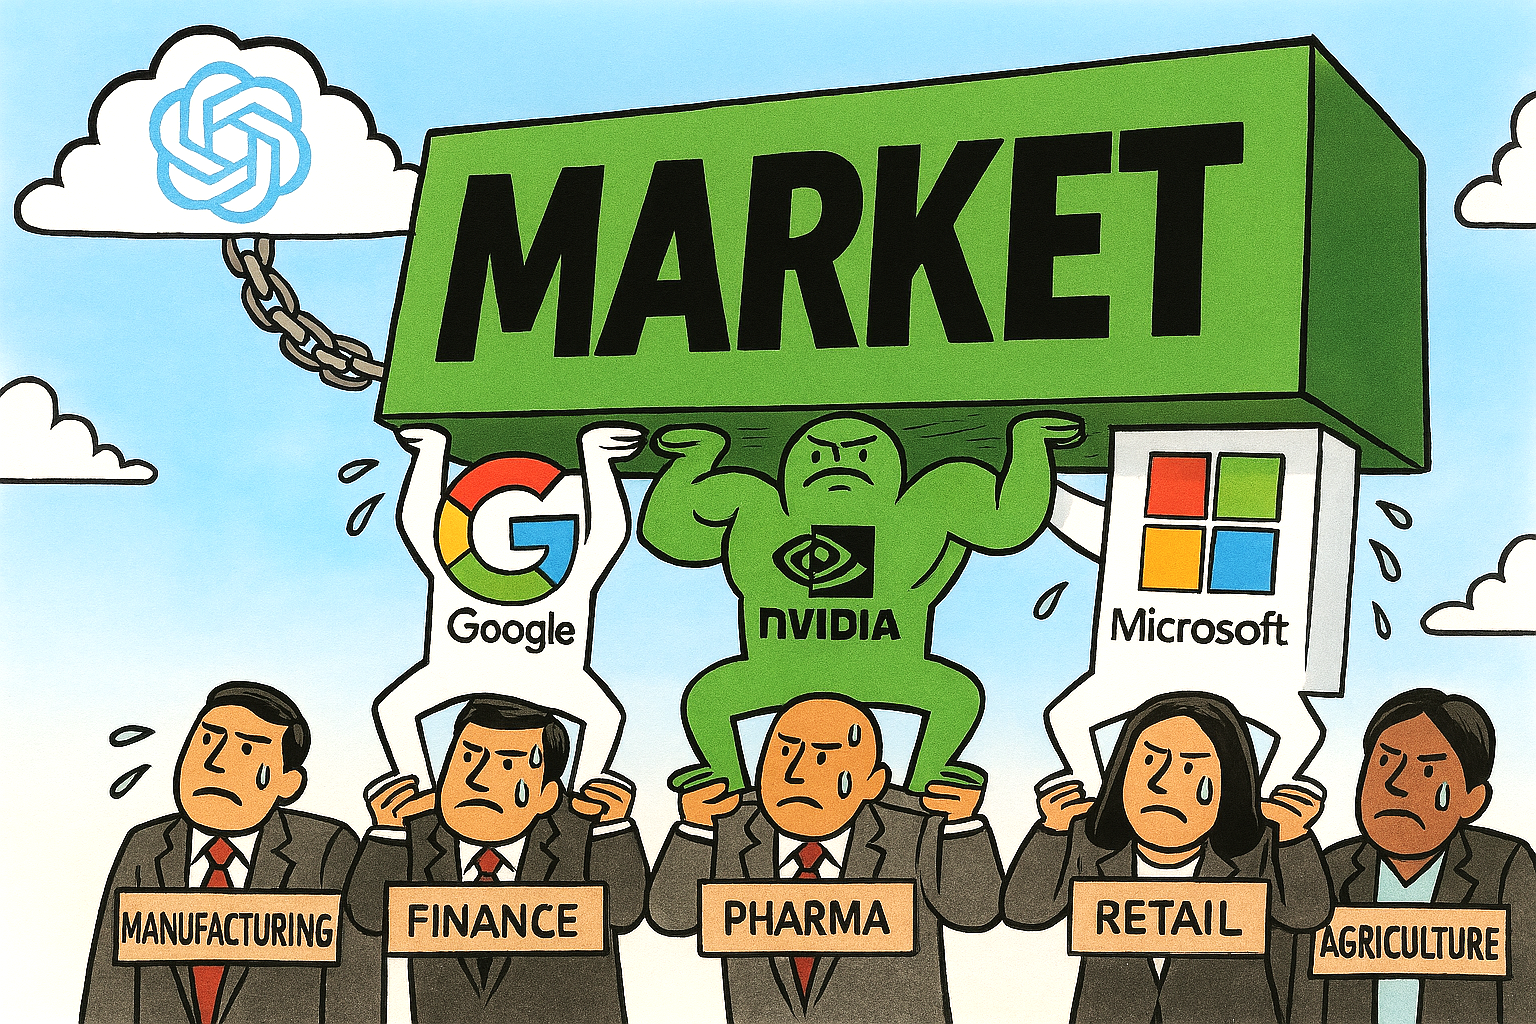
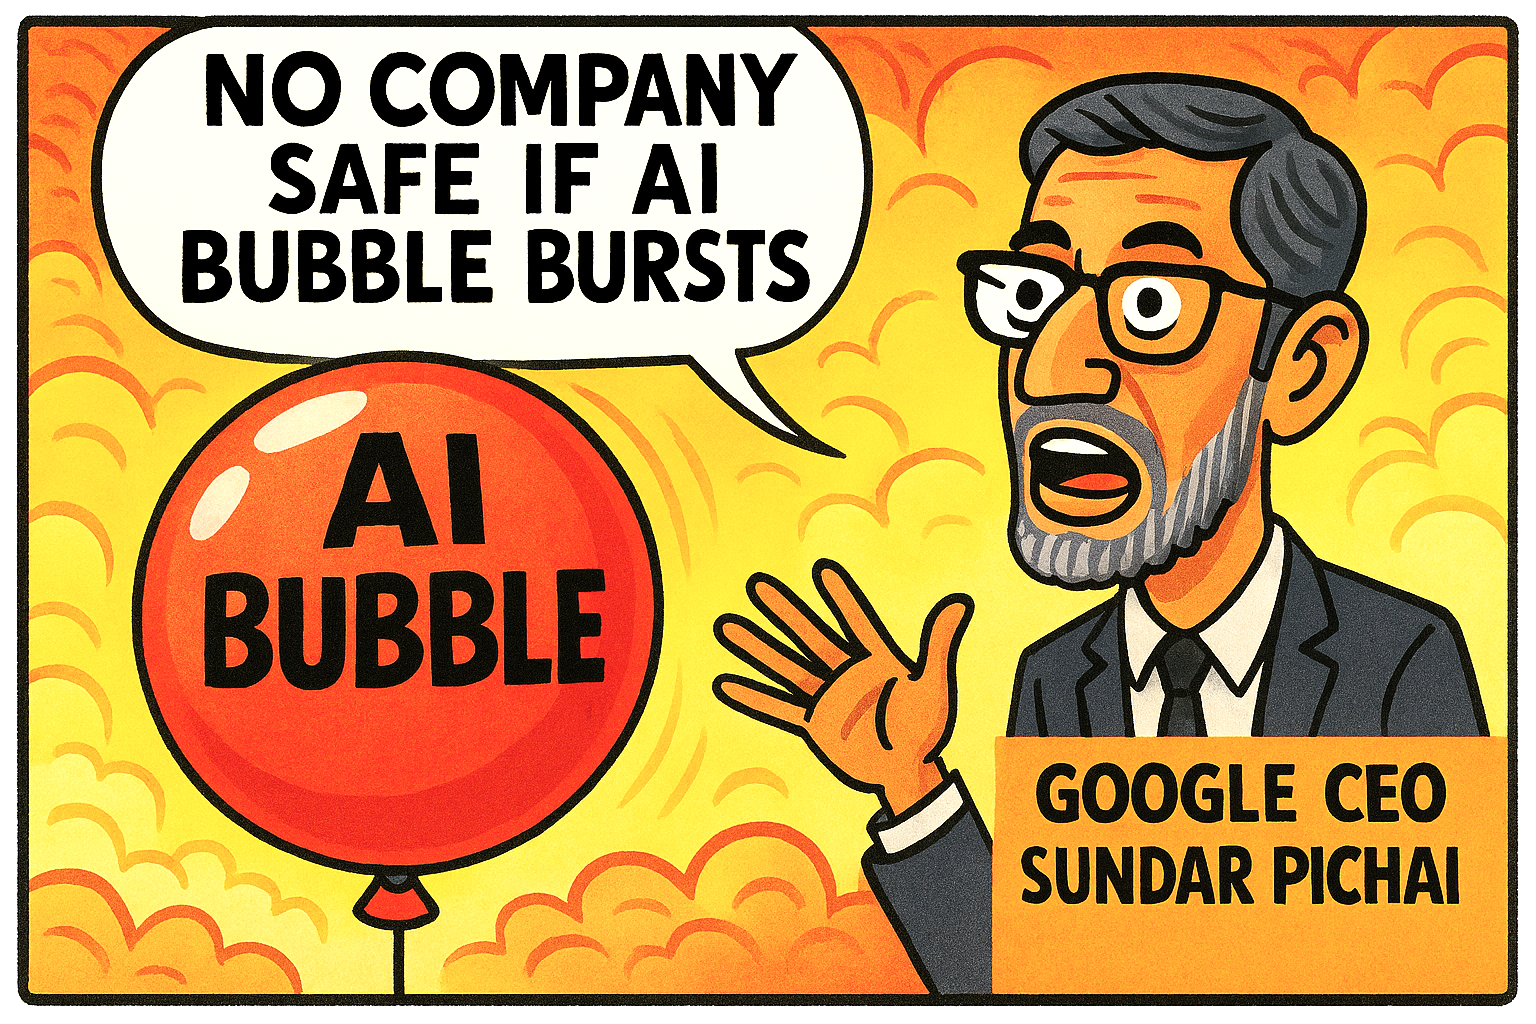
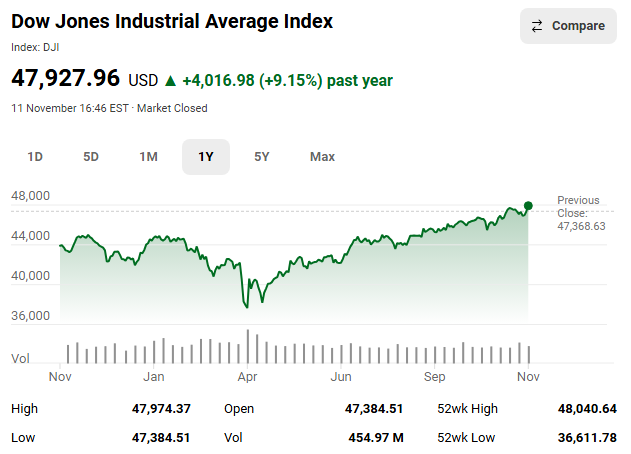
The sheer scale of U.S. AI investment has left the industry vulnerable to bubble shock, as valuations and spending appear increasingly detached from sustainable returns.
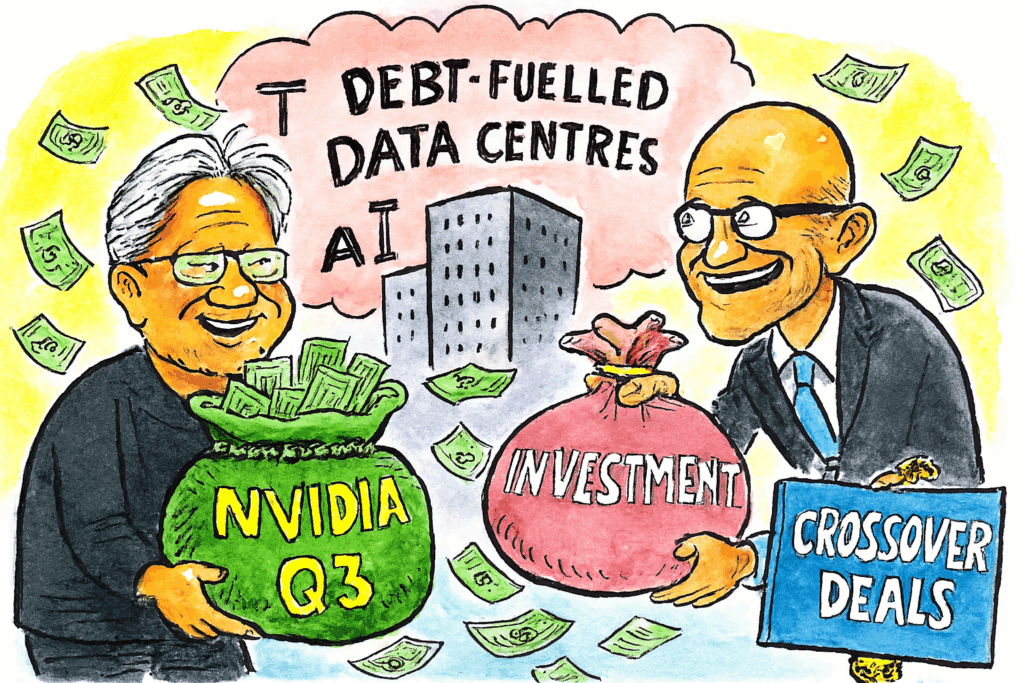
Analysts warn that the U.S. equity market is showing signs of an AI-driven bubble, with trillions poured into data centres, chips, and generative models at unprecedented speed.
While this has fuelled rapid innovation, it has also created irrational exuberance reminiscent of the dot-com era, where hype outpaces monetisation.
If growth expectations falter or capital tightens, the U.S. could face sharp corrections across tech stocks, credit markets, and employment, exposing the fragility of an industry built on extraordinary but potentially unsustainable levels of investment.