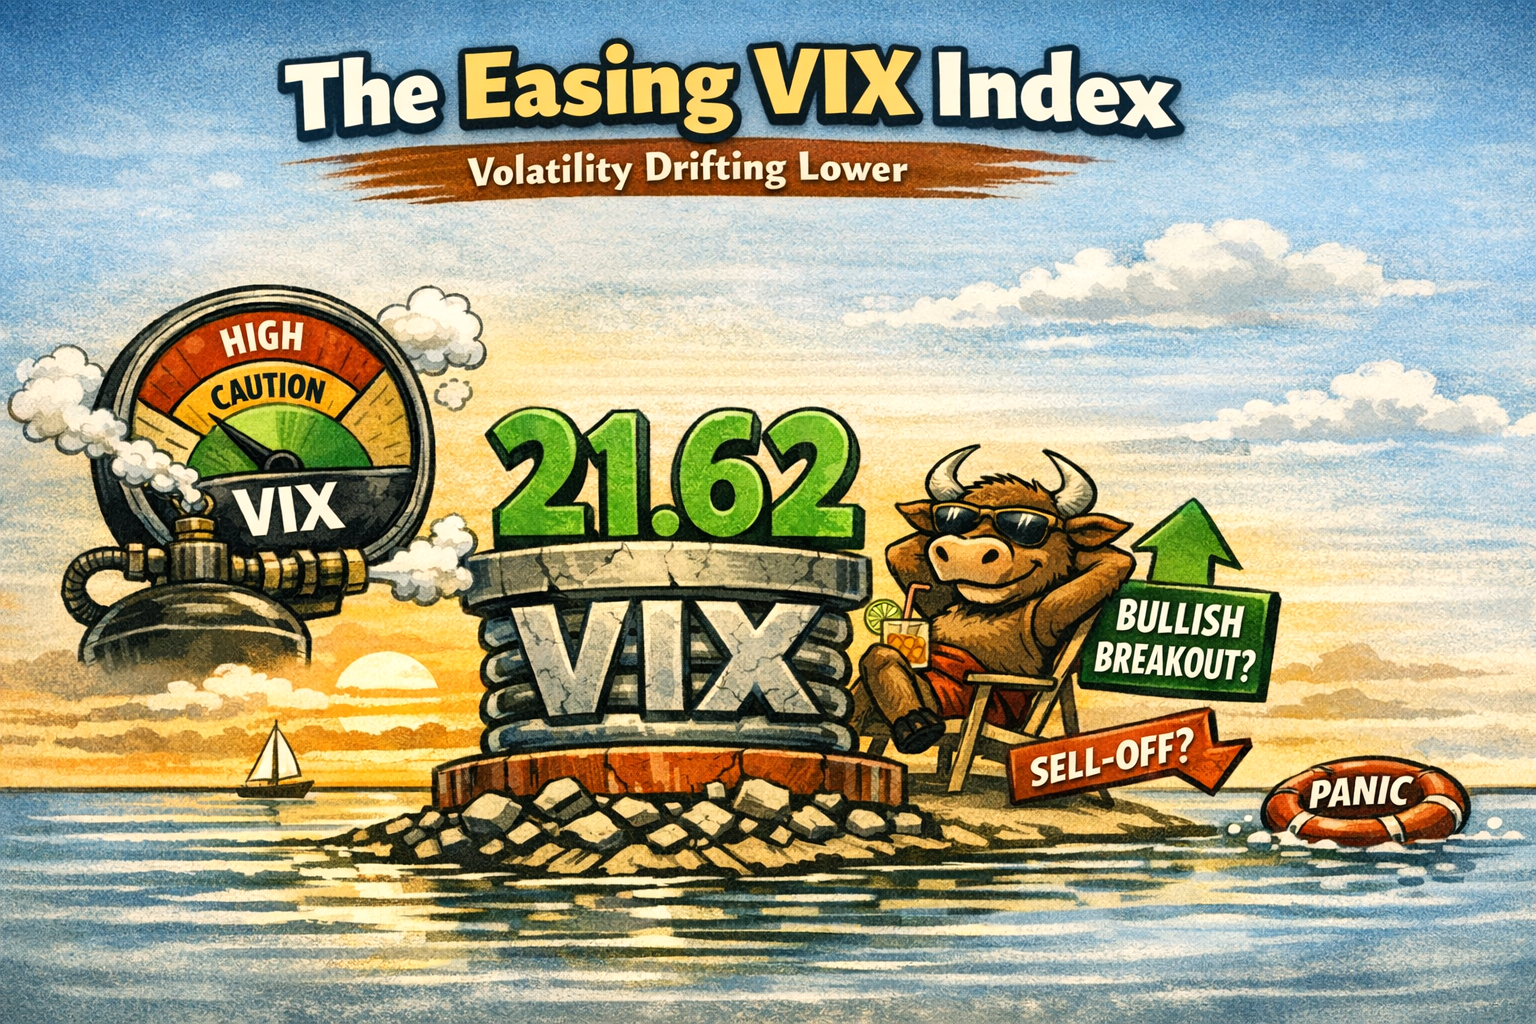
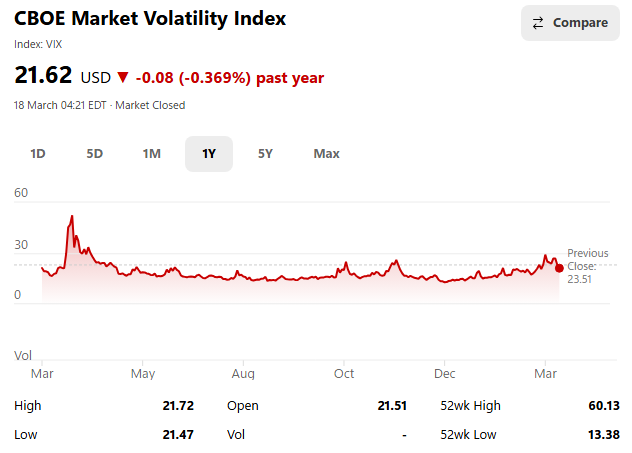
The VIX index currently (18th March 2026 – 8:30GMT) at 21.62, down around 8% from its previous close of 23.51. This drop suggests a modest easing in market fear, despite looming catalysts like the Fed decision and geopolitical tension.
VIX Snapshot – 18th March 2026
Metric
Value
Current Price
21.62 USD
Previous Close
23.51 USD
Day Change
−1.89 Down 8%
Intraday High/Low
21.72 / 21.47
52-Week High/Low
60.13 / 13.38
One-year market volatility index snapshot image 18th March 2026 at approx: 08:30 GMT
Implications
Still Elevated: A VIX above 20 suggests lingering unease, even if not full-blown panic.
Compression Context: This aligns with your “coiled spring” thesis — volatility is contained but not absent.
Directional Bias: If VIX continues to fall post-Fed, it supports a bullish breakout. A spike, however, would signal risk-off sentiment and potential sell-off.
During the day, the Dow had surged around 480 points, the S&P 500 had climbed 1.73%, and the Nasdaq had risen over 2%.
Dow Jones one day chart 7th August 2024
Dow Jones one day chart 7th August 2024
S&P 500 one day chart 7th August 2024
S&P 500 one day chart 7th August 2024
Nasdaq Composite one day chart 7th August 2024
Nasdaq Composite one day chart 7th August 2024
However, a downturn in Nvidia and other major tech stocks, after an initial rise, led to a significant drop in the afternoon. Nvidia retracted by 5.1%, Super Micro Computer plummeted 20.1% following its fiscal Q4 earnings missing analyst predictions, Tesla fell 4.4%, and Meta Platforms decreased by 1%.
Nvidia one day chart 7th August 2024
Nvidia one day chart 7th August 2024
One month chart Super Micro Computer 7th August 2024
One month chart Super Micro Computer 7th August 2024
Nvidia one day chart 7th August 2024
Nvidia one day chart 7th August 2024
The U.S.10-year Treasury yield continued to rise, increasing by about six basis points to 3.95%, returning to its level before the disappointing job figures last Friday, which had sparked concerns of an economic slowdown.
The Volatility Index (CBOE), the so called ‘fear gauge‘ was trading at around 29, having dropped to as low as 22 earlier in the day. This sharp decrease from Monday 5th August 2024 suggests that investor fears are subsiding, however, they remain higher than at the beginning of the month.