IBM Shares Slide as AI Threatens Its Legacy Stronghold

AI and IBM

When artificial intelligence first ignited investor enthusiasm, it lifted almost every major technology stock.

The narrative was simple: AI would transform industries, boost productivity and unlock vast new revenue streams.

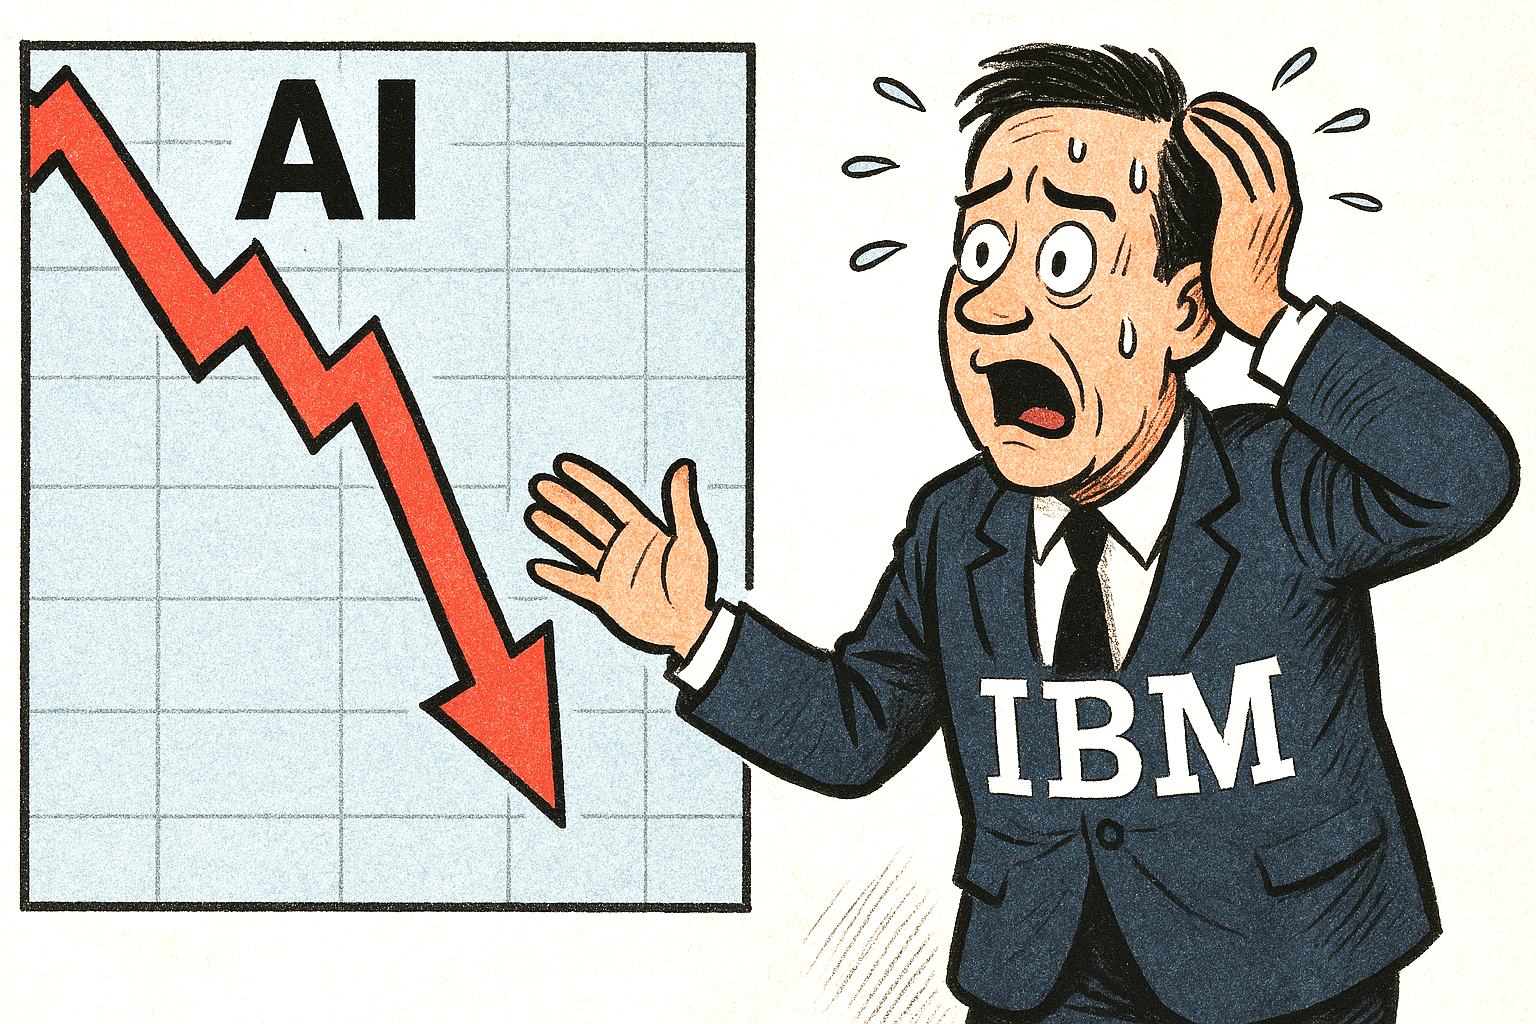
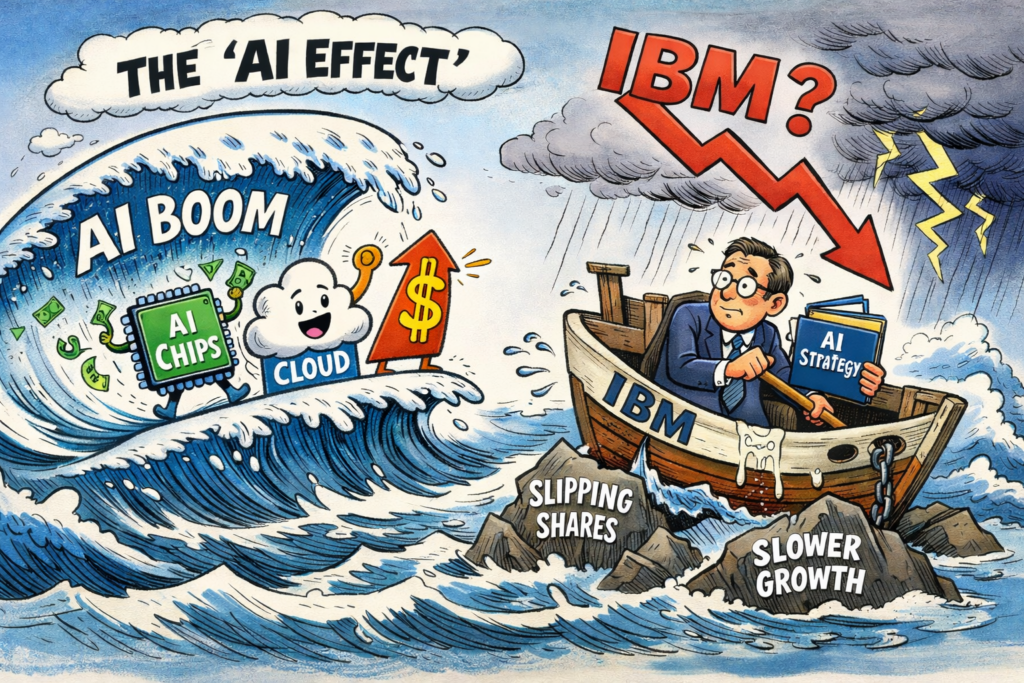
Yet as the cycle matures, markets are becoming more selective. In recent weeks, shares of IBM have drifted lower, illustrating how the ‘AI effect’ can cut both ways.

At first glance, IBM should be a prime beneficiary. The company has spent years repositioning itself around hybrid cloud infrastructure, data analytics and enterprise AI solutions.

Its Watson platform has been refreshed with generative AI tools designed to automate customer service, streamline software development and enhance business decision-making. Management has repeatedly emphasised AI as a core growth engine.

Market Expectations

However, the market’s expectations have shifted. Investors are increasingly rewarding companies that sit at the very heart of AI infrastructure — those supplying advanced semiconductors, high-performance computing capacity and hyperscale cloud services.

These businesses are reporting visible surges in AI-related demand, often accompanied by sharp revenue acceleration and expanding margins.

By contrast, IBM’s AI exposure is embedded within broader consulting and software operations, making its growth trajectory appear steadier rather than explosive.

This distinction matters in a momentum-driven environment. When earnings updates fail to deliver dramatic upside surprises, shares can quickly lose favour.

Less AI Effect

IBM’s results have shown progress in software and recurring revenue, but they have not reflected the kind of dramatic AI-driven uplift seen elsewhere in the sector. For some investors, that raises questions about competitive positioning and pricing power.

There is also a perception issue. Despite its reinvention efforts, IBM still carries the legacy image of a mature technology conglomerate rather than a cutting-edge AI disruptor.

In a market captivated by bold innovation stories, narrative can influence valuation just as much as fundamentals.

If capital flows concentrate in a handful of high-growth AI names, diversified players may struggle to keep pace in share price performance.

AI Tension

Yet the sell-off may also highlight a deeper tension within the AI theme. Enterprise adoption of AI tools tends to be gradual, cautious and closely tied to measurable productivity gains.

IBM’s strategy is built around long-term integration rather than short-term hype. While that approach may lack immediate fireworks, it could prove more durable as corporate clients prioritise reliability, governance and cost control.

For now, though, the AI effect is amplifying investor discrimination. In a market eager for rapid transformation, IBM’s more measured path has translated into weaker share performance — a reminder that not all AI exposure is valued equally.

Further discussion

IBM has found itself on the wrong side of the artificial intelligence boom, with its shares tumbling more than 13% after Anthropic unveiled a new capability that directly targets one of the company’s most enduring revenue pillars: COBOL modernisation.

The sell‑off reflects a broader market anxiety that AI is beginning to erode long‑protected niches in enterprise technology, and IBM has become the latest high‑profile casualty.

For decades, IBM has been synonymous with mainframe computing and the maintenance of vast COBOL‑based systems that underpin global finance, government services, airlines, and retail transactions.

These systems are notoriously complex, expensive to update, and dependent on a shrinking pool of specialist developers.

Premium Brand

That scarcity has long worked in IBM’s favour, allowing it to charge a premium for modernisation and support.

Anthropic’s announcement threatens to upend that equation. Its Claude Code tool, the company claims, can automate the most time‑consuming and costly parts of understanding and restructuring legacy COBOL environments.

Tasks that once required teams of analysts months to complete—mapping dependencies, documenting workflows, identifying risks—can now be accelerated dramatically through AI‑driven analysis.

The implication is clear: modernising legacy systems may no longer require the same level of human expertise, nor the same level of spending.

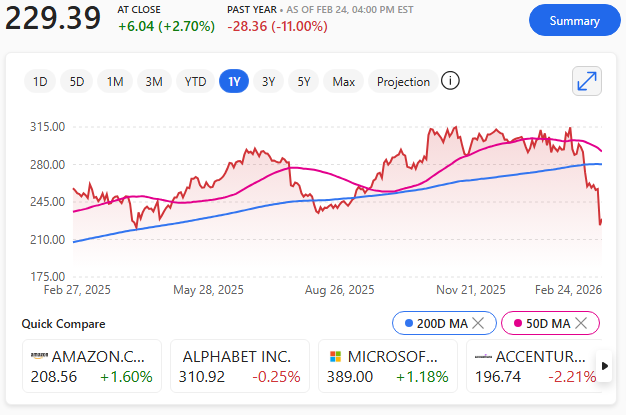
Investors reacted swiftly. IBM’s share price fell to $223.35, extending a year‑to‑date decline of more than 24% – recovering later to $229.39

IBM one-year chart as of 24th February 2026

The drop reflects not only concerns about lost revenue, but also the fear that IBM’s competitive moat—built on decades of institutional reliance on COBOL—may be eroding faster than expected.

The timing has amplified market jitters. Only days earlier, cybersecurity stocks were hit by another Anthropic announcement: Claude Code Security, a feature designed to scan codebases for vulnerabilities.

AI Mood Logic

The rapid expansion of AI into specialised technical domains has created a ‘sell first, ask questions later’ mood across the market, with investors increasingly wary of companies whose business models depend on labour‑intensive or legacy‑bound processes.

For IBM, the challenge now is to demonstrate that it can harness AI rather than be displaced by it.

The company has invested heavily in its own AI initiatives, but the latest market reaction suggests investors are unconvinced that these efforts will offset the threat to its traditional strongholds.

The AI revolution is reshaping the technology landscape at speed. IBM’s sharp decline is a reminder that even the industry’s oldest giants are not insulated from disruption—and that the next wave of AI competition may hit the most established players hardest.

But remember, this is IBM we are talking about.

Explainer

What is COBOL?

COBOL is an old but remarkably durable programming language created in the late 1950s to run business, finance, and government systems, and it’s still powering much of the world’s banking and administrative infrastructure today.

It was designed to read almost like plain English, making it easier for non‑technical managers to understand, and its stability means many core systems have never been replaced.

UK Chancellor Rachel Reeves’ £100 Billion Tax Haul: What Does Britain Have to Show for It?

UK Tax Haul - where has it gone?

The Treasury’s latest figures reveal that the UK government collected more than £100 billion in taxes in a single month — a staggering sum that ought to signal a nation investing confidently in its future.

Yet the public mood tells a different story. For many households and businesses, the question is simple: if the money is flowing in at record levels, why does so little feel improved?

High Tax = Stable Economy?

Chancellor Rachel Reeves has repeatedly argued that high tax receipts reflect a stabilising economy and the early impact of Labour’s ‘growth-first’ strategy.

(It could be argued that her first budget didn’t exactly help growth – remember higher employer N.I. changes)?

Income tax, corporation tax and VAT all contributed to the surge, boosted by wage inflation, fiscal drag, and stronger-than-expected corporate profits.

On paper, the numbers look impressive. In practice, the lived experience across the country is far less reassuring.

Public Services Stretched

Public services remain stretched to breaking point. NHS waiting lists have barely shifted, local councils warn of insolvency, and the school estate continues to creak under decades of underinvestment.

Commuters still face unreliable rail services, potholes remain a national embarrassment, and the promised acceleration of green infrastructure has yet to materialise in any visible way. For a government that insists it is rebuilding Britain, the early evidence is thin.

Reeves’ defenders argue that structural repair takes time. After years of fiscal instability, they say, the priority is stabilisation: paying down expensive debt, restoring credibility with markets, and creating the conditions for long-term investment.

More to Come

The UK Chancellor has also signalled that major spending commitments — particularly on housing, energy and industrial strategy — will ramp up later in the Parliament.

But this patience is wearing thin. Voters were promised renewal, not a holding pattern. When tax levels are at a post-war high, the public expects tangible returns: shorter hospital queues, safer streets, better transport, and a sense that the country is moving forward rather than treading water. Instead, many feel they are paying more for the same — or, in some cases, less.

The political risk for Reeves is clear. A £100 billion monthly tax take is a powerful headline, but it becomes a liability if people cannot see where the money is going.

Frustration?

Unless the government can convert revenue into visible progress — quickly and convincingly — the Chancellor may find that record receipts only fuel record frustration.

It’s a striking contradiction: a nation pulling in more than £100 billion in tax in a single month yet seeing almost none of the visible improvements such a windfall ought to deliver.

The reality is that much of this revenue is immediately swallowed by structural pressures — servicing an enormous debt pile, propping up struggling local authorities, covering inflation‑driven public‑sector pay settlements, and patching holes left by years of underinvestment.

What remains is too thinly spread to transform services that are already operating in crisis mode.

Slow Pace

High receipts don’t automatically translate into better outcomes when the state is effectively running just to stand still, and until the government can shift from firefighting to genuine renewal, even record‑breaking tax months will feel like money disappearing into a system that can no longer convert revenue into results.

First, it’s important to understand that a £100+ billion month (largely January, when self-assessment and corporation tax payments fall due) does not mean the government suddenly has £100 billion spare to spend. Most of it is absorbed by existing commitments.

Here’s broadly where UK tax revenue goes:

So, just how has the £100 billion tax haul likely been apportioned?

1. Health – The NHS

The National Health Service is the single largest area of public spending.
Funding covers:

  • Hospitals and GP services
  • Staff wages (doctors, nurses, support staff)
  • Medicines and equipment
  • Reducing waiting lists

Health alone consumes well over £180 billion annually.

2. Welfare & Pensions

The biggest slice of all is often social protection:

  • State pensions
  • Universal Credit
  • Disability benefits
  • Housing support

An ageing population means pension spending continues to rise.

3. Debt Interest

Servicing national debt is expensive.
With higher interest rates over the past two years, billions go purely on interest payments, not new services.

4. Education

Funding for:

  • Schools
  • Colleges
  • Universities
  • Early years provision

Teacher pay settlements and school building repairs are major costs.

5. Defence & Security

Including:

  • Armed forces
  • Intelligence services
  • Support for Ukraine
  • Nuclear deterrent maintenance

6. Transport & Infrastructure

Rail subsidies, road maintenance, major capital projects, and support during strikes or restructuring.

7. Local Government

Councils rely heavily on central funding for:

  • Social care
  • Waste collection
  • Housing services

So Why Doesn’t It Feel Like £100 Billion?

Because….

  • January is a seasonal spike, not a monthly average.
  • The UK still runs a large annual deficit.
  • Public debt is above £2.6 trillion.
  • Much of the revenue replaces borrowing rather than funds new projects.

In short, the money hasn’t vanished — it is largely sustaining an already over stretched ‘FAT’ state, servicing debt, and maintaining core services rather than delivering visible ‘new’ benefits.

As of January 2026, the Office for National Statistics (ONS) reported that public sector net debt excluding public sector banks stood at £2.65 trillion, which is approximately 96.5% of GDP.

While January 2026 saw a record monthly surplus of £30.4 billion — driven by strong self-assessed tax receipts — the overall debt burden remains historically high.

This level of debt reflects years of accumulated borrowing, pandemic-era spending, inflation-linked interest payments, and structural deficits.

Even with strong tax intake, the scale of the debt means that progress on reducing it is slow and incremental.