FTSE 100 closes in on 11000 as it hists new record high!

FTSE 100 hits new high!

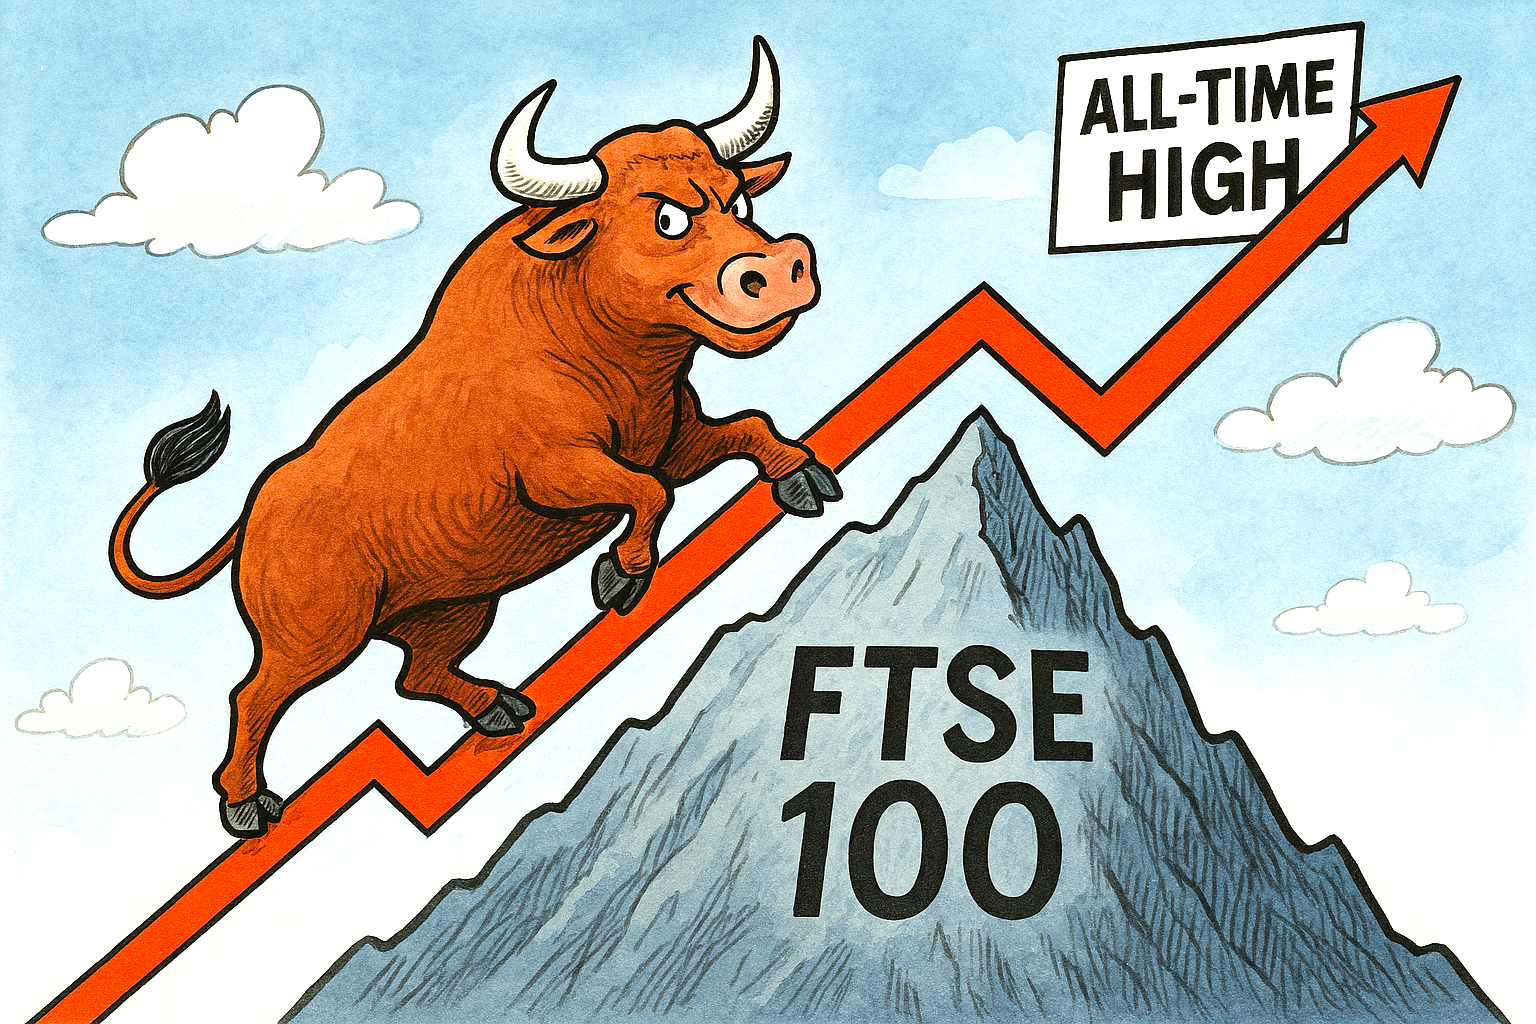
The FTSE 100 closed out last week by breaking through to a fresh all‑time high, underscoring a renewed wave of confidence in UK blue‑chip stocks.

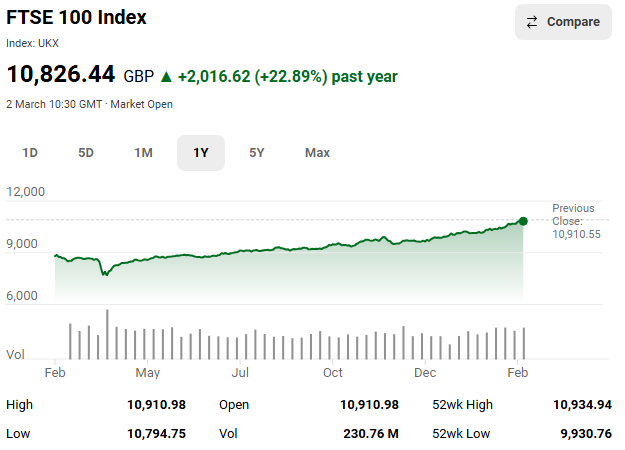
The index ended Friday at 10,910.55, marking a record close after also touching an intra‑day peak of 10,934.94 earlier in the session.

This milestone capped a strong run in which the FTSE 100 repeatedly outperformed its U.S. and European counterparts, buoyed by resilient earnings, firmer commodity prices, and a rotation by investors seeking comparatively lower valuations in London’s market.

Several factors helped propel the index higher. Rising oil and precious‑metal prices supported heavyweight energy and mining constituents, while financials such as HSBC also contributed to the rally with upbeat results and improved outlooks.

FTSE 100 one-year chart

Sector mix

Analysts noted that the FTSE’s sector mix—rich in defensives and less exposed to the more volatile AI‑driven tech trade—has offered investors a measure of stability during a period of global uncertainty.

The latest surge leaves the index within striking distance of the 11,000 mark, a level that would have seemed ambitious only months ago.

With the FTSE 100 already up nearly 10% for the year to date, attention now turns to whether this momentum can be sustained as markets digest geopolitical tensions, shifting tariff policies, and the next round of corporate earnings.

U.S. Core Wholesale Prices Jump 0.8% in January 2026, Raising Fresh Inflation Concerns

U.S. inflation

U.S. core wholesale prices rose 0.8% in January 2026, a sharper-than-expected acceleration that has renewed concerns about lingering inflationary pressures across the American economy.

The increase, reported by the Bureau of Labor Statistics, exceeded both December 2025’s 0.6% rise and the consensus expectation of 0.3%, marking one of the strongest monthly gains in recent months.

The core U.S. Producer Price Index (PPI), which strips out volatile food and energy components, is closely watched as an indicator of underlying cost pressures faced by businesses.

January’s jump suggests that inflationary forces remain embedded in key service sectors, even as goods prices continue to soften.

Indeed, services were the primary driver of the month’s overall wholesale inflation, with final demand services advancing 0.8%, while goods prices fell by 0.3% amid notable declines in gasoline and several food categories.

Divergence

This divergence between services and goods highlights a structural shift in inflation dynamics. Goods inflation has eased significantly as supply chains normalise and commodity prices stabilise.

By contrast, service-sector inflation—often tied to labour costs, logistics, and profit margins—has proven more persistent.

January 2026’s data underscores this trend, with strong increases in areas such as professional and commercial equipment wholesaling, telecommunications access services, and health and beauty retailing.

Complicates Inflation Outlook

For policymakers, the report complicates the inflation outlook. While headline PPI rose a more modest 0.5%, the strength of the core measure suggests that underlying pressures may not be cooling as quickly as hoped.

Markets had been anticipating a gradual easing that would give the Federal Reserve more confidence to consider rate cuts later in the year.

Instead, the January 2026 figures may reinforce a more cautious stance, particularly if upcoming consumer inflation data echoes the same pattern.

Businesses and consumers alike will be watching February 2026’s data closely to determine whether January represents a temporary spike or the beginning of a more stubborn inflation trend.