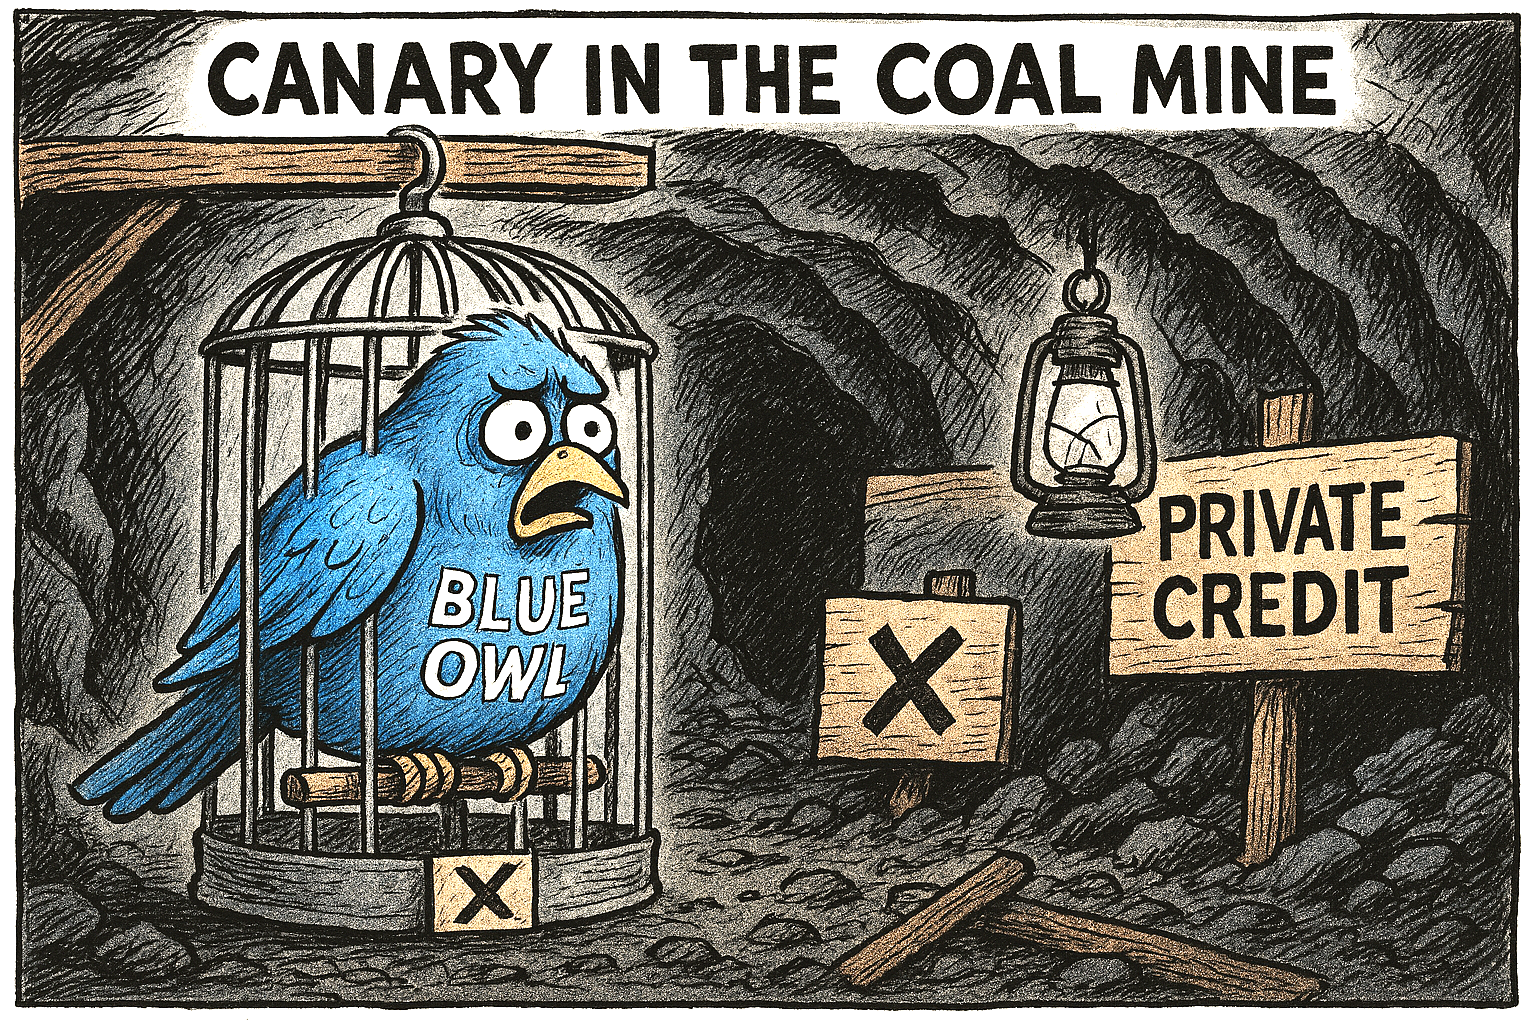
Blue Owl’s decision to halt investor withdrawals at one of its flagship retail‑focused private credit vehicles has sent a jolt through a market long celebrated for its resilience.
The move, centred on Blue Owl Capital Corporation II (OBDC II), marks one of the most significant stress signals yet in the rapidly expanding private credit sector.
Redemption
The firm confirmed that investors in OBDC II will no longer be able to redeem shares on a quarterly basis, ending a mechanism that previously allowed withdrawals of up to 5% of net asset value each quarter.
The redemption facility had already been paused in November 2025 as withdrawal requests accelerated, but the permanent halt represents a decisive shift.
To meet liquidity needs and prepare for a partial return of capital, Blue Owl has sold a substantial portion of its loan book.
Reportedly around $600 million of assets were offloaded from OBDC II as part of a wider $1.4 billion sale across three funds, with the firm planning to return 30% of the fund’s value to investors by the end of March.
Reaction
Markets reacted swiftly. Shares in Blue Owl fell between 6% and 10% across recent trading sessions, touching their lowest levels in more than two years.
The sell‑off was fuelled not only by the redemption freeze but also by broader concerns about the firm’s exposure to software‑sector borrowers — an area facing valuation pressure and heightened sensitivity to disruption from artificial intelligence.
The episode has reignited debate about the structural vulnerabilities of private credit, a market now estimated at $1.8 trillion.
The model relies on illiquid loans packaged into vehicles that promise periodic liquidity to investors — a mismatch that works only as long as redemption requests remain manageable.
Blue Owl’s move suggests that, under stress, even well‑established managers may be forced into asset sales or wind‑down scenarios.
Contagion?
Contagion fears quickly spread across the sector. Shares of major alternative‑asset managers, including Apollo, Blackstone and TPG, all declined sharply as investors reassessed liquidity risks in retail‑facing credit products.
For now, Blue Owl insists that capital will continue to be returned through loan repayments and asset sales.
But the permanent closure of redemptions at OBDC II stands as a stark reminder: the private credit boom is entering a more volatile phase, and liquidity — once taken for granted — is becoming the industry’s most fragile commodity.
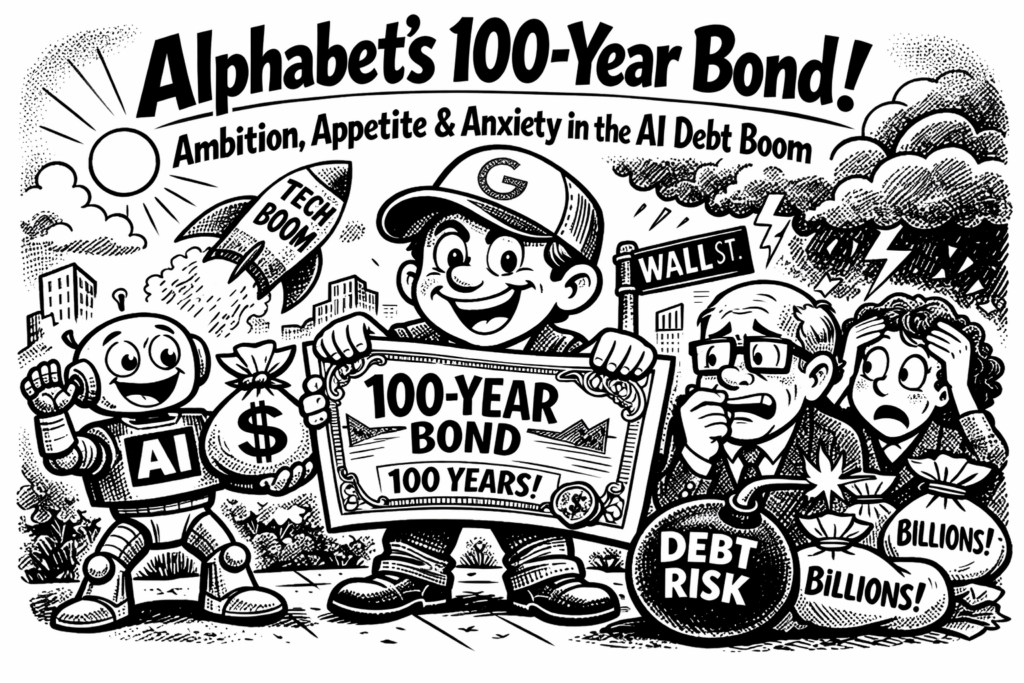
Alphabet’s decision to issue a 100-year sterling bond has captured the attention of global markets, not only because of its rarity but also because of what it signals about the escalating competition in artificial intelligence.
100 year sterling bond
A century-long bond denominated in pounds is an extraordinary financing move, particularly for a technology company.
It reflects both investor confidence in Alphabet’s long-term prospects and the scale of capital now required to compete in the AI era.
On the surface, the benefits are clear. Locking in funding for 100 years at today’s rates provides financial certainty. Alphabet can secure vast sums of capital without facing refinancing risk for generations.
In an industry defined by rapid change and enormous upfront costs — from data centres and semiconductor procurement to specialised AI chips and energy infrastructure — patient capital is invaluable.
Sterling
The sterling denomination also diversifies Alphabet’s funding base beyond U.S. dollar markets, potentially appealing to European institutional investors seeking stable, long-duration assets.
The bond may also be interpreted as a strategic signal. By committing to long-term financing, Alphabet demonstrates confidence in its ability to generate cash flows well into the next century.
It reinforces the company’s image as a durable, infrastructure-like enterprise rather than a volatile technology stock.
For investors such as pension funds and insurers, a 100-year instrument from a highly rated issuer can offer predictable returns in a world where long-term yield is scarce.
Cyclical
However, the move is not without shortcomings. Committing to fixed debt obligations over such an extended horizon reduces flexibility. While Alphabet currently enjoys strong balance sheet metrics, the technology sector is notoriously cyclical.
A century is an eternity in innovation terms. Business models, regulatory frameworks and geopolitical dynamics may shift dramatically.
Future generations of management will inherit the obligation, regardless of whether today’s AI investments deliver the expected returns.
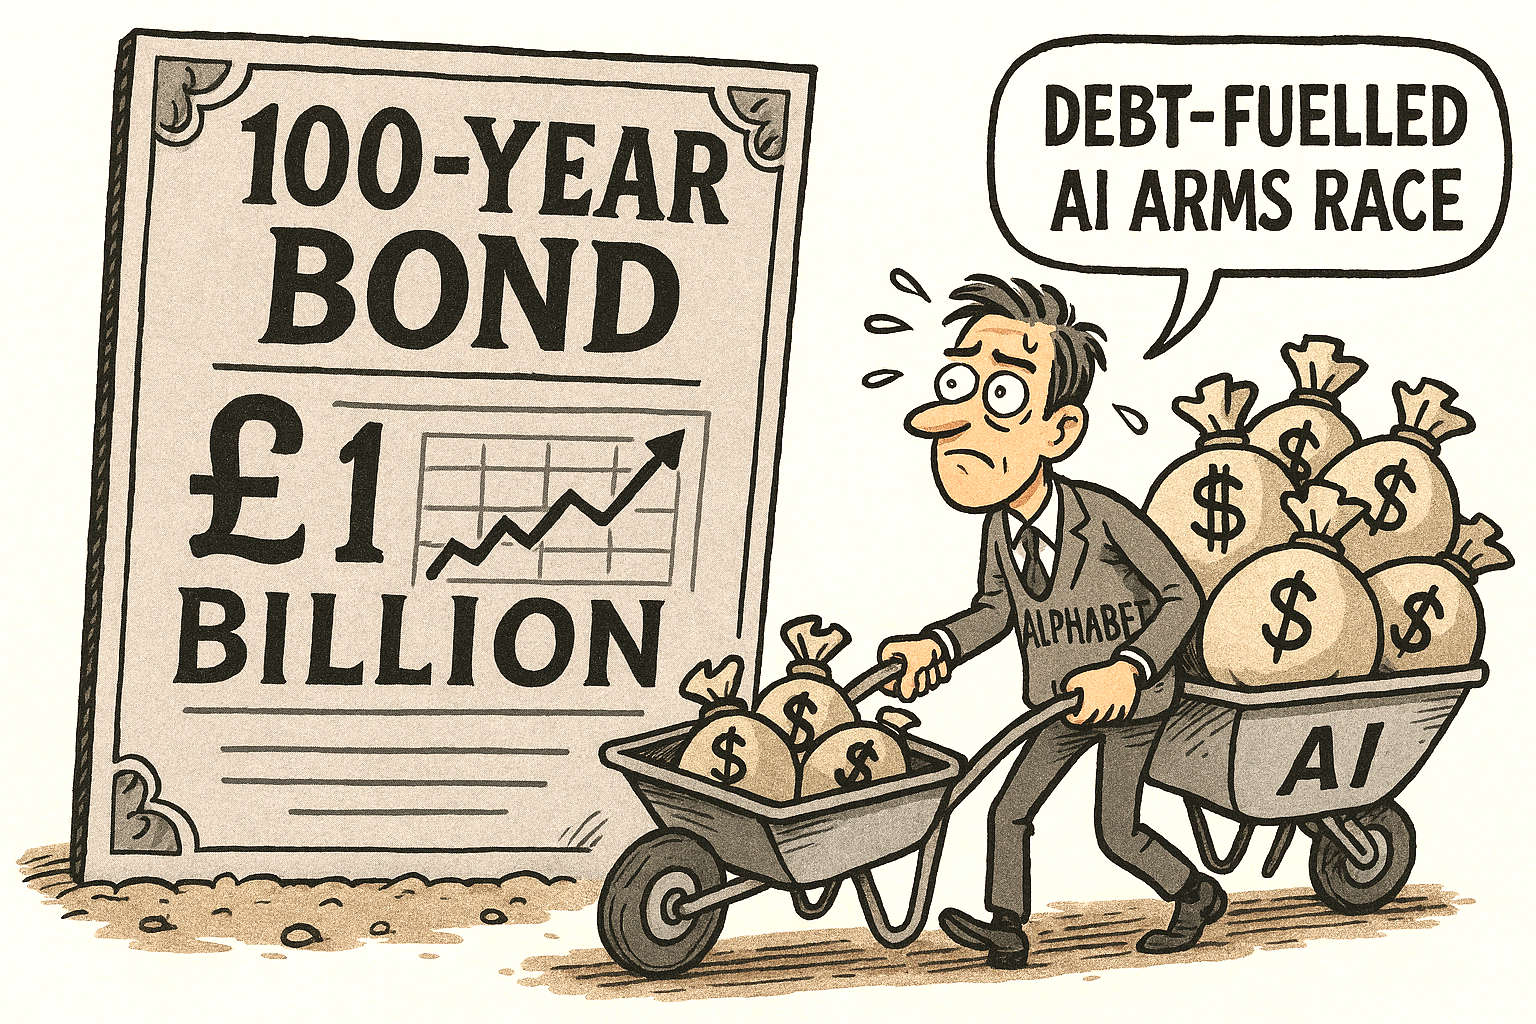
More broadly, the bond feeds concern about a debt-fuelled AI arms race. As technology giants pour tens of billions into AI research, chip design and cloud infrastructure, borrowing is becoming an increasingly prominent tool.
If rivals respond with similar long-dated issuance, the sector’s leverage could rise meaningfully. In a downturn or if AI monetisation disappoints; heavy debt burdens could amplify financial strain.
Ultimately, Alphabet’s 100-year sterling bond embodies both ambition and risk. It underlines the immense capital demands of the AI revolution while raising questions about whether today’s competitive fervour is encouraging companies to stretch their balance sheets too far in pursuit of technological dominance.
Systemic anxiety
The deeper anxiety is systemic. With Oracle, Amazon, Microsoft and others also scaling up borrowing, total tech‑sector issuance is projected to hit $3 trillion over five years.
Some analysts warn this resembles a late‑cycle credit boom, where investors chase thematic excitement rather than sober fundamentals.
Alphabet’s century bond may be a masterstroke of timing — or a marker of excess.
Either way, it crystallises the tension at the heart of the AI revolution: extraordinary promise, financed by extraordinary debt.
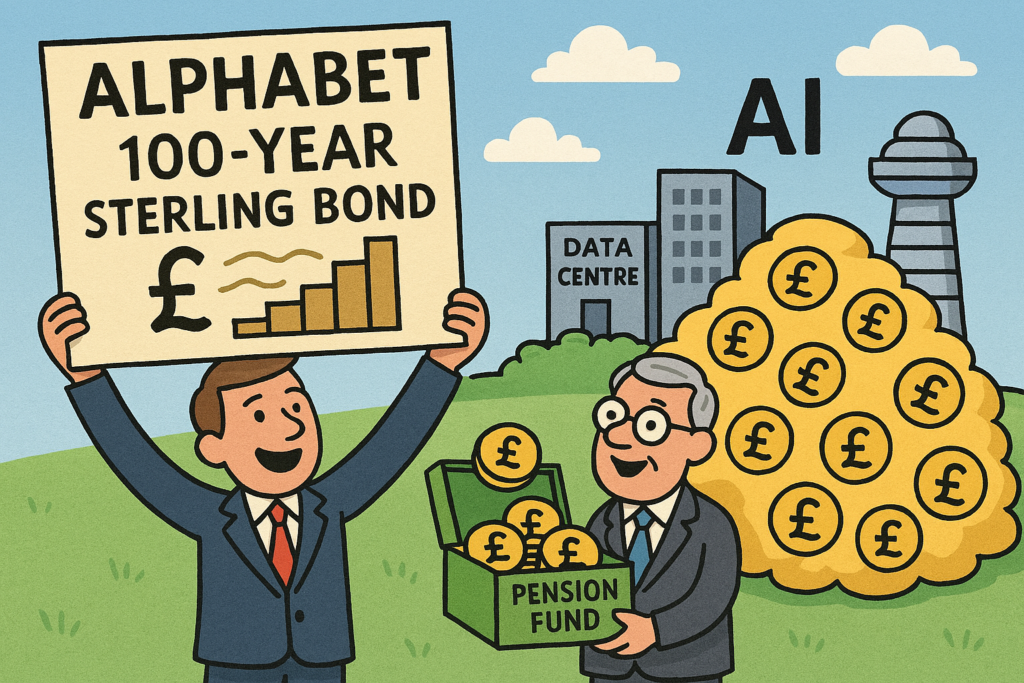
Why a Sterling Bond?
Alphabet issued its 100‑year sterling bond to tap deep UK demand for ultra‑long‑dated assets, especially from pension funds seeking to match long‑term liabilities.
The sterling market offered strong appetite, with orders reportedly reaching nearly ten times the £1 billion on offer.
It also formed part of Alphabet’s broader multi‑currency fundraising drive to finance massive AI‑related capital spending, including data‑centre expansion.
Issuing in sterling diversified its investor base, reduced reliance on U.S. dollar markets, and signalled confidence in its long‑term stability as a quasi‑infrastructure‑scale business.
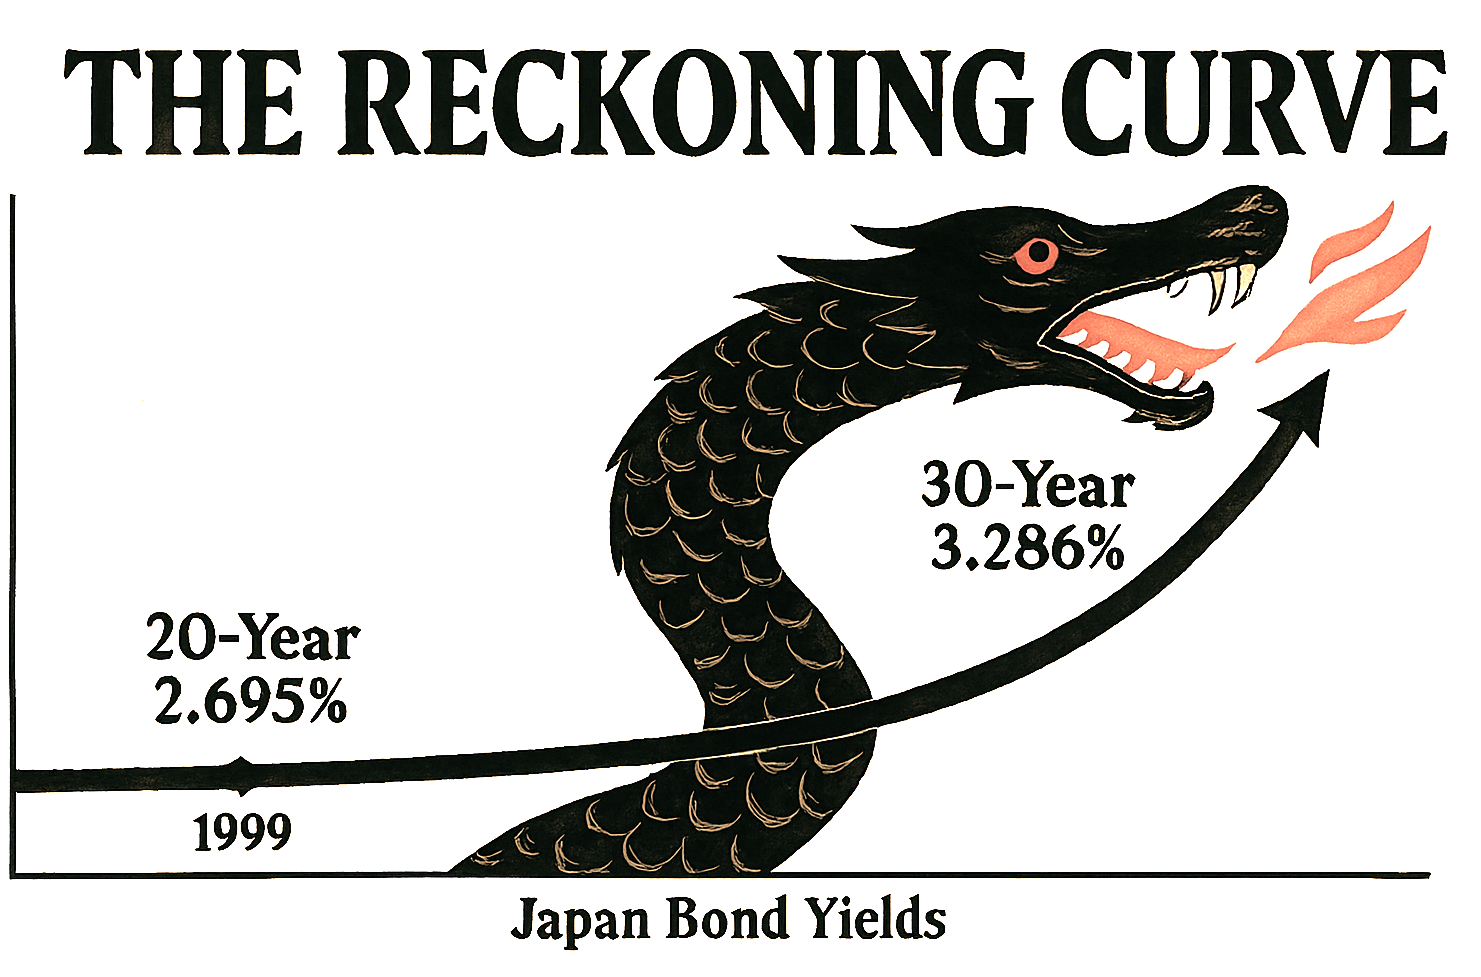
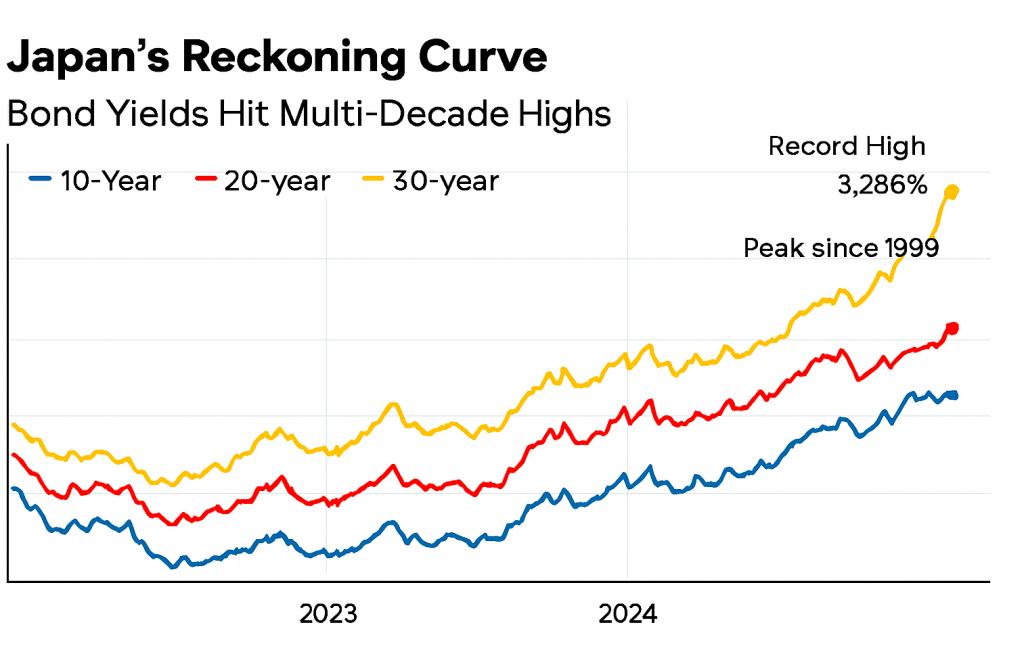
After decades of economic sedation, Japan’s long-term bond yields are rising with a vengeance.
The 30-year government bond has breached 3.286%—its highest level on record—while the 20-year yield has climbed to 2.695%, a peak not seen since 1999.
These aren’t just numbers; they’re seismic signals of a nation confronting its delayed past, now its deferred future.
Indicative Yield Curve for Japan
For years, Japan’s yield curve was a monument to inertia. Negative interest rates, yield curve control, and relentless bond-buying by the Bank of Japan created an artificial calm—a kind of economic Zen garden, raked smooth but eerily still.
That era is ending. Inflation has persisted above target for three years, and the BOJ’s retreat from monetary intervention has unleashed market forces long held at bay.
This steepening curve is more than financial recalibration—it’s a symbolic reckoning. Rising yields demand accountability: from policymakers who masked structural fragility, from investors who chased safety in stagnation, and from a society that postponed hard choices on demographics, debt, and productivity.
The bond market, once a passive witness, now acts as judge. Each basis point is a moral verdict on Japan’s economic past.
The shadows of the Lost Decades—deflation, aging populations, and overspending—are being dispelled not by command, but through the process of price discovery.
In this new era, Japan’s yield curve resembles a serpent uncoiling—no longer dormant but rising with intent.
The question isn’t whether the curve will flatten again, but whether Japan can meet the moment it has long delayed.
Investors are increasingly favouring short-term U.S. Treasury securities, with notable figures like Warren Buffett taking sizeable positions.
This shift is driven by concerns over economic instability, fluctuating bond yields, and government spending.
Short-term Treasuries, such as T-bills with maturities under a year, offer a safer haven compared to longer-term bonds, which are more vulnerable to interest rate changes.
As central banks navigate monetary policy adjustments, many investors prefer the flexibility of short-duration assets that minimise exposure to prolonged economic uncertainty.
One of the biggest influences in this trend is Berkshire Hathaway’s substantial stake in T-bills, which has reinforced confidence in these instruments.
Additionally, ultra-short bond ETFs like SGOV and BIL have seen significant inflows, highlighting the growing demand for liquid, low-risk investments.
Another key factor driving this strategy is concern over U.S. fiscal policy. Investors are wary of rising deficits and potential tax hikes, which could impact long-term bond stability.
By allocating funds to short-term Treasuries, they can mitigate risks while maintaining liquidity.
This surge in short-term Treasury investments reflects a broader shift in market sentiment-favouring stability and flexibility over long-term speculation.
As economic uncertainty persists, investors are likely to continue this defensive strategy.
SGOV & BIL ETFs explained
SGOV and BIL are both exchange-traded funds (ETFs) that invest in U.S. Treasury bills, offering a low-risk way to earn interest on short-term government debt.
SGOV (iShares 0-3 Month Treasury Bond ETF) tracks the ICE 0-3 Month U.S. Treasury Securities Index, investing in Treasury bonds with maturities of three months or less. It launched in 2020 and is known for its low expense ratio.
BIL (SPDR Bloomberg 1-3 Month T-Bill ETF) follows the Bloomberg 1-3 Month U.S. Treasury Bill Index, focusing on Treasury bills with maturities between one and three months.
It has been around since 2007 and is one of the largest T-bill ETFs.
Both ETFs provide exposure to ultra-short-term government securities, making them attractive options for investors seeking stability and liquidity in uncertain markets.
As of September 2024, the UK’s national debt stands at £2,685.6 billion, which is approximately 100% of the country’s GDP. This is the highest level of public sector debt since 1961.
UK debt and its borrowing
As of 2024, the United Kingdom’s national debt has reached a staggering £2,685.6 billion, an amount equivalent to the nation’s GDP. This surge in debt, driven by persistent borrowing, has sparked significant economic and political debate.
Historical context
The UK’s debt levels have fluctuated over time, influenced by wars, recessions, and policy decisions. However, the current debt level marks a significant peak not seen since the early 1960s.
The Financial Crisis of 2008 saw the debt-to-GDP ratio rise sharply as the government borrowed heavily to stabilize the banking sector and stimulate the economy. More recently, the COVID-19 pandemic necessitated extensive government borrowing to fund health services, furlough schemes, and business support measures, exacerbating the debt situation.
Government borrowing
Government borrowing, or public sector net borrowing, is the amount by which government expenditures exceed its revenues. This borrowing is essential for funding various public services, infrastructure projects, and welfare programs.
While borrowing can be a tool for stimulating economic growth, especially during downturns, it also raises concerns about fiscal sustainability and the burden on future generations.
Economic Implications
High levels of national debt can have profound economic implications. On the one hand, government spending can stimulate economic activity, create jobs, and drive growth. However, excessive borrowing can lead to increased interest payments, diverting resources from essential services like healthcare and education.
Additionally, high debt levels can reduce investor confidence, potentially leading to higher borrowing costs for the government and businesses.
Debt management strategies
The UK government employs various strategies to manage its debt. These include issuing government bonds to investors, which provide a relatively low-cost means of borrowing. The Bank of England also plays a crucial role, particularly through its monetary policies, such as setting interest rates and implementing quantitative easing programs.
The government’s fiscal policy, which includes tax and spending measures, is another key component in managing the debt.
The future
Looking ahead, the UK’s debt trajectory will depend on several factors, including economic growth rates, government policy decisions, and global economic conditions.
While reducing the debt burden is a priority, balancing fiscal responsibility with the need for economic stimulus remains a delicate act. Policymakers must navigate this complex landscape to ensure long-term economic stability and prosperity for future generations.
UK debt in direct relation to UK GDP from 1980 – 2024
Since the 1950s, UK debt has gone through several cycles. Post-World War II, debt was high due to reconstruction efforts.
The 1980s saw a decline in debt, thanks to privatisation and reduced public spending. However, the 2008 financial crisis caused a sharp increase, followed by more borrowing during the COVID-19 pandemic, reaching 100% of GDP in 2024.
UK public sector borrowing
Public sector debt as a proportion of GDP
How does the UK government borrow money?
The government raises funds by issuing financial instruments known as bonds. A bond represents a commitment to repay borrowed money in the future, typically with periodic interest payments until maturity.
UK government bonds, or ‘gilts’ are generally regarded as secure investments, carrying minimal risk of non-repayment. Institutions both within the UK and internationally, including pension funds, investment funds, banks, and insurance companies, are the primary purchasers of gilts.
Additionally, the Bank of England has purchased substantial amounts of government bonds in the past as an economic stimulus measure through a mechanism known as ‘quantitative easing’.
How much is the UK government borrowing?
The government’s borrowing fluctuates monthly. For example, in January, when tax returns are filed, there’s typically a surge in revenue as many pay a significant portion of their taxes at once. Therefore, it’s more informative to consider annual or year-to-date figures.
In the financial year ending March 2024, the government borrowed £121.9 billion. The latest data for September 2024 indicates borrowing at £16.6 billion, up by £2.1 billion compared to September 2023.
The national debt refers to the total amount owed by the government, which stands at approximately £2.8 trillion. This figure is comparable to the gross domestic product (GDP) of the UK, which is the total value of goods and services produced in the country annually.
The current debt level has more than doubled since the period from the 1980s up to the 2008 financial crisis. Factors such as the financial crash and the Covid pandemic have escalated the UK’s debt from its historical lows to where it is now.
However, when considering the economy’s size, the UK’s debt is relatively low compared to much of the previous century and to that of other major economies.
How much money does the UK government pay in interest?
As the national debt increases, so does the interest that the government must pay. This additional cost was manageable when interest rates were low throughout the 2010s, but it became more burdensome after the Bank of England increased interest rates.
The government’s interest payments on the national debt are variable and reached a 20-year peak in early October 2023. Approximately a quarter of the UK’s debt is tied to inflation, meaning that payments increase with rising inflation.
This situation led to a significant rise in the cost of debt service, though these payments have begun to decrease. If the government allocates more funds to debt repayment, it could result in reduced spending on public services, which were the original reason for the borrowing.
In conclusion, while the UK’s debt and borrowing levels present challenges, strategic management and informed policy decisions will be crucial in navigating the path forward.
The UK debt total vs GDP is now as of 2024 all but 100%
Stocks retreated Friday as a surge in the 10-year Treasury yield prompted broader concerns about the state of the economy.
The Dow Jones Industrial Average (DJIA) is one of the most widely followed stock market indices in the world. It tracks the performance of 30 large U.S. companies from various sectors, such as Boeing, Coca-Cola, Apple and Walmart.
The DJIA is often used as a proxy for the overall health of the U.S. economy and investor sentiment.
Market pressure
Lately, the DJIA has been under pressure as U.S. Treasury yields have climbed to their highest levels in over sixteen years.
Treasury yields are the interest rates that the U.S. government pays to borrow money by issuing bonds. When Treasury yields rise, it means that investors are demanding higher returns to lend money to the government, which reflects their expectations of higher inflation and economic growth.
Treasury yields
Higher Treasury yields can have a negative impact on the stock market for several reasons. Firstly, they increase the borrowing costs for companies and consumers, which can affect spending and profits.
Secondly, they make bonds more attractive as an alternative investment to stocks, which can reduce the demand for equities.
Thirdly, they can signal that the Federal Reserve may tighten its monetary policy sooner than expected, which can also dampen the stock market’s momentum.
The DJIA has fallen by more than 300 points in recent days as Treasury yields climbed above 5%, a level not seen since 2007. The rise in yields was driven by strong economic data, such as the September 2023 consumer price index (CPI), which showed that inflation remained elevated at 3.7% year-over-year. But only 1.7% off the Fed target of 2%.
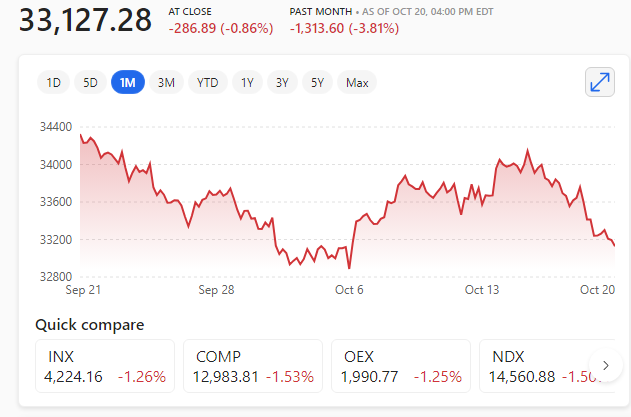
Dow Johns Industrial Average close 20th September 2023
U.S. 10-year Treasury yield hits 5% for the first time since 2007 – Dow closes down nearly 300 points
The S&P 500 lost 1.26% to 4,224. The Nasdaq dropped 1.53% to 12,984. The Dow Jones Industrial Average lost 287 points, or 0.86%, to end at 33,127.28.
The yield on the benchmark 10-year Treasury crossed 5% for the first time in 16 years on Thursday 19th October 2023, a level that could easily spread through the economy by raising rates on mortgages, credit cards, vehicle loans and more. It retreated slightly from this value on Friday 20th October 2023.
Not to mention, it offers investors an attractive alternative to stocks.
The interest the government pays on national debt has reached a 20-year high as the rate on 30-year bonds touches 5.05%.
A rise in the cost of borrowing comes at a difficult time for the chancellor, Jeremy Hunt, as he prepares for the autumn statement on 22nd November 2023. The chancellor has already made clear that tax cuts will not be announced in the autumn statement.
National debt £2,590,000,000,000
The total amount the UK government owes is called the national debt and it is currently about £2.59 trillion – £2,590,000,000,000.
The government borrows money by selling financial products called bonds. A bond is a promise to pay money in the future. Most require the borrower to make regular interest payments over the bond’s lifetime.
UK government bonds – known as ‘gilts’ – are normally considered very safe, with little risk the money will not be repaid. Gilts are mainly bought by financial institutions in the UK and abroad, such as pension funds, investment funds, banks and insurance companies.
QE
The Bank of England (BoE) has also bought hundreds of billions of pounds’ worth of government bonds in the past to support the economy, through a process called quantitative easing or QE.
A higher rate of interest on government debt will mean the chancellor will have to set aside more cash, to the tune of £23 billion to meet interest payments to the owners of bonds. This in-turn means the UK government may choose to spend less money on public services like healthcare and schools at a time when workers in key industries are demanding pay rises to match the cost of living.
Double debt
The current level of debt is more than double what was seen from the 1980s through to the financial crisis of 2008. The combination of the financial crash in 2007/8 and the Covid pandemic pushed the UK’s debt up from those historic lows to where it stands now. However, in relation to the size of the economy, today’s debt is still low compared with much of the last century.
UK debt £2,590,000,000,000
The U.S, German and Italian borrowing costs also hit their highest levels for more than a decade as markets adjusted to the prospect of a long period of high interest rates and the need for governments around the world to borrow.
It follows an indication from global central banks, including the United States Federal Reserve and the Bank of England (BoE), that interest rates will stay ‘higher for longer’ to continue their jobs of bringing down inflation.
£111billion on debt interest in a year
During the last financial year, the government spent £111 billion on debt interest – more than it spent on education. Some economists fear the government is borrowing too much, at too great a cost. Others argue extra borrowing helps the economy grow faster – generating more tax revenue in the long run.
The Office for Budget Responsibility (OBR), has warned that public debt could soar as the population ages and tax income falls. In an ageing population, the proportion of people of working age drops, meaning the government takes less in tax while paying out more in pensions, welfare and healthcare services.
The stock market has been experiencing some volatility and uncertainty in September and October 2023, as investors fret about inflation, interest rates, and the possibility of a U.S. recession.
Main facts affecting the current stock market
The month of October has produced some severe stock market crashes over the past century, such as the Bank Panic of 1907, the Wall Street Crash of 1929, and Black Monday 1987.
October has also marked the start of several major long-term stock market rallies, such as Black Monday itself and the 2002 nadir of the Nasdaq-100 after the bursting of the dot-com bubble.
The S&P 500 dropped 4.5% in September 2023 and finished the third quarter in the red.
The U.S. Treasury yield curve has been inverted for months – which is a historically strong recession indicator.
The Fed maintained interest rates at the current target range of between 5.25% and 5.5% in September 2023, but signalled that it may need to raise rates again to combat inflation.
The consumer price index gained 3.7% year-over-year in August 2023, down from peak inflation levels of 9.1% in June 2022 but still well above the Fed’s 2% long-term target.
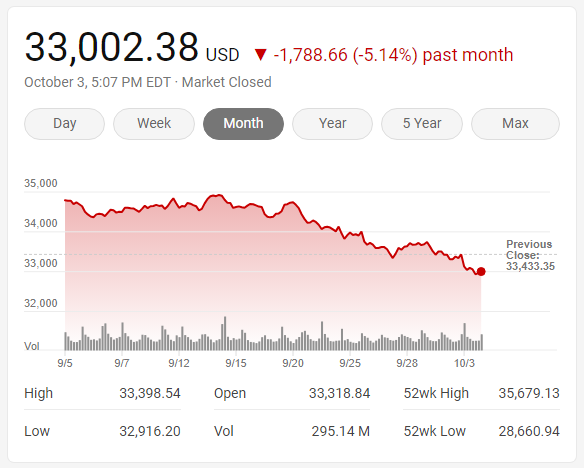
The bond market is currently pricing in an 81.7% chance the Fed will choose not to raise rates again on 1st November 2023.
The Dow Jones Industrial Average was down at 33002, Tuesday 3rd October 2023.
Stocks fell as investors pulled money from equities and moved it to the hot bond market.
International markets also faced significant turmoil, sending mini shockwaves through global financial centres, which reverberated in equities.
The dollar rose to the highest since December and is heading towards the twelfth positive week in a row.
Uncertainty
Uncertainty in the U.S. political system is having a major affect too. Especially with the ousting of the speaker and the real fear of a government shutdown looming large.
The benchmark 10-year Treasury yield rose Wednesday 27th September 2023, to its highest level in more than 15 years, as traders navigated fears of persistent inflation and higher interest rates for longer than expected.
The 10-year Treasury yield climbed to 4.612%. It had reached 4.566% on Tuesday 26th September 2023, its highest level since 2007.
2 year yield
The 2-year Treasury yield also added 6 basis points to 5.139%.
FED said
Federal Reserve suggested last week that interest rates would go higher still and remain elevated for longer, prompting concerns among investors about what it could mean for the economy.