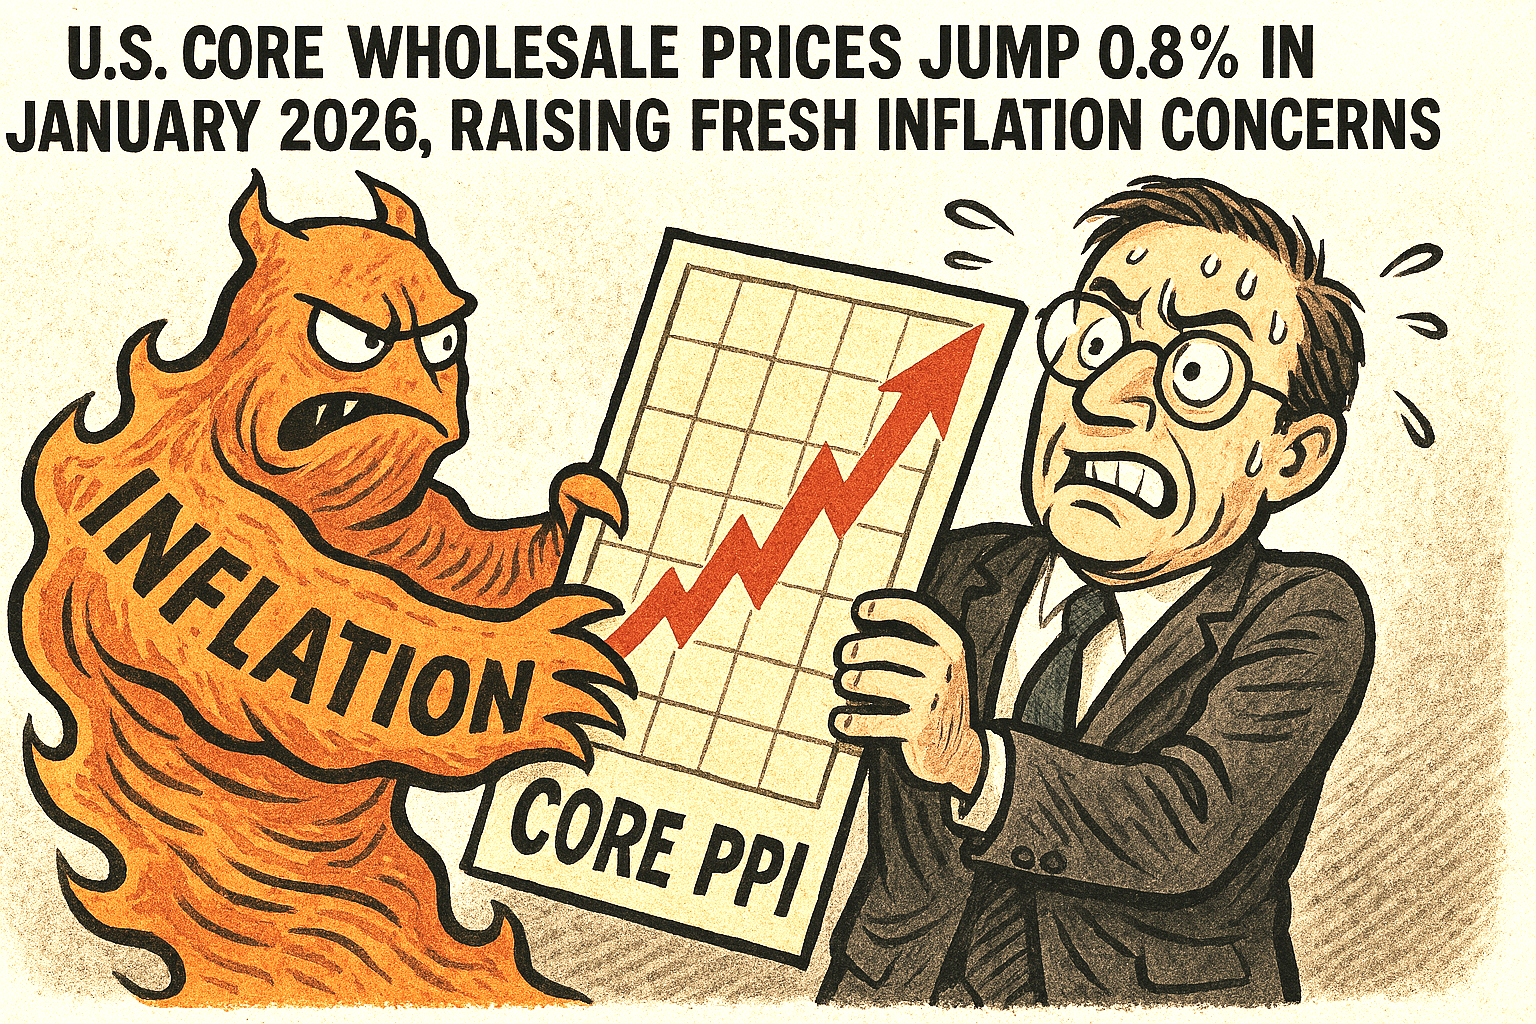
U.S. wholesale prices rose far more sharply than expected in February 2026, underscoring the persistence of inflationary pressures across the economy and complicating the Federal Reserve’s path on interest rates.
The Producer Price Index (PPI), which tracks the prices businesses receive for goods and services, climbed 0.7% on the month—more than double economists’ forecasts. Annual PPI inflation accelerated to 3.4%, its highest level in a year.
The increase was broad-based. Goods prices rose 1.1%, driven by notable jumps in food and energy.
Fresh and dry vegetables surged nearly 49%, while energy costs climbed 2.3%. But the more troubling signal for policymakers came from services, where prices advanced 0.5%.
Portfolio management fees and brokerage-related services saw particularly strong increases, suggesting that inflation is becoming more deeply embedded in the services sector.
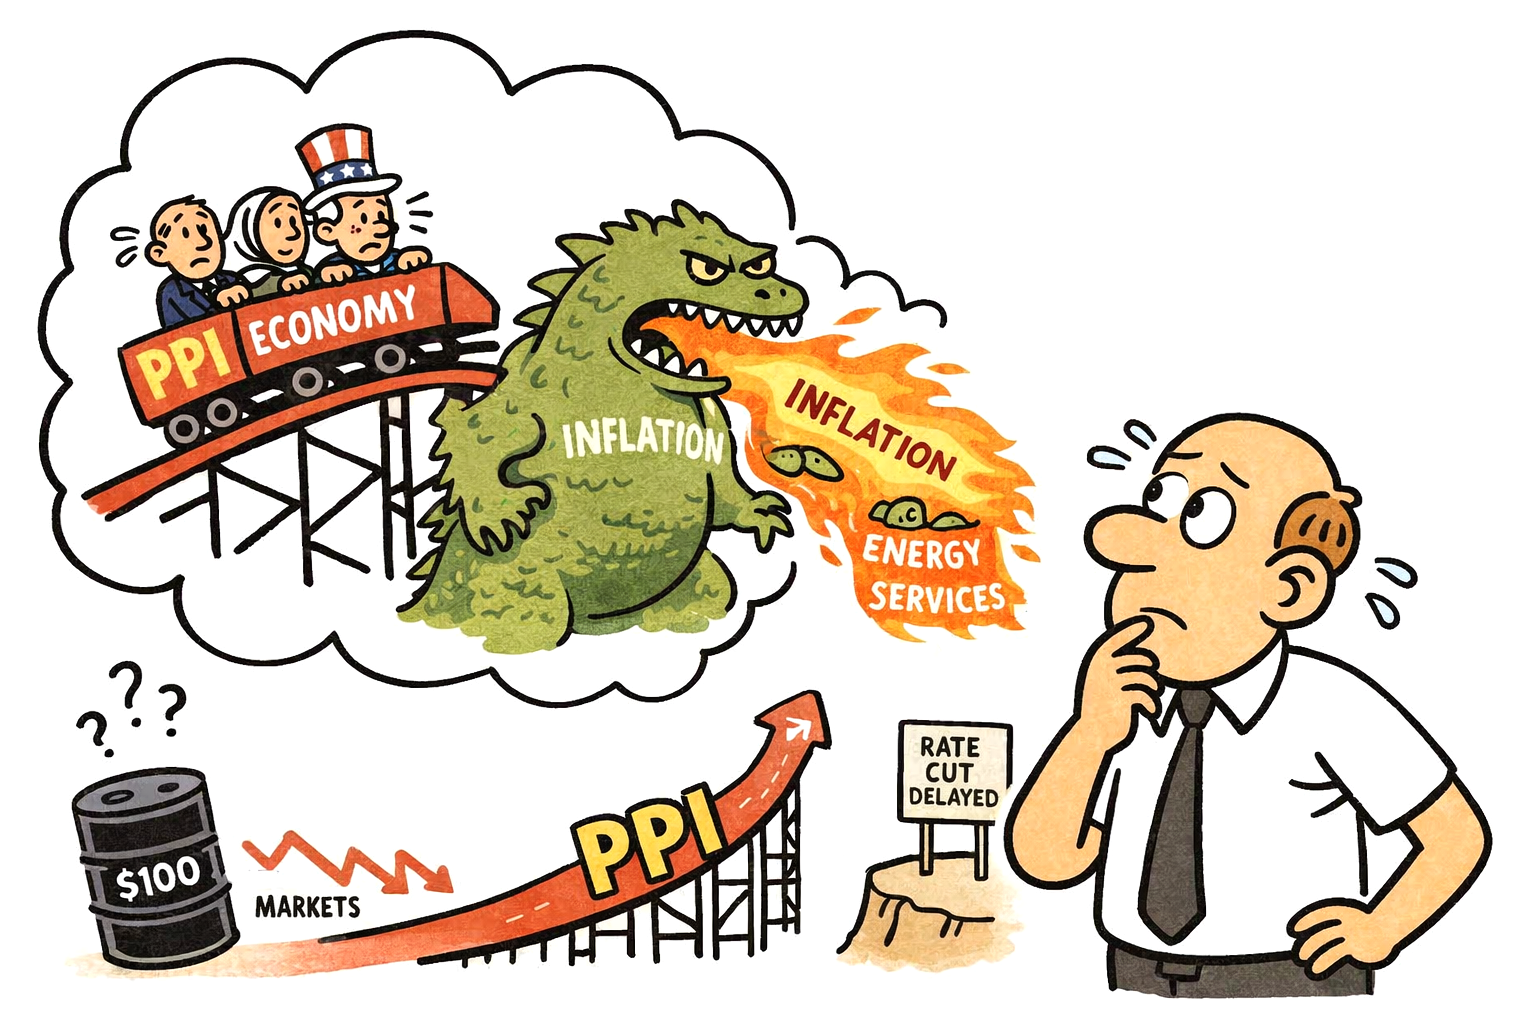
Markets reacted swiftly. U.S. stock futures slipped and Treasury yields moved higher as traders pushed expectations for the next Fed rate cut on to December 2026.
With geopolitical tensions continuing to push oil prices towards and above $100 a barrel, the latest data reinforces concerns that inflation may remain elevated for longer than hoped.
For the Fed, the message is clear: the fight against inflation is far from over.